Free Statistics

of Irreproducible Research!

Author's title

Author*Unverified author*
R Software Modulerwasp_autocorrelation.wasp
Title produced by software(Partial) Autocorrelation Function
Date of computationFri, 27 Nov 2009 09:43:06 -0700
Cite this page as followsStatistical Computations at FreeStatistics.org, Office for Research Development and Education, URL https://freestatistics.org/blog/index.php?v=date/2009/Nov/27/t1259340222eut5mxh8u7sh2pu.htm/, Retrieved Sun, 28 Apr 2024 23:06:09 +0000
Statistical Computations at FreeStatistics.org, Office for Research Development and Education, URL https://freestatistics.org/blog/index.php?pk=60985, Retrieved Sun, 28 Apr 2024 23:06:09 +0000
QR Codes:

Original text written by user:
IsPrivate?No (this computation is public)
User-defined keywords
Estimated Impact118
Family? (F = Feedback message, R = changed R code, M = changed R Module, P = changed Parameters, D = changed Data)
-     [(Partial) Autocorrelation Function] [] [2009-11-27 16:33:53] [a8dc04902f2584d6dc8a82e937850322]
-   P     [(Partial) Autocorrelation Function] [] [2009-11-27 16:43:06] [d39d4e1021a28f94dc953cf77db656ab] [Current]
Feedback Forum

Post a new message
Dataseries X:
12.008	
9.169	
8.788	
8.417	
8.247	
8.197	
8.236	
8.253	
7.733	
8.366	
8.626	
8.863	
10.102	
8.463	
9.114	
8.563	
8.872	
8.301	
8.301	
8.278	
7.736	
7.973	
8.268	
9.476	
11.100	
8.962	
9.173	
8.738	
8.459	
8.078	
8.411	
8.291	
7.810	
8.616	
8.312	
9.692	
9.911	
8.915	
9.452	
9.112	
8.472	
8.230	
8.384	
8.625	
8.221	
8.649	
8.625	
10.443	
10.357	
8.586	
8.892	
8.329	
8.101	
7.922	
8.120	
7.838	
7.735	
8.406	
8.209	
9.451	
10.041	
9.411	
10.405	
8.467	
8.464	
8.102	
7.627	
7.513	
7.510	
8.291	
8.064	
9.383


Summary of computational transaction
Raw Inputview raw input (R code)
Raw Outputview raw output of R engine
Computing time1 seconds
R Server'Gwilym Jenkins' @ 72.249.127.135

\begin{tabular}{lllllllll}
\hline
Summary of computational transaction \tabularnewline
Raw Input & view raw input (R code)  \tabularnewline
Raw Output & view raw output of R engine  \tabularnewline
Computing time & 1 seconds \tabularnewline
R Server & 'Gwilym Jenkins' @ 72.249.127.135 \tabularnewline
\hline
\end{tabular}
%Source: https://freestatistics.org/blog/index.php?pk=60985&T=0

[TABLE]
[ROW][C]Summary of computational transaction[/C][/ROW]
[ROW][C]Raw Input[/C][C]view raw input (R code) [/C][/ROW]
[ROW][C]Raw Output[/C][C]view raw output of R engine [/C][/ROW]
[ROW][C]Computing time[/C][C]1 seconds[/C][/ROW]
[ROW][C]R Server[/C][C]'Gwilym Jenkins' @ 72.249.127.135[/C][/ROW]
[/TABLE]
Source: https://freestatistics.org/blog/index.php?pk=60985&T=0

Globally Unique Identifier (entire table): ba.freestatistics.org/blog/index.php?pk=60985&T=0

As an alternative you can also use a QR Code:  

The GUIDs for individual cells are displayed in the table below:

Summary of computational transaction
Raw Inputview raw input (R code)
Raw Outputview raw output of R engine
Computing time1 seconds
R Server'Gwilym Jenkins' @ 72.249.127.135


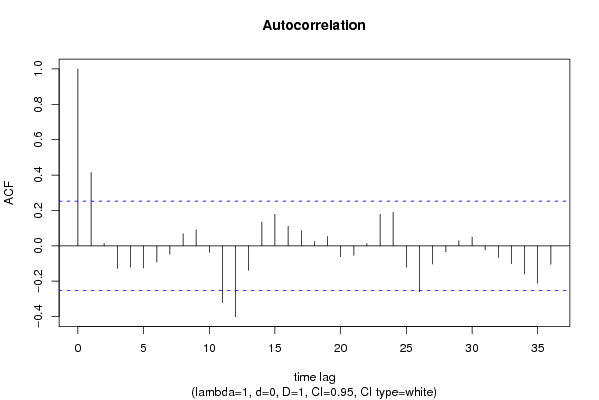
Autocorrelation Function
Time lag kACF(k)T-STATP-value
10.4144113.210.001067
20.0138640.10740.457418
3-0.127692-0.98910.163294
4-0.119506-0.92570.179157
5-0.124734-0.96620.168916
6-0.092033-0.71290.23934
7-0.047062-0.36450.358368
80.0680330.5270.300074
90.0907170.70270.242484
10-0.036468-0.28250.389275
11-0.320886-2.48560.007869
12-0.400281-3.10060.00147
13-0.138028-1.06920.14464
140.1335061.03410.152613
150.1779951.37870.086547
160.1101390.85310.19849
170.0866350.67110.252376
180.0239660.18560.426677
190.052810.40910.341976
20-0.061443-0.47590.317925
21-0.053315-0.4130.340549
220.0127270.09860.460898
230.1788971.38570.085479
240.1897481.46980.073423
25-0.12003-0.92980.178113
26-0.259038-2.00650.024658
27-0.103119-0.79880.213792
28-0.03294-0.25520.399738
290.0294770.22830.410083
300.0499810.38710.350008
31-0.022951-0.17780.429747
32-0.066589-0.51580.303946
33-0.10104-0.78270.218455
34-0.159044-1.23190.111388
35-0.211419-1.63760.053365
36-0.104626-0.81040.210449

\begin{tabular}{lllllllll}
\hline
Autocorrelation Function \tabularnewline
Time lag k & ACF(k) & T-STAT & P-value \tabularnewline
1 & 0.414411 & 3.21 & 0.001067 \tabularnewline
2 & 0.013864 & 0.1074 & 0.457418 \tabularnewline
3 & -0.127692 & -0.9891 & 0.163294 \tabularnewline
4 & -0.119506 & -0.9257 & 0.179157 \tabularnewline
5 & -0.124734 & -0.9662 & 0.168916 \tabularnewline
6 & -0.092033 & -0.7129 & 0.23934 \tabularnewline
7 & -0.047062 & -0.3645 & 0.358368 \tabularnewline
8 & 0.068033 & 0.527 & 0.300074 \tabularnewline
9 & 0.090717 & 0.7027 & 0.242484 \tabularnewline
10 & -0.036468 & -0.2825 & 0.389275 \tabularnewline
11 & -0.320886 & -2.4856 & 0.007869 \tabularnewline
12 & -0.400281 & -3.1006 & 0.00147 \tabularnewline
13 & -0.138028 & -1.0692 & 0.14464 \tabularnewline
14 & 0.133506 & 1.0341 & 0.152613 \tabularnewline
15 & 0.177995 & 1.3787 & 0.086547 \tabularnewline
16 & 0.110139 & 0.8531 & 0.19849 \tabularnewline
17 & 0.086635 & 0.6711 & 0.252376 \tabularnewline
18 & 0.023966 & 0.1856 & 0.426677 \tabularnewline
19 & 0.05281 & 0.4091 & 0.341976 \tabularnewline
20 & -0.061443 & -0.4759 & 0.317925 \tabularnewline
21 & -0.053315 & -0.413 & 0.340549 \tabularnewline
22 & 0.012727 & 0.0986 & 0.460898 \tabularnewline
23 & 0.178897 & 1.3857 & 0.085479 \tabularnewline
24 & 0.189748 & 1.4698 & 0.073423 \tabularnewline
25 & -0.12003 & -0.9298 & 0.178113 \tabularnewline
26 & -0.259038 & -2.0065 & 0.024658 \tabularnewline
27 & -0.103119 & -0.7988 & 0.213792 \tabularnewline
28 & -0.03294 & -0.2552 & 0.399738 \tabularnewline
29 & 0.029477 & 0.2283 & 0.410083 \tabularnewline
30 & 0.049981 & 0.3871 & 0.350008 \tabularnewline
31 & -0.022951 & -0.1778 & 0.429747 \tabularnewline
32 & -0.066589 & -0.5158 & 0.303946 \tabularnewline
33 & -0.10104 & -0.7827 & 0.218455 \tabularnewline
34 & -0.159044 & -1.2319 & 0.111388 \tabularnewline
35 & -0.211419 & -1.6376 & 0.053365 \tabularnewline
36 & -0.104626 & -0.8104 & 0.210449 \tabularnewline
\hline
\end{tabular}
%Source: https://freestatistics.org/blog/index.php?pk=60985&T=1

[TABLE]
[ROW][C]Autocorrelation Function[/C][/ROW]
[ROW][C]Time lag k[/C][C]ACF(k)[/C][C]T-STAT[/C][C]P-value[/C][/ROW]
[ROW][C]1[/C][C]0.414411[/C][C]3.21[/C][C]0.001067[/C][/ROW]
[ROW][C]2[/C][C]0.013864[/C][C]0.1074[/C][C]0.457418[/C][/ROW]
[ROW][C]3[/C][C]-0.127692[/C][C]-0.9891[/C][C]0.163294[/C][/ROW]
[ROW][C]4[/C][C]-0.119506[/C][C]-0.9257[/C][C]0.179157[/C][/ROW]
[ROW][C]5[/C][C]-0.124734[/C][C]-0.9662[/C][C]0.168916[/C][/ROW]
[ROW][C]6[/C][C]-0.092033[/C][C]-0.7129[/C][C]0.23934[/C][/ROW]
[ROW][C]7[/C][C]-0.047062[/C][C]-0.3645[/C][C]0.358368[/C][/ROW]
[ROW][C]8[/C][C]0.068033[/C][C]0.527[/C][C]0.300074[/C][/ROW]
[ROW][C]9[/C][C]0.090717[/C][C]0.7027[/C][C]0.242484[/C][/ROW]
[ROW][C]10[/C][C]-0.036468[/C][C]-0.2825[/C][C]0.389275[/C][/ROW]
[ROW][C]11[/C][C]-0.320886[/C][C]-2.4856[/C][C]0.007869[/C][/ROW]
[ROW][C]12[/C][C]-0.400281[/C][C]-3.1006[/C][C]0.00147[/C][/ROW]
[ROW][C]13[/C][C]-0.138028[/C][C]-1.0692[/C][C]0.14464[/C][/ROW]
[ROW][C]14[/C][C]0.133506[/C][C]1.0341[/C][C]0.152613[/C][/ROW]
[ROW][C]15[/C][C]0.177995[/C][C]1.3787[/C][C]0.086547[/C][/ROW]
[ROW][C]16[/C][C]0.110139[/C][C]0.8531[/C][C]0.19849[/C][/ROW]
[ROW][C]17[/C][C]0.086635[/C][C]0.6711[/C][C]0.252376[/C][/ROW]
[ROW][C]18[/C][C]0.023966[/C][C]0.1856[/C][C]0.426677[/C][/ROW]
[ROW][C]19[/C][C]0.05281[/C][C]0.4091[/C][C]0.341976[/C][/ROW]
[ROW][C]20[/C][C]-0.061443[/C][C]-0.4759[/C][C]0.317925[/C][/ROW]
[ROW][C]21[/C][C]-0.053315[/C][C]-0.413[/C][C]0.340549[/C][/ROW]
[ROW][C]22[/C][C]0.012727[/C][C]0.0986[/C][C]0.460898[/C][/ROW]
[ROW][C]23[/C][C]0.178897[/C][C]1.3857[/C][C]0.085479[/C][/ROW]
[ROW][C]24[/C][C]0.189748[/C][C]1.4698[/C][C]0.073423[/C][/ROW]
[ROW][C]25[/C][C]-0.12003[/C][C]-0.9298[/C][C]0.178113[/C][/ROW]
[ROW][C]26[/C][C]-0.259038[/C][C]-2.0065[/C][C]0.024658[/C][/ROW]
[ROW][C]27[/C][C]-0.103119[/C][C]-0.7988[/C][C]0.213792[/C][/ROW]
[ROW][C]28[/C][C]-0.03294[/C][C]-0.2552[/C][C]0.399738[/C][/ROW]
[ROW][C]29[/C][C]0.029477[/C][C]0.2283[/C][C]0.410083[/C][/ROW]
[ROW][C]30[/C][C]0.049981[/C][C]0.3871[/C][C]0.350008[/C][/ROW]
[ROW][C]31[/C][C]-0.022951[/C][C]-0.1778[/C][C]0.429747[/C][/ROW]
[ROW][C]32[/C][C]-0.066589[/C][C]-0.5158[/C][C]0.303946[/C][/ROW]
[ROW][C]33[/C][C]-0.10104[/C][C]-0.7827[/C][C]0.218455[/C][/ROW]
[ROW][C]34[/C][C]-0.159044[/C][C]-1.2319[/C][C]0.111388[/C][/ROW]
[ROW][C]35[/C][C]-0.211419[/C][C]-1.6376[/C][C]0.053365[/C][/ROW]
[ROW][C]36[/C][C]-0.104626[/C][C]-0.8104[/C][C]0.210449[/C][/ROW]
[/TABLE]
Source: https://freestatistics.org/blog/index.php?pk=60985&T=1

Globally Unique Identifier (entire table): ba.freestatistics.org/blog/index.php?pk=60985&T=1

As an alternative you can also use a QR Code:  

The GUIDs for individual cells are displayed in the table below:

Autocorrelation Function
Time lag kACF(k)T-STATP-value
10.4144113.210.001067
20.0138640.10740.457418
3-0.127692-0.98910.163294
4-0.119506-0.92570.179157
5-0.124734-0.96620.168916
6-0.092033-0.71290.23934
7-0.047062-0.36450.358368
80.0680330.5270.300074
90.0907170.70270.242484
10-0.036468-0.28250.389275
11-0.320886-2.48560.007869
12-0.400281-3.10060.00147
13-0.138028-1.06920.14464
140.1335061.03410.152613
150.1779951.37870.086547
160.1101390.85310.19849
170.0866350.67110.252376
180.0239660.18560.426677
190.052810.40910.341976
20-0.061443-0.47590.317925
21-0.053315-0.4130.340549
220.0127270.09860.460898
230.1788971.38570.085479
240.1897481.46980.073423
25-0.12003-0.92980.178113
26-0.259038-2.00650.024658
27-0.103119-0.79880.213792
28-0.03294-0.25520.399738
290.0294770.22830.410083
300.0499810.38710.350008
31-0.022951-0.17780.429747
32-0.066589-0.51580.303946
33-0.10104-0.78270.218455
34-0.159044-1.23190.111388
35-0.211419-1.63760.053365
36-0.104626-0.81040.210449


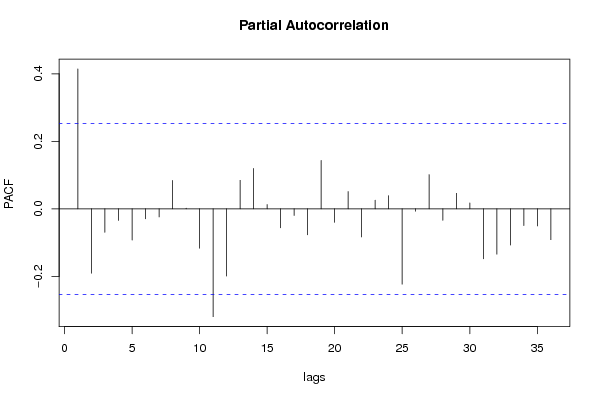
Partial Autocorrelation Function
Time lag kPACF(k)T-STATP-value
10.4144113.210.001067
2-0.190606-1.47640.072529
3-0.069588-0.5390.295931
4-0.034234-0.26520.395893
5-0.092457-0.71620.238333
6-0.029565-0.2290.40982
7-0.023883-0.1850.426926
80.084070.65120.2587
90.002090.01620.493567
10-0.116463-0.90210.185301
11-0.319274-2.47310.008122
12-0.198964-1.54120.064266
130.0845570.6550.257492
140.1197570.92760.178658
150.0126780.09820.461048
16-0.056255-0.43580.33229
17-0.019455-0.15070.44036
18-0.076757-0.59460.277188
190.1432831.10990.135743
20-0.039834-0.30860.379364
210.0513530.39780.346101
22-0.083022-0.64310.261309
230.0258350.20010.421033
240.0388840.30120.382153
25-0.222936-1.72690.04467
26-0.007036-0.05450.478358
270.1014270.78560.217583
28-0.033802-0.26180.397176
290.0459340.35580.361617
300.0176310.13660.445915
31-0.148053-1.14680.128005
32-0.134247-1.03990.151286
33-0.107209-0.83040.204792
34-0.049539-0.38370.351268
35-0.050481-0.3910.348582
36-0.091205-0.70650.241314

\begin{tabular}{lllllllll}
\hline
Partial Autocorrelation Function \tabularnewline
Time lag k & PACF(k) & T-STAT & P-value \tabularnewline
1 & 0.414411 & 3.21 & 0.001067 \tabularnewline
2 & -0.190606 & -1.4764 & 0.072529 \tabularnewline
3 & -0.069588 & -0.539 & 0.295931 \tabularnewline
4 & -0.034234 & -0.2652 & 0.395893 \tabularnewline
5 & -0.092457 & -0.7162 & 0.238333 \tabularnewline
6 & -0.029565 & -0.229 & 0.40982 \tabularnewline
7 & -0.023883 & -0.185 & 0.426926 \tabularnewline
8 & 0.08407 & 0.6512 & 0.2587 \tabularnewline
9 & 0.00209 & 0.0162 & 0.493567 \tabularnewline
10 & -0.116463 & -0.9021 & 0.185301 \tabularnewline
11 & -0.319274 & -2.4731 & 0.008122 \tabularnewline
12 & -0.198964 & -1.5412 & 0.064266 \tabularnewline
13 & 0.084557 & 0.655 & 0.257492 \tabularnewline
14 & 0.119757 & 0.9276 & 0.178658 \tabularnewline
15 & 0.012678 & 0.0982 & 0.461048 \tabularnewline
16 & -0.056255 & -0.4358 & 0.33229 \tabularnewline
17 & -0.019455 & -0.1507 & 0.44036 \tabularnewline
18 & -0.076757 & -0.5946 & 0.277188 \tabularnewline
19 & 0.143283 & 1.1099 & 0.135743 \tabularnewline
20 & -0.039834 & -0.3086 & 0.379364 \tabularnewline
21 & 0.051353 & 0.3978 & 0.346101 \tabularnewline
22 & -0.083022 & -0.6431 & 0.261309 \tabularnewline
23 & 0.025835 & 0.2001 & 0.421033 \tabularnewline
24 & 0.038884 & 0.3012 & 0.382153 \tabularnewline
25 & -0.222936 & -1.7269 & 0.04467 \tabularnewline
26 & -0.007036 & -0.0545 & 0.478358 \tabularnewline
27 & 0.101427 & 0.7856 & 0.217583 \tabularnewline
28 & -0.033802 & -0.2618 & 0.397176 \tabularnewline
29 & 0.045934 & 0.3558 & 0.361617 \tabularnewline
30 & 0.017631 & 0.1366 & 0.445915 \tabularnewline
31 & -0.148053 & -1.1468 & 0.128005 \tabularnewline
32 & -0.134247 & -1.0399 & 0.151286 \tabularnewline
33 & -0.107209 & -0.8304 & 0.204792 \tabularnewline
34 & -0.049539 & -0.3837 & 0.351268 \tabularnewline
35 & -0.050481 & -0.391 & 0.348582 \tabularnewline
36 & -0.091205 & -0.7065 & 0.241314 \tabularnewline
\hline
\end{tabular}
%Source: https://freestatistics.org/blog/index.php?pk=60985&T=2

[TABLE]
[ROW][C]Partial Autocorrelation Function[/C][/ROW]
[ROW][C]Time lag k[/C][C]PACF(k)[/C][C]T-STAT[/C][C]P-value[/C][/ROW]
[ROW][C]1[/C][C]0.414411[/C][C]3.21[/C][C]0.001067[/C][/ROW]
[ROW][C]2[/C][C]-0.190606[/C][C]-1.4764[/C][C]0.072529[/C][/ROW]
[ROW][C]3[/C][C]-0.069588[/C][C]-0.539[/C][C]0.295931[/C][/ROW]
[ROW][C]4[/C][C]-0.034234[/C][C]-0.2652[/C][C]0.395893[/C][/ROW]
[ROW][C]5[/C][C]-0.092457[/C][C]-0.7162[/C][C]0.238333[/C][/ROW]
[ROW][C]6[/C][C]-0.029565[/C][C]-0.229[/C][C]0.40982[/C][/ROW]
[ROW][C]7[/C][C]-0.023883[/C][C]-0.185[/C][C]0.426926[/C][/ROW]
[ROW][C]8[/C][C]0.08407[/C][C]0.6512[/C][C]0.2587[/C][/ROW]
[ROW][C]9[/C][C]0.00209[/C][C]0.0162[/C][C]0.493567[/C][/ROW]
[ROW][C]10[/C][C]-0.116463[/C][C]-0.9021[/C][C]0.185301[/C][/ROW]
[ROW][C]11[/C][C]-0.319274[/C][C]-2.4731[/C][C]0.008122[/C][/ROW]
[ROW][C]12[/C][C]-0.198964[/C][C]-1.5412[/C][C]0.064266[/C][/ROW]
[ROW][C]13[/C][C]0.084557[/C][C]0.655[/C][C]0.257492[/C][/ROW]
[ROW][C]14[/C][C]0.119757[/C][C]0.9276[/C][C]0.178658[/C][/ROW]
[ROW][C]15[/C][C]0.012678[/C][C]0.0982[/C][C]0.461048[/C][/ROW]
[ROW][C]16[/C][C]-0.056255[/C][C]-0.4358[/C][C]0.33229[/C][/ROW]
[ROW][C]17[/C][C]-0.019455[/C][C]-0.1507[/C][C]0.44036[/C][/ROW]
[ROW][C]18[/C][C]-0.076757[/C][C]-0.5946[/C][C]0.277188[/C][/ROW]
[ROW][C]19[/C][C]0.143283[/C][C]1.1099[/C][C]0.135743[/C][/ROW]
[ROW][C]20[/C][C]-0.039834[/C][C]-0.3086[/C][C]0.379364[/C][/ROW]
[ROW][C]21[/C][C]0.051353[/C][C]0.3978[/C][C]0.346101[/C][/ROW]
[ROW][C]22[/C][C]-0.083022[/C][C]-0.6431[/C][C]0.261309[/C][/ROW]
[ROW][C]23[/C][C]0.025835[/C][C]0.2001[/C][C]0.421033[/C][/ROW]
[ROW][C]24[/C][C]0.038884[/C][C]0.3012[/C][C]0.382153[/C][/ROW]
[ROW][C]25[/C][C]-0.222936[/C][C]-1.7269[/C][C]0.04467[/C][/ROW]
[ROW][C]26[/C][C]-0.007036[/C][C]-0.0545[/C][C]0.478358[/C][/ROW]
[ROW][C]27[/C][C]0.101427[/C][C]0.7856[/C][C]0.217583[/C][/ROW]
[ROW][C]28[/C][C]-0.033802[/C][C]-0.2618[/C][C]0.397176[/C][/ROW]
[ROW][C]29[/C][C]0.045934[/C][C]0.3558[/C][C]0.361617[/C][/ROW]
[ROW][C]30[/C][C]0.017631[/C][C]0.1366[/C][C]0.445915[/C][/ROW]
[ROW][C]31[/C][C]-0.148053[/C][C]-1.1468[/C][C]0.128005[/C][/ROW]
[ROW][C]32[/C][C]-0.134247[/C][C]-1.0399[/C][C]0.151286[/C][/ROW]
[ROW][C]33[/C][C]-0.107209[/C][C]-0.8304[/C][C]0.204792[/C][/ROW]
[ROW][C]34[/C][C]-0.049539[/C][C]-0.3837[/C][C]0.351268[/C][/ROW]
[ROW][C]35[/C][C]-0.050481[/C][C]-0.391[/C][C]0.348582[/C][/ROW]
[ROW][C]36[/C][C]-0.091205[/C][C]-0.7065[/C][C]0.241314[/C][/ROW]
[/TABLE]
Source: https://freestatistics.org/blog/index.php?pk=60985&T=2

Globally Unique Identifier (entire table): ba.freestatistics.org/blog/index.php?pk=60985&T=2

As an alternative you can also use a QR Code:  

The GUIDs for individual cells are displayed in the table below:

Partial Autocorrelation Function
Time lag kPACF(k)T-STATP-value
10.4144113.210.001067
2-0.190606-1.47640.072529
3-0.069588-0.5390.295931
4-0.034234-0.26520.395893
5-0.092457-0.71620.238333
6-0.029565-0.2290.40982
7-0.023883-0.1850.426926
80.084070.65120.2587
90.002090.01620.493567
10-0.116463-0.90210.185301
11-0.319274-2.47310.008122
12-0.198964-1.54120.064266
130.0845570.6550.257492
140.1197570.92760.178658
150.0126780.09820.461048
16-0.056255-0.43580.33229
17-0.019455-0.15070.44036
18-0.076757-0.59460.277188
190.1432831.10990.135743
20-0.039834-0.30860.379364
210.0513530.39780.346101
22-0.083022-0.64310.261309
230.0258350.20010.421033
240.0388840.30120.382153
25-0.222936-1.72690.04467
26-0.007036-0.05450.478358
270.1014270.78560.217583
28-0.033802-0.26180.397176
290.0459340.35580.361617
300.0176310.13660.445915
31-0.148053-1.14680.128005
32-0.134247-1.03990.151286
33-0.107209-0.83040.204792
34-0.049539-0.38370.351268
35-0.050481-0.3910.348582
36-0.091205-0.70650.241314


Parameters (Session):
par1 = 36 ; par2 = 1 ; par3 = 0 ; par4 = 1 ; par5 = 12 ; par6 = White Noise ; par7 = 0.95 ;
Parameters (R input):
par1 = 36 ; par2 = 1 ; par3 = 0 ; par4 = 1 ; par5 = 12 ; par6 = White Noise ; par7 = 0.95 ;
R code (references can be found in the software module):
if (par1 == 'Default') {
par1 = 10*log10(length(x))
} else {
par1 <- as.numeric(par1)
}
par2 <- as.numeric(par2)
par3 <- as.numeric(par3)
par4 <- as.numeric(par4)
par5 <- as.numeric(par5)
if (par6 == 'White Noise') par6 <- 'white' else par6 <- 'ma'
par7 <- as.numeric(par7)
if (par2 == 0) {
x <- log(x)
} else {
x <- (x ^ par2 - 1) / par2
}
if (par3 > 0) x <- diff(x,lag=1,difference=par3)
if (par4 > 0) x <- diff(x,lag=par5,difference=par4)
bitmap(file='pic1.png')
racf <- acf(x, par1, main='Autocorrelation', xlab='time lag', ylab='ACF', ci.type=par6, ci=par7, sub=paste('(lambda=',par2,', d=',par3,', D=',par4,', CI=', par7, ', CI type=',par6,')',sep=''))
dev.off()
bitmap(file='pic2.png')
rpacf <- pacf(x,par1,main='Partial Autocorrelation',xlab='lags',ylab='PACF')
dev.off()
(myacf <- c(racf$acf))
(mypacf <- c(rpacf$acf))
lengthx <- length(x)
sqrtn <- sqrt(lengthx)
load(file='createtable')
a<-table.start()
a<-table.row.start(a)
a<-table.element(a,'Autocorrelation Function',4,TRUE)
a<-table.row.end(a)
a<-table.row.start(a)
a<-table.element(a,'Time lag k',header=TRUE)
a<-table.element(a,hyperlink('basics.htm','ACF(k)','click here for more information about the Autocorrelation Function'),header=TRUE)
a<-table.element(a,'T-STAT',header=TRUE)
a<-table.element(a,'P-value',header=TRUE)
a<-table.row.end(a)
for (i in 2:(par1+1)) {
a<-table.row.start(a)
a<-table.element(a,i-1,header=TRUE)
a<-table.element(a,round(myacf[i],6))
mytstat <- myacf[i]*sqrtn
a<-table.element(a,round(mytstat,4))
a<-table.element(a,round(1-pt(abs(mytstat),lengthx),6))
a<-table.row.end(a)
}
a<-table.end(a)
table.save(a,file='mytable.tab')
a<-table.start()
a<-table.row.start(a)
a<-table.element(a,'Partial Autocorrelation Function',4,TRUE)
a<-table.row.end(a)
a<-table.row.start(a)
a<-table.element(a,'Time lag k',header=TRUE)
a<-table.element(a,hyperlink('basics.htm','PACF(k)','click here for more information about the Partial Autocorrelation Function'),header=TRUE)
a<-table.element(a,'T-STAT',header=TRUE)
a<-table.element(a,'P-value',header=TRUE)
a<-table.row.end(a)
for (i in 1:par1) {
a<-table.row.start(a)
a<-table.element(a,i,header=TRUE)
a<-table.element(a,round(mypacf[i],6))
mytstat <- mypacf[i]*sqrtn
a<-table.element(a,round(mytstat,4))
a<-table.element(a,round(1-pt(abs(mytstat),lengthx),6))
a<-table.row.end(a)
}
a<-table.end(a)
table.save(a,file='mytable1.tab')