Free Statistics

of Irreproducible Research!

Author's title

Author*The author of this computation has been verified*
R Software Modulerwasp_autocorrelation.wasp
Title produced by software(Partial) Autocorrelation Function
Date of computationFri, 27 Nov 2009 10:14:17 -0700
Cite this page as followsStatistical Computations at FreeStatistics.org, Office for Research Development and Education, URL https://freestatistics.org/blog/index.php?v=date/2009/Nov/27/t1259342105tw0pmq3897erta3.htm/, Retrieved Sun, 28 Apr 2024 23:28:58 +0000
Statistical Computations at FreeStatistics.org, Office for Research Development and Education, URL https://freestatistics.org/blog/index.php?pk=61018, Retrieved Sun, 28 Apr 2024 23:28:58 +0000
QR Codes:

Original text written by user:
IsPrivate?No (this computation is public)
User-defined keywords
Estimated Impact113
Family? (F = Feedback message, R = changed R code, M = changed R Module, P = changed Parameters, D = changed Data)
-       [(Partial) Autocorrelation Function] [] [2009-11-27 17:14:17] [71596e6a53ccce532e52aaf6113616ef] [Current]
Feedback Forum

Post a new message
Dataseries X:
252,5
251,1
255,1
258,3
255,3
261,1
253,8
252,9
253,9
255,5
262
262,8
263,3
262,5
269,2
270,8
274,1
273
267,3
267,1
268,2
270,2
271,5
281
280,1
281,5
285,9
289,8
292,9
291,2
291,8
289,8
292,5
290,3
297,5
307,5
304,7
304,6
310,7
310,7
315,7
314,7
312,2
312,8
314,3
319,7
319,9
329,5
326,9
329,7
335,7
337,2
339,7
338,3
339,2
342,5
342,2
338,3
339
345,9


Summary of computational transaction
Raw Inputview raw input (R code)
Raw Outputview raw output of R engine
Computing time1 seconds
R Server'Gwilym Jenkins' @ 72.249.127.135

\begin{tabular}{lllllllll}
\hline
Summary of computational transaction \tabularnewline
Raw Input & view raw input (R code)  \tabularnewline
Raw Output & view raw output of R engine  \tabularnewline
Computing time & 1 seconds \tabularnewline
R Server & 'Gwilym Jenkins' @ 72.249.127.135 \tabularnewline
\hline
\end{tabular}
%Source: https://freestatistics.org/blog/index.php?pk=61018&T=0

[TABLE]
[ROW][C]Summary of computational transaction[/C][/ROW]
[ROW][C]Raw Input[/C][C]view raw input (R code) [/C][/ROW]
[ROW][C]Raw Output[/C][C]view raw output of R engine [/C][/ROW]
[ROW][C]Computing time[/C][C]1 seconds[/C][/ROW]
[ROW][C]R Server[/C][C]'Gwilym Jenkins' @ 72.249.127.135[/C][/ROW]
[/TABLE]
Source: https://freestatistics.org/blog/index.php?pk=61018&T=0

Globally Unique Identifier (entire table): ba.freestatistics.org/blog/index.php?pk=61018&T=0

As an alternative you can also use a QR Code:  

The GUIDs for individual cells are displayed in the table below:

Summary of computational transaction
Raw Inputview raw input (R code)
Raw Outputview raw output of R engine
Computing time1 seconds
R Server'Gwilym Jenkins' @ 72.249.127.135


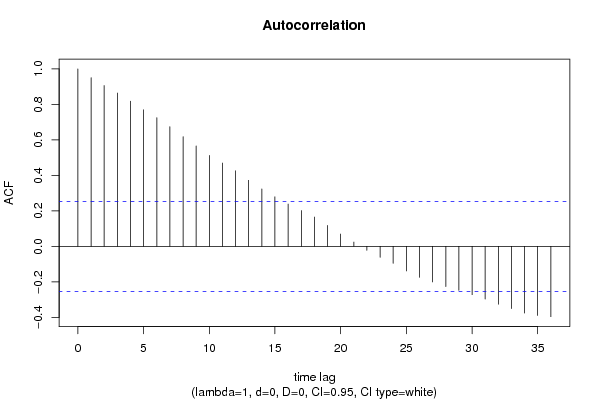
Autocorrelation Function
Time lag kACF(k)T-STATP-value
10.9506247.36350
20.9062317.01960
30.8640256.69270
40.818266.33820
50.7695725.96110
60.7251185.61670
70.6743465.22351e-06
80.6184754.79076e-06
90.5663074.38662.4e-05
100.5126823.97129.7e-05
110.4696743.63810.000286
120.4261533.3010.000813
130.3719882.88140.002742
140.3238352.50840.007424
150.2796272.1660.017148
160.2387111.8490.03469
170.2019771.56450.061479
180.1648431.27690.103284
190.1179350.91350.182312
200.0694680.53810.296251
210.0243080.18830.425642
22-0.02225-0.17230.431872
23-0.061819-0.47880.316895
24-0.095204-0.73740.231863
25-0.138636-1.07390.143591
26-0.174348-1.35050.090965
27-0.200277-1.55130.06304
28-0.226785-1.75670.042038
29-0.24769-1.91860.029898
30-0.27201-2.1070.019654
31-0.297141-2.30160.012422
32-0.325974-2.5250.007116
33-0.350478-2.71480.004324
34-0.375586-2.90930.002537
35-0.389027-3.01340.00189
36-0.396133-3.06840.001614

\begin{tabular}{lllllllll}
\hline
Autocorrelation Function \tabularnewline
Time lag k & ACF(k) & T-STAT & P-value \tabularnewline
1 & 0.950624 & 7.3635 & 0 \tabularnewline
2 & 0.906231 & 7.0196 & 0 \tabularnewline
3 & 0.864025 & 6.6927 & 0 \tabularnewline
4 & 0.81826 & 6.3382 & 0 \tabularnewline
5 & 0.769572 & 5.9611 & 0 \tabularnewline
6 & 0.725118 & 5.6167 & 0 \tabularnewline
7 & 0.674346 & 5.2235 & 1e-06 \tabularnewline
8 & 0.618475 & 4.7907 & 6e-06 \tabularnewline
9 & 0.566307 & 4.3866 & 2.4e-05 \tabularnewline
10 & 0.512682 & 3.9712 & 9.7e-05 \tabularnewline
11 & 0.469674 & 3.6381 & 0.000286 \tabularnewline
12 & 0.426153 & 3.301 & 0.000813 \tabularnewline
13 & 0.371988 & 2.8814 & 0.002742 \tabularnewline
14 & 0.323835 & 2.5084 & 0.007424 \tabularnewline
15 & 0.279627 & 2.166 & 0.017148 \tabularnewline
16 & 0.238711 & 1.849 & 0.03469 \tabularnewline
17 & 0.201977 & 1.5645 & 0.061479 \tabularnewline
18 & 0.164843 & 1.2769 & 0.103284 \tabularnewline
19 & 0.117935 & 0.9135 & 0.182312 \tabularnewline
20 & 0.069468 & 0.5381 & 0.296251 \tabularnewline
21 & 0.024308 & 0.1883 & 0.425642 \tabularnewline
22 & -0.02225 & -0.1723 & 0.431872 \tabularnewline
23 & -0.061819 & -0.4788 & 0.316895 \tabularnewline
24 & -0.095204 & -0.7374 & 0.231863 \tabularnewline
25 & -0.138636 & -1.0739 & 0.143591 \tabularnewline
26 & -0.174348 & -1.3505 & 0.090965 \tabularnewline
27 & -0.200277 & -1.5513 & 0.06304 \tabularnewline
28 & -0.226785 & -1.7567 & 0.042038 \tabularnewline
29 & -0.24769 & -1.9186 & 0.029898 \tabularnewline
30 & -0.27201 & -2.107 & 0.019654 \tabularnewline
31 & -0.297141 & -2.3016 & 0.012422 \tabularnewline
32 & -0.325974 & -2.525 & 0.007116 \tabularnewline
33 & -0.350478 & -2.7148 & 0.004324 \tabularnewline
34 & -0.375586 & -2.9093 & 0.002537 \tabularnewline
35 & -0.389027 & -3.0134 & 0.00189 \tabularnewline
36 & -0.396133 & -3.0684 & 0.001614 \tabularnewline
\hline
\end{tabular}
%Source: https://freestatistics.org/blog/index.php?pk=61018&T=1

[TABLE]
[ROW][C]Autocorrelation Function[/C][/ROW]
[ROW][C]Time lag k[/C][C]ACF(k)[/C][C]T-STAT[/C][C]P-value[/C][/ROW]
[ROW][C]1[/C][C]0.950624[/C][C]7.3635[/C][C]0[/C][/ROW]
[ROW][C]2[/C][C]0.906231[/C][C]7.0196[/C][C]0[/C][/ROW]
[ROW][C]3[/C][C]0.864025[/C][C]6.6927[/C][C]0[/C][/ROW]
[ROW][C]4[/C][C]0.81826[/C][C]6.3382[/C][C]0[/C][/ROW]
[ROW][C]5[/C][C]0.769572[/C][C]5.9611[/C][C]0[/C][/ROW]
[ROW][C]6[/C][C]0.725118[/C][C]5.6167[/C][C]0[/C][/ROW]
[ROW][C]7[/C][C]0.674346[/C][C]5.2235[/C][C]1e-06[/C][/ROW]
[ROW][C]8[/C][C]0.618475[/C][C]4.7907[/C][C]6e-06[/C][/ROW]
[ROW][C]9[/C][C]0.566307[/C][C]4.3866[/C][C]2.4e-05[/C][/ROW]
[ROW][C]10[/C][C]0.512682[/C][C]3.9712[/C][C]9.7e-05[/C][/ROW]
[ROW][C]11[/C][C]0.469674[/C][C]3.6381[/C][C]0.000286[/C][/ROW]
[ROW][C]12[/C][C]0.426153[/C][C]3.301[/C][C]0.000813[/C][/ROW]
[ROW][C]13[/C][C]0.371988[/C][C]2.8814[/C][C]0.002742[/C][/ROW]
[ROW][C]14[/C][C]0.323835[/C][C]2.5084[/C][C]0.007424[/C][/ROW]
[ROW][C]15[/C][C]0.279627[/C][C]2.166[/C][C]0.017148[/C][/ROW]
[ROW][C]16[/C][C]0.238711[/C][C]1.849[/C][C]0.03469[/C][/ROW]
[ROW][C]17[/C][C]0.201977[/C][C]1.5645[/C][C]0.061479[/C][/ROW]
[ROW][C]18[/C][C]0.164843[/C][C]1.2769[/C][C]0.103284[/C][/ROW]
[ROW][C]19[/C][C]0.117935[/C][C]0.9135[/C][C]0.182312[/C][/ROW]
[ROW][C]20[/C][C]0.069468[/C][C]0.5381[/C][C]0.296251[/C][/ROW]
[ROW][C]21[/C][C]0.024308[/C][C]0.1883[/C][C]0.425642[/C][/ROW]
[ROW][C]22[/C][C]-0.02225[/C][C]-0.1723[/C][C]0.431872[/C][/ROW]
[ROW][C]23[/C][C]-0.061819[/C][C]-0.4788[/C][C]0.316895[/C][/ROW]
[ROW][C]24[/C][C]-0.095204[/C][C]-0.7374[/C][C]0.231863[/C][/ROW]
[ROW][C]25[/C][C]-0.138636[/C][C]-1.0739[/C][C]0.143591[/C][/ROW]
[ROW][C]26[/C][C]-0.174348[/C][C]-1.3505[/C][C]0.090965[/C][/ROW]
[ROW][C]27[/C][C]-0.200277[/C][C]-1.5513[/C][C]0.06304[/C][/ROW]
[ROW][C]28[/C][C]-0.226785[/C][C]-1.7567[/C][C]0.042038[/C][/ROW]
[ROW][C]29[/C][C]-0.24769[/C][C]-1.9186[/C][C]0.029898[/C][/ROW]
[ROW][C]30[/C][C]-0.27201[/C][C]-2.107[/C][C]0.019654[/C][/ROW]
[ROW][C]31[/C][C]-0.297141[/C][C]-2.3016[/C][C]0.012422[/C][/ROW]
[ROW][C]32[/C][C]-0.325974[/C][C]-2.525[/C][C]0.007116[/C][/ROW]
[ROW][C]33[/C][C]-0.350478[/C][C]-2.7148[/C][C]0.004324[/C][/ROW]
[ROW][C]34[/C][C]-0.375586[/C][C]-2.9093[/C][C]0.002537[/C][/ROW]
[ROW][C]35[/C][C]-0.389027[/C][C]-3.0134[/C][C]0.00189[/C][/ROW]
[ROW][C]36[/C][C]-0.396133[/C][C]-3.0684[/C][C]0.001614[/C][/ROW]
[/TABLE]
Source: https://freestatistics.org/blog/index.php?pk=61018&T=1

Globally Unique Identifier (entire table): ba.freestatistics.org/blog/index.php?pk=61018&T=1

As an alternative you can also use a QR Code:  

The GUIDs for individual cells are displayed in the table below:

Autocorrelation Function
Time lag kACF(k)T-STATP-value
10.9506247.36350
20.9062317.01960
30.8640256.69270
40.818266.33820
50.7695725.96110
60.7251185.61670
70.6743465.22351e-06
80.6184754.79076e-06
90.5663074.38662.4e-05
100.5126823.97129.7e-05
110.4696743.63810.000286
120.4261533.3010.000813
130.3719882.88140.002742
140.3238352.50840.007424
150.2796272.1660.017148
160.2387111.8490.03469
170.2019771.56450.061479
180.1648431.27690.103284
190.1179350.91350.182312
200.0694680.53810.296251
210.0243080.18830.425642
22-0.02225-0.17230.431872
23-0.061819-0.47880.316895
24-0.095204-0.73740.231863
25-0.138636-1.07390.143591
26-0.174348-1.35050.090965
27-0.200277-1.55130.06304
28-0.226785-1.75670.042038
29-0.24769-1.91860.029898
30-0.27201-2.1070.019654
31-0.297141-2.30160.012422
32-0.325974-2.5250.007116
33-0.350478-2.71480.004324
34-0.375586-2.90930.002537
35-0.389027-3.01340.00189
36-0.396133-3.06840.001614


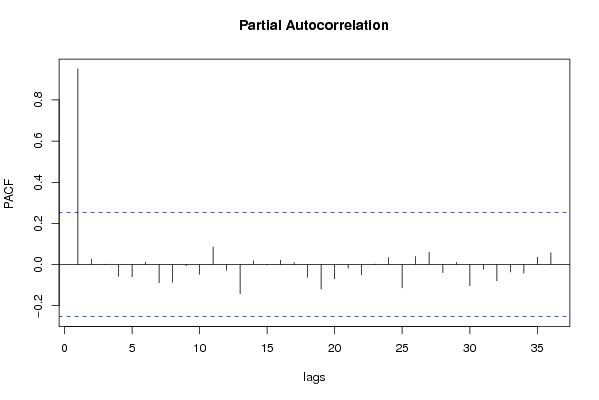
Partial Autocorrelation Function
Time lag kPACF(k)T-STATP-value
10.9506247.36350
20.0264140.20460.419287
30.0019270.01490.49407
4-0.05732-0.4440.32932
5-0.058571-0.45370.325845
60.0119190.09230.463373
7-0.087968-0.68140.24912
8-0.086407-0.66930.252933
9-0.005921-0.04590.481785
10-0.046536-0.36050.359881
110.0859030.66540.254171
12-0.027827-0.21550.415036
13-0.141184-1.09360.139249
140.0181680.14070.444276
15-0.001561-0.01210.495197
160.0212860.16490.434797
170.0097530.07550.470015
18-0.061429-0.47580.317962
19-0.118877-0.92080.180417
20-0.068386-0.52970.299133
21-0.017337-0.13430.44681
22-0.049986-0.38720.349993
230.0023670.01830.492716
240.0339870.26330.396626
25-0.11297-0.87510.192515
260.039080.30270.381579
270.0605640.46910.32034
28-0.038851-0.30090.382251
290.0101330.07850.46885
30-0.102574-0.79450.215008
31-0.023178-0.17950.42906
32-0.078957-0.61160.271556
33-0.03576-0.2770.391369
34-0.041095-0.31830.375673
350.0355610.27550.391956
360.0574590.44510.328933

\begin{tabular}{lllllllll}
\hline
Partial Autocorrelation Function \tabularnewline
Time lag k & PACF(k) & T-STAT & P-value \tabularnewline
1 & 0.950624 & 7.3635 & 0 \tabularnewline
2 & 0.026414 & 0.2046 & 0.419287 \tabularnewline
3 & 0.001927 & 0.0149 & 0.49407 \tabularnewline
4 & -0.05732 & -0.444 & 0.32932 \tabularnewline
5 & -0.058571 & -0.4537 & 0.325845 \tabularnewline
6 & 0.011919 & 0.0923 & 0.463373 \tabularnewline
7 & -0.087968 & -0.6814 & 0.24912 \tabularnewline
8 & -0.086407 & -0.6693 & 0.252933 \tabularnewline
9 & -0.005921 & -0.0459 & 0.481785 \tabularnewline
10 & -0.046536 & -0.3605 & 0.359881 \tabularnewline
11 & 0.085903 & 0.6654 & 0.254171 \tabularnewline
12 & -0.027827 & -0.2155 & 0.415036 \tabularnewline
13 & -0.141184 & -1.0936 & 0.139249 \tabularnewline
14 & 0.018168 & 0.1407 & 0.444276 \tabularnewline
15 & -0.001561 & -0.0121 & 0.495197 \tabularnewline
16 & 0.021286 & 0.1649 & 0.434797 \tabularnewline
17 & 0.009753 & 0.0755 & 0.470015 \tabularnewline
18 & -0.061429 & -0.4758 & 0.317962 \tabularnewline
19 & -0.118877 & -0.9208 & 0.180417 \tabularnewline
20 & -0.068386 & -0.5297 & 0.299133 \tabularnewline
21 & -0.017337 & -0.1343 & 0.44681 \tabularnewline
22 & -0.049986 & -0.3872 & 0.349993 \tabularnewline
23 & 0.002367 & 0.0183 & 0.492716 \tabularnewline
24 & 0.033987 & 0.2633 & 0.396626 \tabularnewline
25 & -0.11297 & -0.8751 & 0.192515 \tabularnewline
26 & 0.03908 & 0.3027 & 0.381579 \tabularnewline
27 & 0.060564 & 0.4691 & 0.32034 \tabularnewline
28 & -0.038851 & -0.3009 & 0.382251 \tabularnewline
29 & 0.010133 & 0.0785 & 0.46885 \tabularnewline
30 & -0.102574 & -0.7945 & 0.215008 \tabularnewline
31 & -0.023178 & -0.1795 & 0.42906 \tabularnewline
32 & -0.078957 & -0.6116 & 0.271556 \tabularnewline
33 & -0.03576 & -0.277 & 0.391369 \tabularnewline
34 & -0.041095 & -0.3183 & 0.375673 \tabularnewline
35 & 0.035561 & 0.2755 & 0.391956 \tabularnewline
36 & 0.057459 & 0.4451 & 0.328933 \tabularnewline
\hline
\end{tabular}
%Source: https://freestatistics.org/blog/index.php?pk=61018&T=2

[TABLE]
[ROW][C]Partial Autocorrelation Function[/C][/ROW]
[ROW][C]Time lag k[/C][C]PACF(k)[/C][C]T-STAT[/C][C]P-value[/C][/ROW]
[ROW][C]1[/C][C]0.950624[/C][C]7.3635[/C][C]0[/C][/ROW]
[ROW][C]2[/C][C]0.026414[/C][C]0.2046[/C][C]0.419287[/C][/ROW]
[ROW][C]3[/C][C]0.001927[/C][C]0.0149[/C][C]0.49407[/C][/ROW]
[ROW][C]4[/C][C]-0.05732[/C][C]-0.444[/C][C]0.32932[/C][/ROW]
[ROW][C]5[/C][C]-0.058571[/C][C]-0.4537[/C][C]0.325845[/C][/ROW]
[ROW][C]6[/C][C]0.011919[/C][C]0.0923[/C][C]0.463373[/C][/ROW]
[ROW][C]7[/C][C]-0.087968[/C][C]-0.6814[/C][C]0.24912[/C][/ROW]
[ROW][C]8[/C][C]-0.086407[/C][C]-0.6693[/C][C]0.252933[/C][/ROW]
[ROW][C]9[/C][C]-0.005921[/C][C]-0.0459[/C][C]0.481785[/C][/ROW]
[ROW][C]10[/C][C]-0.046536[/C][C]-0.3605[/C][C]0.359881[/C][/ROW]
[ROW][C]11[/C][C]0.085903[/C][C]0.6654[/C][C]0.254171[/C][/ROW]
[ROW][C]12[/C][C]-0.027827[/C][C]-0.2155[/C][C]0.415036[/C][/ROW]
[ROW][C]13[/C][C]-0.141184[/C][C]-1.0936[/C][C]0.139249[/C][/ROW]
[ROW][C]14[/C][C]0.018168[/C][C]0.1407[/C][C]0.444276[/C][/ROW]
[ROW][C]15[/C][C]-0.001561[/C][C]-0.0121[/C][C]0.495197[/C][/ROW]
[ROW][C]16[/C][C]0.021286[/C][C]0.1649[/C][C]0.434797[/C][/ROW]
[ROW][C]17[/C][C]0.009753[/C][C]0.0755[/C][C]0.470015[/C][/ROW]
[ROW][C]18[/C][C]-0.061429[/C][C]-0.4758[/C][C]0.317962[/C][/ROW]
[ROW][C]19[/C][C]-0.118877[/C][C]-0.9208[/C][C]0.180417[/C][/ROW]
[ROW][C]20[/C][C]-0.068386[/C][C]-0.5297[/C][C]0.299133[/C][/ROW]
[ROW][C]21[/C][C]-0.017337[/C][C]-0.1343[/C][C]0.44681[/C][/ROW]
[ROW][C]22[/C][C]-0.049986[/C][C]-0.3872[/C][C]0.349993[/C][/ROW]
[ROW][C]23[/C][C]0.002367[/C][C]0.0183[/C][C]0.492716[/C][/ROW]
[ROW][C]24[/C][C]0.033987[/C][C]0.2633[/C][C]0.396626[/C][/ROW]
[ROW][C]25[/C][C]-0.11297[/C][C]-0.8751[/C][C]0.192515[/C][/ROW]
[ROW][C]26[/C][C]0.03908[/C][C]0.3027[/C][C]0.381579[/C][/ROW]
[ROW][C]27[/C][C]0.060564[/C][C]0.4691[/C][C]0.32034[/C][/ROW]
[ROW][C]28[/C][C]-0.038851[/C][C]-0.3009[/C][C]0.382251[/C][/ROW]
[ROW][C]29[/C][C]0.010133[/C][C]0.0785[/C][C]0.46885[/C][/ROW]
[ROW][C]30[/C][C]-0.102574[/C][C]-0.7945[/C][C]0.215008[/C][/ROW]
[ROW][C]31[/C][C]-0.023178[/C][C]-0.1795[/C][C]0.42906[/C][/ROW]
[ROW][C]32[/C][C]-0.078957[/C][C]-0.6116[/C][C]0.271556[/C][/ROW]
[ROW][C]33[/C][C]-0.03576[/C][C]-0.277[/C][C]0.391369[/C][/ROW]
[ROW][C]34[/C][C]-0.041095[/C][C]-0.3183[/C][C]0.375673[/C][/ROW]
[ROW][C]35[/C][C]0.035561[/C][C]0.2755[/C][C]0.391956[/C][/ROW]
[ROW][C]36[/C][C]0.057459[/C][C]0.4451[/C][C]0.328933[/C][/ROW]
[/TABLE]
Source: https://freestatistics.org/blog/index.php?pk=61018&T=2

Globally Unique Identifier (entire table): ba.freestatistics.org/blog/index.php?pk=61018&T=2

As an alternative you can also use a QR Code:  

The GUIDs for individual cells are displayed in the table below:

Partial Autocorrelation Function
Time lag kPACF(k)T-STATP-value
10.9506247.36350
20.0264140.20460.419287
30.0019270.01490.49407
4-0.05732-0.4440.32932
5-0.058571-0.45370.325845
60.0119190.09230.463373
7-0.087968-0.68140.24912
8-0.086407-0.66930.252933
9-0.005921-0.04590.481785
10-0.046536-0.36050.359881
110.0859030.66540.254171
12-0.027827-0.21550.415036
13-0.141184-1.09360.139249
140.0181680.14070.444276
15-0.001561-0.01210.495197
160.0212860.16490.434797
170.0097530.07550.470015
18-0.061429-0.47580.317962
19-0.118877-0.92080.180417
20-0.068386-0.52970.299133
21-0.017337-0.13430.44681
22-0.049986-0.38720.349993
230.0023670.01830.492716
240.0339870.26330.396626
25-0.11297-0.87510.192515
260.039080.30270.381579
270.0605640.46910.32034
28-0.038851-0.30090.382251
290.0101330.07850.46885
30-0.102574-0.79450.215008
31-0.023178-0.17950.42906
32-0.078957-0.61160.271556
33-0.03576-0.2770.391369
34-0.041095-0.31830.375673
350.0355610.27550.391956
360.0574590.44510.328933


Parameters (Session):
par1 = 36 ; par2 = 1 ; par3 = 0 ; par4 = 0 ; par5 = 12 ; par6 = White Noise ; par7 = 0.95 ;
Parameters (R input):
par1 = 36 ; par2 = 1 ; par3 = 0 ; par4 = 0 ; par5 = 12 ; par6 = White Noise ; par7 = 0.95 ;
R code (references can be found in the software module):
if (par1 == 'Default') {
par1 = 10*log10(length(x))
} else {
par1 <- as.numeric(par1)
}
par2 <- as.numeric(par2)
par3 <- as.numeric(par3)
par4 <- as.numeric(par4)
par5 <- as.numeric(par5)
if (par6 == 'White Noise') par6 <- 'white' else par6 <- 'ma'
par7 <- as.numeric(par7)
if (par2 == 0) {
x <- log(x)
} else {
x <- (x ^ par2 - 1) / par2
}
if (par3 > 0) x <- diff(x,lag=1,difference=par3)
if (par4 > 0) x <- diff(x,lag=par5,difference=par4)
bitmap(file='pic1.png')
racf <- acf(x, par1, main='Autocorrelation', xlab='time lag', ylab='ACF', ci.type=par6, ci=par7, sub=paste('(lambda=',par2,', d=',par3,', D=',par4,', CI=', par7, ', CI type=',par6,')',sep=''))
dev.off()
bitmap(file='pic2.png')
rpacf <- pacf(x,par1,main='Partial Autocorrelation',xlab='lags',ylab='PACF')
dev.off()
(myacf <- c(racf$acf))
(mypacf <- c(rpacf$acf))
lengthx <- length(x)
sqrtn <- sqrt(lengthx)
load(file='createtable')
a<-table.start()
a<-table.row.start(a)
a<-table.element(a,'Autocorrelation Function',4,TRUE)
a<-table.row.end(a)
a<-table.row.start(a)
a<-table.element(a,'Time lag k',header=TRUE)
a<-table.element(a,hyperlink('basics.htm','ACF(k)','click here for more information about the Autocorrelation Function'),header=TRUE)
a<-table.element(a,'T-STAT',header=TRUE)
a<-table.element(a,'P-value',header=TRUE)
a<-table.row.end(a)
for (i in 2:(par1+1)) {
a<-table.row.start(a)
a<-table.element(a,i-1,header=TRUE)
a<-table.element(a,round(myacf[i],6))
mytstat <- myacf[i]*sqrtn
a<-table.element(a,round(mytstat,4))
a<-table.element(a,round(1-pt(abs(mytstat),lengthx),6))
a<-table.row.end(a)
}
a<-table.end(a)
table.save(a,file='mytable.tab')
a<-table.start()
a<-table.row.start(a)
a<-table.element(a,'Partial Autocorrelation Function',4,TRUE)
a<-table.row.end(a)
a<-table.row.start(a)
a<-table.element(a,'Time lag k',header=TRUE)
a<-table.element(a,hyperlink('basics.htm','PACF(k)','click here for more information about the Partial Autocorrelation Function'),header=TRUE)
a<-table.element(a,'T-STAT',header=TRUE)
a<-table.element(a,'P-value',header=TRUE)
a<-table.row.end(a)
for (i in 1:par1) {
a<-table.row.start(a)
a<-table.element(a,i,header=TRUE)
a<-table.element(a,round(mypacf[i],6))
mytstat <- mypacf[i]*sqrtn
a<-table.element(a,round(mytstat,4))
a<-table.element(a,round(1-pt(abs(mytstat),lengthx),6))
a<-table.row.end(a)
}
a<-table.end(a)
table.save(a,file='mytable1.tab')