Free Statistics

of Irreproducible Research!

Author's title

Author*The author of this computation has been verified*
R Software Modulerwasp_multipleregression.wasp
Title produced by softwareMultiple Regression
Date of computationFri, 27 Nov 2009 10:54:51 -0700
Cite this page as followsStatistical Computations at FreeStatistics.org, Office for Research Development and Education, URL https://freestatistics.org/blog/index.php?v=date/2009/Nov/27/t1259344557urcesnvnconrb8w.htm/, Retrieved Mon, 29 Apr 2024 00:05:40 +0000
Statistical Computations at FreeStatistics.org, Office for Research Development and Education, URL https://freestatistics.org/blog/index.php?pk=61064, Retrieved Mon, 29 Apr 2024 00:05:40 +0000
QR Codes:

Original text written by user:
IsPrivate?No (this computation is public)
User-defined keywords
Estimated Impact135
Family? (F = Feedback message, R = changed R code, M = changed R Module, P = changed Parameters, D = changed Data)
-     [Multiple Regression] [Q1 The Seatbeltlaw] [2007-11-14 19:27:43] [8cd6641b921d30ebe00b648d1481bba0]
- RMPD  [Multiple Regression] [Seatbelt] [2009-11-12 13:54:52] [b98453cac15ba1066b407e146608df68]
-    D    [Multiple Regression] [workshop 7] [2009-11-20 08:30:37] [f1a50df816abcbb519e7637ff6b72fa0]
-   PD      [Multiple Regression] [cs.shw.ws7.v2] [2009-11-26 16:07:10] [f03ef5b3db050a0e1a9e496be7848771]
-    D          [Multiple Regression] [ws 7 multiple reg...] [2009-11-27 17:54:51] [a315839f8c359622c3a1e6ed387dd5cd] [Current]
Feedback Forum

Post a new message
Dataseries X:
8.9	1.9
9	1.6
9	1.7
9	2
9	2.5
9	2.4
9	2.3
9	2.3
9	2.1
9	2.4
9	2.2
9.1	2.4
9	1.9
9	2.1
9.1	2.1
9	2.1
9	2
9	2.1
9	2.2
8.9	2.2
8.9	2.6
8.9	2.5
8.9	2.3
8.8	2.2
8.8	2.4
8.7	2.3
8.7	2.2
8.5	2.5
8.5	2.5
8.4	2.5
8.2	2.4
8.2	2.3
8.1	1.7
8.1	1.6
8	1.9
7.9	1.9
7.8	1.8
7.7	1.8
7.6	1.9
7.5	1.9
7.5	1.9
7.5	1.9
7.5	1.8
7.5	1.7
7.4	2.1
7.4	2.6
7.3	3.1
7.3	3.1
7.3	3.2
7.2	3.3
7.2	3.6
7.3	3.3
7.4	3.7
7.4	4
7.5	4
7.6	3.8
7.7	3.6
7.9	3.2
8	2.1
8.2	1.6


Summary of computational transaction
Raw Inputview raw input (R code)
Raw Outputview raw output of R engine
Computing time4 seconds
R Server'Gwilym Jenkins' @ 72.249.127.135

\begin{tabular}{lllllllll}
\hline
Summary of computational transaction \tabularnewline
Raw Input & view raw input (R code)  \tabularnewline
Raw Output & view raw output of R engine  \tabularnewline
Computing time & 4 seconds \tabularnewline
R Server & 'Gwilym Jenkins' @ 72.249.127.135 \tabularnewline
\hline
\end{tabular}
%Source: https://freestatistics.org/blog/index.php?pk=61064&T=0

[TABLE]
[ROW][C]Summary of computational transaction[/C][/ROW]
[ROW][C]Raw Input[/C][C]view raw input (R code) [/C][/ROW]
[ROW][C]Raw Output[/C][C]view raw output of R engine [/C][/ROW]
[ROW][C]Computing time[/C][C]4 seconds[/C][/ROW]
[ROW][C]R Server[/C][C]'Gwilym Jenkins' @ 72.249.127.135[/C][/ROW]
[/TABLE]
Source: https://freestatistics.org/blog/index.php?pk=61064&T=0

Globally Unique Identifier (entire table): ba.freestatistics.org/blog/index.php?pk=61064&T=0

As an alternative you can also use a QR Code:  

The GUIDs for individual cells are displayed in the table below:

Summary of computational transaction
Raw Inputview raw input (R code)
Raw Outputview raw output of R engine
Computing time4 seconds
R Server'Gwilym Jenkins' @ 72.249.127.135


Multiple Linear Regression - Estimated Regression Equation
werkl[t] = + 9.34448245145198 -0.484143951541065infl[t] + 0.0999999999999908M1[t] + 0.0503171209691788M2[t] + 0.0890486370924635M3[t] + 0.0580972741849276M4[t] + 0.155560306431498M5[t] + 0.164608943523962M6[t] + 0.125243185462319M7[t] + 0.0865116693390339M8[t] + 0.0471459112773918M9[t] + 0.106511669339034M10[t] + 0.0187315161232850M11[t] + e[t]

\begin{tabular}{lllllllll}
\hline
Multiple Linear Regression - Estimated Regression Equation \tabularnewline
werkl[t] =  +  9.34448245145198 -0.484143951541065infl[t] +  0.0999999999999908M1[t] +  0.0503171209691788M2[t] +  0.0890486370924635M3[t] +  0.0580972741849276M4[t] +  0.155560306431498M5[t] +  0.164608943523962M6[t] +  0.125243185462319M7[t] +  0.0865116693390339M8[t] +  0.0471459112773918M9[t] +  0.106511669339034M10[t] +  0.0187315161232850M11[t]  + e[t] \tabularnewline
\hline
\end{tabular}
%Source: https://freestatistics.org/blog/index.php?pk=61064&T=1

[TABLE]
[ROW][C]Multiple Linear Regression - Estimated Regression Equation[/C][/ROW]
[ROW][C]werkl[t] =  +  9.34448245145198 -0.484143951541065infl[t] +  0.0999999999999908M1[t] +  0.0503171209691788M2[t] +  0.0890486370924635M3[t] +  0.0580972741849276M4[t] +  0.155560306431498M5[t] +  0.164608943523962M6[t] +  0.125243185462319M7[t] +  0.0865116693390339M8[t] +  0.0471459112773918M9[t] +  0.106511669339034M10[t] +  0.0187315161232850M11[t]  + e[t][/C][/ROW]
[/TABLE]
Source: https://freestatistics.org/blog/index.php?pk=61064&T=1

Globally Unique Identifier (entire table): ba.freestatistics.org/blog/index.php?pk=61064&T=1

As an alternative you can also use a QR Code:  

The GUIDs for individual cells are displayed in the table below:

Multiple Linear Regression - Estimated Regression Equation
werkl[t] = + 9.34448245145198 -0.484143951541065infl[t] + 0.0999999999999908M1[t] + 0.0503171209691788M2[t] + 0.0890486370924635M3[t] + 0.0580972741849276M4[t] + 0.155560306431498M5[t] + 0.164608943523962M6[t] + 0.125243185462319M7[t] + 0.0865116693390339M8[t] + 0.0471459112773918M9[t] + 0.106511669339034M10[t] + 0.0187315161232850M11[t] + e[t]


Multiple Linear Regression - Ordinary Least Squares
VariableParameterS.D.T-STATH0: parameter = 02-tail p-value1-tail p-value
(Intercept)9.344482451451980.45010920.760500
infl-0.4841439515410650.145973-3.31670.0017630.000881
M10.09999999999999080.4374530.22860.8201740.410087
M20.05031712096917880.4374620.1150.9089190.454459
M30.08904863709246350.437540.20350.8396060.419803
M40.05809727418492760.4378030.13270.8949960.447498
M50.1555603064314980.4393580.35410.7248750.362438
M60.1646089435239620.4402590.37390.7101670.355083
M70.1252431854623190.4396390.28490.776990.388495
M80.08651166933903390.438630.19720.8444970.422248
M90.04714591127739180.4382410.10760.9147870.457393
M100.1065116693390340.438630.24280.8091950.404598
M110.01873151612328500.4376080.04280.9660390.483019

\begin{tabular}{lllllllll}
\hline
Multiple Linear Regression - Ordinary Least Squares \tabularnewline
Variable & Parameter & S.D. & T-STATH0: parameter = 0 & 2-tail p-value & 1-tail p-value \tabularnewline
(Intercept) & 9.34448245145198 & 0.450109 & 20.7605 & 0 & 0 \tabularnewline
infl & -0.484143951541065 & 0.145973 & -3.3167 & 0.001763 & 0.000881 \tabularnewline
M1 & 0.0999999999999908 & 0.437453 & 0.2286 & 0.820174 & 0.410087 \tabularnewline
M2 & 0.0503171209691788 & 0.437462 & 0.115 & 0.908919 & 0.454459 \tabularnewline
M3 & 0.0890486370924635 & 0.43754 & 0.2035 & 0.839606 & 0.419803 \tabularnewline
M4 & 0.0580972741849276 & 0.437803 & 0.1327 & 0.894996 & 0.447498 \tabularnewline
M5 & 0.155560306431498 & 0.439358 & 0.3541 & 0.724875 & 0.362438 \tabularnewline
M6 & 0.164608943523962 & 0.440259 & 0.3739 & 0.710167 & 0.355083 \tabularnewline
M7 & 0.125243185462319 & 0.439639 & 0.2849 & 0.77699 & 0.388495 \tabularnewline
M8 & 0.0865116693390339 & 0.43863 & 0.1972 & 0.844497 & 0.422248 \tabularnewline
M9 & 0.0471459112773918 & 0.438241 & 0.1076 & 0.914787 & 0.457393 \tabularnewline
M10 & 0.106511669339034 & 0.43863 & 0.2428 & 0.809195 & 0.404598 \tabularnewline
M11 & 0.0187315161232850 & 0.437608 & 0.0428 & 0.966039 & 0.483019 \tabularnewline
\hline
\end{tabular}
%Source: https://freestatistics.org/blog/index.php?pk=61064&T=2

[TABLE]
[ROW][C]Multiple Linear Regression - Ordinary Least Squares[/C][/ROW]
[ROW][C]Variable[/C][C]Parameter[/C][C]S.D.[/C][C]T-STATH0: parameter = 0[/C][C]2-tail p-value[/C][C]1-tail p-value[/C][/ROW]
[ROW][C](Intercept)[/C][C]9.34448245145198[/C][C]0.450109[/C][C]20.7605[/C][C]0[/C][C]0[/C][/ROW]
[ROW][C]infl[/C][C]-0.484143951541065[/C][C]0.145973[/C][C]-3.3167[/C][C]0.001763[/C][C]0.000881[/C][/ROW]
[ROW][C]M1[/C][C]0.0999999999999908[/C][C]0.437453[/C][C]0.2286[/C][C]0.820174[/C][C]0.410087[/C][/ROW]
[ROW][C]M2[/C][C]0.0503171209691788[/C][C]0.437462[/C][C]0.115[/C][C]0.908919[/C][C]0.454459[/C][/ROW]
[ROW][C]M3[/C][C]0.0890486370924635[/C][C]0.43754[/C][C]0.2035[/C][C]0.839606[/C][C]0.419803[/C][/ROW]
[ROW][C]M4[/C][C]0.0580972741849276[/C][C]0.437803[/C][C]0.1327[/C][C]0.894996[/C][C]0.447498[/C][/ROW]
[ROW][C]M5[/C][C]0.155560306431498[/C][C]0.439358[/C][C]0.3541[/C][C]0.724875[/C][C]0.362438[/C][/ROW]
[ROW][C]M6[/C][C]0.164608943523962[/C][C]0.440259[/C][C]0.3739[/C][C]0.710167[/C][C]0.355083[/C][/ROW]
[ROW][C]M7[/C][C]0.125243185462319[/C][C]0.439639[/C][C]0.2849[/C][C]0.77699[/C][C]0.388495[/C][/ROW]
[ROW][C]M8[/C][C]0.0865116693390339[/C][C]0.43863[/C][C]0.1972[/C][C]0.844497[/C][C]0.422248[/C][/ROW]
[ROW][C]M9[/C][C]0.0471459112773918[/C][C]0.438241[/C][C]0.1076[/C][C]0.914787[/C][C]0.457393[/C][/ROW]
[ROW][C]M10[/C][C]0.106511669339034[/C][C]0.43863[/C][C]0.2428[/C][C]0.809195[/C][C]0.404598[/C][/ROW]
[ROW][C]M11[/C][C]0.0187315161232850[/C][C]0.437608[/C][C]0.0428[/C][C]0.966039[/C][C]0.483019[/C][/ROW]
[/TABLE]
Source: https://freestatistics.org/blog/index.php?pk=61064&T=2

Globally Unique Identifier (entire table): ba.freestatistics.org/blog/index.php?pk=61064&T=2

As an alternative you can also use a QR Code:  

The GUIDs for individual cells are displayed in the table below:

Multiple Linear Regression - Ordinary Least Squares
VariableParameterS.D.T-STATH0: parameter = 02-tail p-value1-tail p-value
(Intercept)9.344482451451980.45010920.760500
infl-0.4841439515410650.145973-3.31670.0017630.000881
M10.09999999999999080.4374530.22860.8201740.410087
M20.05031712096917880.4374620.1150.9089190.454459
M30.08904863709246350.437540.20350.8396060.419803
M40.05809727418492760.4378030.13270.8949960.447498
M50.1555603064314980.4393580.35410.7248750.362438
M60.1646089435239620.4402590.37390.7101670.355083
M70.1252431854623190.4396390.28490.776990.388495
M80.08651166933903390.438630.19720.8444970.422248
M90.04714591127739180.4382410.10760.9147870.457393
M100.1065116693390340.438630.24280.8091950.404598
M110.01873151612328500.4376080.04280.9660390.483019


Multiple Linear Regression - Regression Statistics
Multiple R0.438622344152539
R-squared0.192389560789868
Adjusted R-squared-0.0138088492212289
F-TEST (value)0.933031252663462
F-TEST (DF numerator)12
F-TEST (DF denominator)47
p-value0.523093765381267
Multiple Linear Regression - Residual Statistics
Residual Standard Deviation0.691673198671604
Sum Squared Residuals22.4853552467486

\begin{tabular}{lllllllll}
\hline
Multiple Linear Regression - Regression Statistics \tabularnewline
Multiple R & 0.438622344152539 \tabularnewline
R-squared & 0.192389560789868 \tabularnewline
Adjusted R-squared & -0.0138088492212289 \tabularnewline
F-TEST (value) & 0.933031252663462 \tabularnewline
F-TEST (DF numerator) & 12 \tabularnewline
F-TEST (DF denominator) & 47 \tabularnewline
p-value & 0.523093765381267 \tabularnewline
Multiple Linear Regression - Residual Statistics \tabularnewline
Residual Standard Deviation & 0.691673198671604 \tabularnewline
Sum Squared Residuals & 22.4853552467486 \tabularnewline
\hline
\end{tabular}
%Source: https://freestatistics.org/blog/index.php?pk=61064&T=3

[TABLE]
[ROW][C]Multiple Linear Regression - Regression Statistics[/C][/ROW]
[ROW][C]Multiple R[/C][C]0.438622344152539[/C][/ROW]
[ROW][C]R-squared[/C][C]0.192389560789868[/C][/ROW]
[ROW][C]Adjusted R-squared[/C][C]-0.0138088492212289[/C][/ROW]
[ROW][C]F-TEST (value)[/C][C]0.933031252663462[/C][/ROW]
[ROW][C]F-TEST (DF numerator)[/C][C]12[/C][/ROW]
[ROW][C]F-TEST (DF denominator)[/C][C]47[/C][/ROW]
[ROW][C]p-value[/C][C]0.523093765381267[/C][/ROW]
[ROW][C]Multiple Linear Regression - Residual Statistics[/C][/ROW]
[ROW][C]Residual Standard Deviation[/C][C]0.691673198671604[/C][/ROW]
[ROW][C]Sum Squared Residuals[/C][C]22.4853552467486[/C][/ROW]
[/TABLE]
Source: https://freestatistics.org/blog/index.php?pk=61064&T=3

Globally Unique Identifier (entire table): ba.freestatistics.org/blog/index.php?pk=61064&T=3

As an alternative you can also use a QR Code:  

The GUIDs for individual cells are displayed in the table below:

Multiple Linear Regression - Regression Statistics
Multiple R0.438622344152539
R-squared0.192389560789868
Adjusted R-squared-0.0138088492212289
F-TEST (value)0.933031252663462
F-TEST (DF numerator)12
F-TEST (DF denominator)47
p-value0.523093765381267
Multiple Linear Regression - Residual Statistics
Residual Standard Deviation0.691673198671604
Sum Squared Residuals22.4853552467486


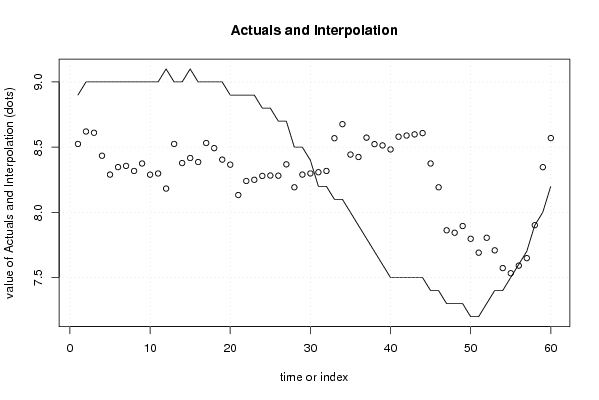
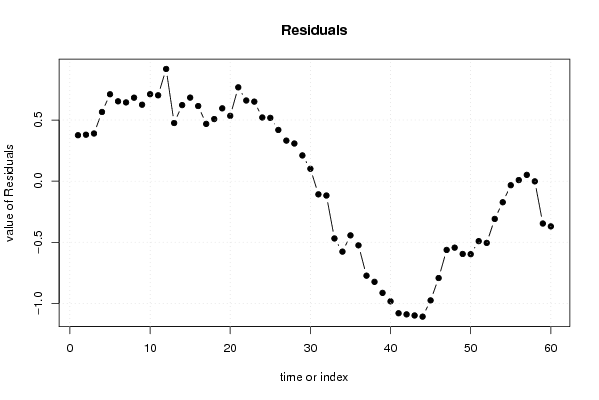
Multiple Linear Regression - Actuals, Interpolation, and Residuals
Time or IndexActualsInterpolationForecastResidualsPrediction Error
18.98.5246089435240.375391056476
298.620169249955460.379830750044541
398.610486370924640.389513629075362
498.434291822554780.565708177445217
598.289682879030820.710317120969179
698.34714591127740.652854088722608
798.356194548369860.643805451630144
898.317463032246570.682536967753429
998.374926064493140.625073935506859
1098.289048637092460.710951362907536
1198.298097274184930.701902725815072
129.18.182536967753430.91746303224657
1398.524608943523950.475391056476048
1498.378097274184930.621902725815072
159.18.416828790308210.683171209691787
1698.385877427400680.614122572599323
1798.531754854801350.468245145198646
1898.492389096739710.507610903260289
1998.404608943523960.595391056476038
208.98.365877427400680.534122572599324
218.98.132854088722610.767145911277392
228.98.240634241938360.659365758061643
238.98.249682879030820.650317120969179
248.88.279365758061640.520634241938358
258.88.282536967753420.51746303224658
268.78.281268483876720.418731516123284
278.78.36841439515410.331585604845893
288.58.192219846784250.307780153215749
298.58.289682879030820.210317120969178
308.48.298731516123280.101268483876715
318.28.30778015321575-0.10778015321575
328.28.31746303224657-0.117463032246571
338.18.56858364510957-0.468583645109567
348.18.67636379832532-0.576363798325316
3588.44334045964725-0.443340459647247
367.98.42460894352396-0.524608943523962
377.88.57302333867806-0.77302333867806
387.78.52334045964725-0.823340459647247
397.68.51365758061642-0.913657580616426
407.58.48270621770889-0.98270621770889
417.58.58016924995546-1.08016924995546
427.58.58921788704792-1.08921788704792
437.58.59826652414039-1.09826652414039
447.58.6079494031712-1.10794940317121
457.48.37492606449314-0.97492606449314
467.48.19221984678425-0.79221984678425
477.37.86236771779797-0.56236771779797
487.37.84363620167469-0.543636201674685
497.37.89522180652057-0.595221806520569
507.27.79712453233565-0.59712453233565
517.27.69061286299662-0.490612862996616
527.37.8049046855514-0.504904685551399
537.47.70871013718154-0.308710137181544
547.47.57251558881169-0.172515588811688
557.57.53314983075005-0.0331498307500458
567.67.591247104934970.0087528950650263
577.77.648710137181540.0512898628184562
587.97.90173347585961-0.00173347585961171
5988.34651166933903-0.346511669339034
608.28.56985212898628-0.369852128986282

\begin{tabular}{lllllllll}
\hline
Multiple Linear Regression - Actuals, Interpolation, and Residuals \tabularnewline
Time or Index & Actuals & InterpolationForecast & ResidualsPrediction Error \tabularnewline
1 & 8.9 & 8.524608943524 & 0.375391056476 \tabularnewline
2 & 9 & 8.62016924995546 & 0.379830750044541 \tabularnewline
3 & 9 & 8.61048637092464 & 0.389513629075362 \tabularnewline
4 & 9 & 8.43429182255478 & 0.565708177445217 \tabularnewline
5 & 9 & 8.28968287903082 & 0.710317120969179 \tabularnewline
6 & 9 & 8.3471459112774 & 0.652854088722608 \tabularnewline
7 & 9 & 8.35619454836986 & 0.643805451630144 \tabularnewline
8 & 9 & 8.31746303224657 & 0.682536967753429 \tabularnewline
9 & 9 & 8.37492606449314 & 0.625073935506859 \tabularnewline
10 & 9 & 8.28904863709246 & 0.710951362907536 \tabularnewline
11 & 9 & 8.29809727418493 & 0.701902725815072 \tabularnewline
12 & 9.1 & 8.18253696775343 & 0.91746303224657 \tabularnewline
13 & 9 & 8.52460894352395 & 0.475391056476048 \tabularnewline
14 & 9 & 8.37809727418493 & 0.621902725815072 \tabularnewline
15 & 9.1 & 8.41682879030821 & 0.683171209691787 \tabularnewline
16 & 9 & 8.38587742740068 & 0.614122572599323 \tabularnewline
17 & 9 & 8.53175485480135 & 0.468245145198646 \tabularnewline
18 & 9 & 8.49238909673971 & 0.507610903260289 \tabularnewline
19 & 9 & 8.40460894352396 & 0.595391056476038 \tabularnewline
20 & 8.9 & 8.36587742740068 & 0.534122572599324 \tabularnewline
21 & 8.9 & 8.13285408872261 & 0.767145911277392 \tabularnewline
22 & 8.9 & 8.24063424193836 & 0.659365758061643 \tabularnewline
23 & 8.9 & 8.24968287903082 & 0.650317120969179 \tabularnewline
24 & 8.8 & 8.27936575806164 & 0.520634241938358 \tabularnewline
25 & 8.8 & 8.28253696775342 & 0.51746303224658 \tabularnewline
26 & 8.7 & 8.28126848387672 & 0.418731516123284 \tabularnewline
27 & 8.7 & 8.3684143951541 & 0.331585604845893 \tabularnewline
28 & 8.5 & 8.19221984678425 & 0.307780153215749 \tabularnewline
29 & 8.5 & 8.28968287903082 & 0.210317120969178 \tabularnewline
30 & 8.4 & 8.29873151612328 & 0.101268483876715 \tabularnewline
31 & 8.2 & 8.30778015321575 & -0.10778015321575 \tabularnewline
32 & 8.2 & 8.31746303224657 & -0.117463032246571 \tabularnewline
33 & 8.1 & 8.56858364510957 & -0.468583645109567 \tabularnewline
34 & 8.1 & 8.67636379832532 & -0.576363798325316 \tabularnewline
35 & 8 & 8.44334045964725 & -0.443340459647247 \tabularnewline
36 & 7.9 & 8.42460894352396 & -0.524608943523962 \tabularnewline
37 & 7.8 & 8.57302333867806 & -0.77302333867806 \tabularnewline
38 & 7.7 & 8.52334045964725 & -0.823340459647247 \tabularnewline
39 & 7.6 & 8.51365758061642 & -0.913657580616426 \tabularnewline
40 & 7.5 & 8.48270621770889 & -0.98270621770889 \tabularnewline
41 & 7.5 & 8.58016924995546 & -1.08016924995546 \tabularnewline
42 & 7.5 & 8.58921788704792 & -1.08921788704792 \tabularnewline
43 & 7.5 & 8.59826652414039 & -1.09826652414039 \tabularnewline
44 & 7.5 & 8.6079494031712 & -1.10794940317121 \tabularnewline
45 & 7.4 & 8.37492606449314 & -0.97492606449314 \tabularnewline
46 & 7.4 & 8.19221984678425 & -0.79221984678425 \tabularnewline
47 & 7.3 & 7.86236771779797 & -0.56236771779797 \tabularnewline
48 & 7.3 & 7.84363620167469 & -0.543636201674685 \tabularnewline
49 & 7.3 & 7.89522180652057 & -0.595221806520569 \tabularnewline
50 & 7.2 & 7.79712453233565 & -0.59712453233565 \tabularnewline
51 & 7.2 & 7.69061286299662 & -0.490612862996616 \tabularnewline
52 & 7.3 & 7.8049046855514 & -0.504904685551399 \tabularnewline
53 & 7.4 & 7.70871013718154 & -0.308710137181544 \tabularnewline
54 & 7.4 & 7.57251558881169 & -0.172515588811688 \tabularnewline
55 & 7.5 & 7.53314983075005 & -0.0331498307500458 \tabularnewline
56 & 7.6 & 7.59124710493497 & 0.0087528950650263 \tabularnewline
57 & 7.7 & 7.64871013718154 & 0.0512898628184562 \tabularnewline
58 & 7.9 & 7.90173347585961 & -0.00173347585961171 \tabularnewline
59 & 8 & 8.34651166933903 & -0.346511669339034 \tabularnewline
60 & 8.2 & 8.56985212898628 & -0.369852128986282 \tabularnewline
\hline
\end{tabular}
%Source: https://freestatistics.org/blog/index.php?pk=61064&T=4

[TABLE]
[ROW][C]Multiple Linear Regression - Actuals, Interpolation, and Residuals[/C][/ROW]
[ROW][C]Time or Index[/C][C]Actuals[/C][C]InterpolationForecast[/C][C]ResidualsPrediction Error[/C][/ROW]
[ROW][C]1[/C][C]8.9[/C][C]8.524608943524[/C][C]0.375391056476[/C][/ROW]
[ROW][C]2[/C][C]9[/C][C]8.62016924995546[/C][C]0.379830750044541[/C][/ROW]
[ROW][C]3[/C][C]9[/C][C]8.61048637092464[/C][C]0.389513629075362[/C][/ROW]
[ROW][C]4[/C][C]9[/C][C]8.43429182255478[/C][C]0.565708177445217[/C][/ROW]
[ROW][C]5[/C][C]9[/C][C]8.28968287903082[/C][C]0.710317120969179[/C][/ROW]
[ROW][C]6[/C][C]9[/C][C]8.3471459112774[/C][C]0.652854088722608[/C][/ROW]
[ROW][C]7[/C][C]9[/C][C]8.35619454836986[/C][C]0.643805451630144[/C][/ROW]
[ROW][C]8[/C][C]9[/C][C]8.31746303224657[/C][C]0.682536967753429[/C][/ROW]
[ROW][C]9[/C][C]9[/C][C]8.37492606449314[/C][C]0.625073935506859[/C][/ROW]
[ROW][C]10[/C][C]9[/C][C]8.28904863709246[/C][C]0.710951362907536[/C][/ROW]
[ROW][C]11[/C][C]9[/C][C]8.29809727418493[/C][C]0.701902725815072[/C][/ROW]
[ROW][C]12[/C][C]9.1[/C][C]8.18253696775343[/C][C]0.91746303224657[/C][/ROW]
[ROW][C]13[/C][C]9[/C][C]8.52460894352395[/C][C]0.475391056476048[/C][/ROW]
[ROW][C]14[/C][C]9[/C][C]8.37809727418493[/C][C]0.621902725815072[/C][/ROW]
[ROW][C]15[/C][C]9.1[/C][C]8.41682879030821[/C][C]0.683171209691787[/C][/ROW]
[ROW][C]16[/C][C]9[/C][C]8.38587742740068[/C][C]0.614122572599323[/C][/ROW]
[ROW][C]17[/C][C]9[/C][C]8.53175485480135[/C][C]0.468245145198646[/C][/ROW]
[ROW][C]18[/C][C]9[/C][C]8.49238909673971[/C][C]0.507610903260289[/C][/ROW]
[ROW][C]19[/C][C]9[/C][C]8.40460894352396[/C][C]0.595391056476038[/C][/ROW]
[ROW][C]20[/C][C]8.9[/C][C]8.36587742740068[/C][C]0.534122572599324[/C][/ROW]
[ROW][C]21[/C][C]8.9[/C][C]8.13285408872261[/C][C]0.767145911277392[/C][/ROW]
[ROW][C]22[/C][C]8.9[/C][C]8.24063424193836[/C][C]0.659365758061643[/C][/ROW]
[ROW][C]23[/C][C]8.9[/C][C]8.24968287903082[/C][C]0.650317120969179[/C][/ROW]
[ROW][C]24[/C][C]8.8[/C][C]8.27936575806164[/C][C]0.520634241938358[/C][/ROW]
[ROW][C]25[/C][C]8.8[/C][C]8.28253696775342[/C][C]0.51746303224658[/C][/ROW]
[ROW][C]26[/C][C]8.7[/C][C]8.28126848387672[/C][C]0.418731516123284[/C][/ROW]
[ROW][C]27[/C][C]8.7[/C][C]8.3684143951541[/C][C]0.331585604845893[/C][/ROW]
[ROW][C]28[/C][C]8.5[/C][C]8.19221984678425[/C][C]0.307780153215749[/C][/ROW]
[ROW][C]29[/C][C]8.5[/C][C]8.28968287903082[/C][C]0.210317120969178[/C][/ROW]
[ROW][C]30[/C][C]8.4[/C][C]8.29873151612328[/C][C]0.101268483876715[/C][/ROW]
[ROW][C]31[/C][C]8.2[/C][C]8.30778015321575[/C][C]-0.10778015321575[/C][/ROW]
[ROW][C]32[/C][C]8.2[/C][C]8.31746303224657[/C][C]-0.117463032246571[/C][/ROW]
[ROW][C]33[/C][C]8.1[/C][C]8.56858364510957[/C][C]-0.468583645109567[/C][/ROW]
[ROW][C]34[/C][C]8.1[/C][C]8.67636379832532[/C][C]-0.576363798325316[/C][/ROW]
[ROW][C]35[/C][C]8[/C][C]8.44334045964725[/C][C]-0.443340459647247[/C][/ROW]
[ROW][C]36[/C][C]7.9[/C][C]8.42460894352396[/C][C]-0.524608943523962[/C][/ROW]
[ROW][C]37[/C][C]7.8[/C][C]8.57302333867806[/C][C]-0.77302333867806[/C][/ROW]
[ROW][C]38[/C][C]7.7[/C][C]8.52334045964725[/C][C]-0.823340459647247[/C][/ROW]
[ROW][C]39[/C][C]7.6[/C][C]8.51365758061642[/C][C]-0.913657580616426[/C][/ROW]
[ROW][C]40[/C][C]7.5[/C][C]8.48270621770889[/C][C]-0.98270621770889[/C][/ROW]
[ROW][C]41[/C][C]7.5[/C][C]8.58016924995546[/C][C]-1.08016924995546[/C][/ROW]
[ROW][C]42[/C][C]7.5[/C][C]8.58921788704792[/C][C]-1.08921788704792[/C][/ROW]
[ROW][C]43[/C][C]7.5[/C][C]8.59826652414039[/C][C]-1.09826652414039[/C][/ROW]
[ROW][C]44[/C][C]7.5[/C][C]8.6079494031712[/C][C]-1.10794940317121[/C][/ROW]
[ROW][C]45[/C][C]7.4[/C][C]8.37492606449314[/C][C]-0.97492606449314[/C][/ROW]
[ROW][C]46[/C][C]7.4[/C][C]8.19221984678425[/C][C]-0.79221984678425[/C][/ROW]
[ROW][C]47[/C][C]7.3[/C][C]7.86236771779797[/C][C]-0.56236771779797[/C][/ROW]
[ROW][C]48[/C][C]7.3[/C][C]7.84363620167469[/C][C]-0.543636201674685[/C][/ROW]
[ROW][C]49[/C][C]7.3[/C][C]7.89522180652057[/C][C]-0.595221806520569[/C][/ROW]
[ROW][C]50[/C][C]7.2[/C][C]7.79712453233565[/C][C]-0.59712453233565[/C][/ROW]
[ROW][C]51[/C][C]7.2[/C][C]7.69061286299662[/C][C]-0.490612862996616[/C][/ROW]
[ROW][C]52[/C][C]7.3[/C][C]7.8049046855514[/C][C]-0.504904685551399[/C][/ROW]
[ROW][C]53[/C][C]7.4[/C][C]7.70871013718154[/C][C]-0.308710137181544[/C][/ROW]
[ROW][C]54[/C][C]7.4[/C][C]7.57251558881169[/C][C]-0.172515588811688[/C][/ROW]
[ROW][C]55[/C][C]7.5[/C][C]7.53314983075005[/C][C]-0.0331498307500458[/C][/ROW]
[ROW][C]56[/C][C]7.6[/C][C]7.59124710493497[/C][C]0.0087528950650263[/C][/ROW]
[ROW][C]57[/C][C]7.7[/C][C]7.64871013718154[/C][C]0.0512898628184562[/C][/ROW]
[ROW][C]58[/C][C]7.9[/C][C]7.90173347585961[/C][C]-0.00173347585961171[/C][/ROW]
[ROW][C]59[/C][C]8[/C][C]8.34651166933903[/C][C]-0.346511669339034[/C][/ROW]
[ROW][C]60[/C][C]8.2[/C][C]8.56985212898628[/C][C]-0.369852128986282[/C][/ROW]
[/TABLE]
Source: https://freestatistics.org/blog/index.php?pk=61064&T=4

Globally Unique Identifier (entire table): ba.freestatistics.org/blog/index.php?pk=61064&T=4

As an alternative you can also use a QR Code:  

The GUIDs for individual cells are displayed in the table below:

Multiple Linear Regression - Actuals, Interpolation, and Residuals
Time or IndexActualsInterpolationForecastResidualsPrediction Error
18.98.5246089435240.375391056476
298.620169249955460.379830750044541
398.610486370924640.389513629075362
498.434291822554780.565708177445217
598.289682879030820.710317120969179
698.34714591127740.652854088722608
798.356194548369860.643805451630144
898.317463032246570.682536967753429
998.374926064493140.625073935506859
1098.289048637092460.710951362907536
1198.298097274184930.701902725815072
129.18.182536967753430.91746303224657
1398.524608943523950.475391056476048
1498.378097274184930.621902725815072
159.18.416828790308210.683171209691787
1698.385877427400680.614122572599323
1798.531754854801350.468245145198646
1898.492389096739710.507610903260289
1998.404608943523960.595391056476038
208.98.365877427400680.534122572599324
218.98.132854088722610.767145911277392
228.98.240634241938360.659365758061643
238.98.249682879030820.650317120969179
248.88.279365758061640.520634241938358
258.88.282536967753420.51746303224658
268.78.281268483876720.418731516123284
278.78.36841439515410.331585604845893
288.58.192219846784250.307780153215749
298.58.289682879030820.210317120969178
308.48.298731516123280.101268483876715
318.28.30778015321575-0.10778015321575
328.28.31746303224657-0.117463032246571
338.18.56858364510957-0.468583645109567
348.18.67636379832532-0.576363798325316
3588.44334045964725-0.443340459647247
367.98.42460894352396-0.524608943523962
377.88.57302333867806-0.77302333867806
387.78.52334045964725-0.823340459647247
397.68.51365758061642-0.913657580616426
407.58.48270621770889-0.98270621770889
417.58.58016924995546-1.08016924995546
427.58.58921788704792-1.08921788704792
437.58.59826652414039-1.09826652414039
447.58.6079494031712-1.10794940317121
457.48.37492606449314-0.97492606449314
467.48.19221984678425-0.79221984678425
477.37.86236771779797-0.56236771779797
487.37.84363620167469-0.543636201674685
497.37.89522180652057-0.595221806520569
507.27.79712453233565-0.59712453233565
517.27.69061286299662-0.490612862996616
527.37.8049046855514-0.504904685551399
537.47.70871013718154-0.308710137181544
547.47.57251558881169-0.172515588811688
557.57.53314983075005-0.0331498307500458
567.67.591247104934970.0087528950650263
577.77.648710137181540.0512898628184562
587.97.90173347585961-0.00173347585961171
5988.34651166933903-0.346511669339034
608.28.56985212898628-0.369852128986282


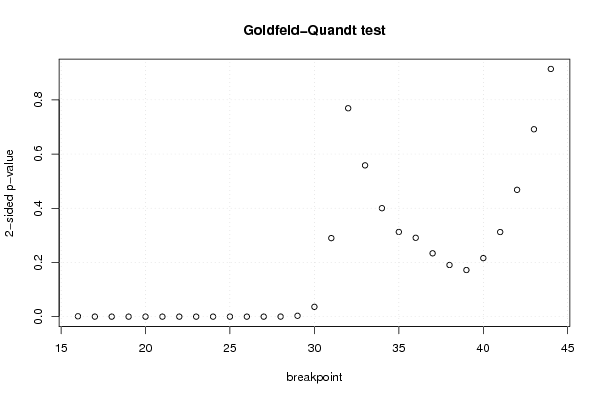
Goldfeld-Quandt test for Heteroskedasticity
p-valuesAlternative Hypothesis
breakpoint indexgreater2-sidedless
160.0006979899673635150.001395979934727030.999302010032636
175.78564290888853e-050.0001157128581777710.99994214357091
184.23915078926217e-068.47830157852434e-060.99999576084921
193.08190685036631e-076.16381370073261e-070.999999691809315
208.79520420503894e-081.75904084100779e-070.999999912047958
214.27369409037339e-088.54738818074678e-080.99999995726306
221.40184697940510e-082.80369395881021e-080.99999998598153
235.14919880119734e-091.02983976023947e-080.999999994850801
241.16246869537657e-072.32493739075314e-070.99999988375313
251.23130353760903e-072.46260707521805e-070.999999876869646
267.7283795597078e-071.54567591194156e-060.999999227162044
277.19839503419977e-061.43967900683995e-050.999992801604966
280.0001214038444011100.0002428076888022210.999878596155599
290.001586874460969170.003173748921938340.99841312553903
300.01812160078532520.03624320157065050.981878399214675
310.1448984103313700.2897968206627390.85510158966863
320.3845416314986020.7690832629972050.615458368501398
330.72082630376320.55834739247360.2791736962368
340.7998585937847430.4002828124305140.200141406215257
350.8437289624286150.3125420751427690.156271037571385
360.8545084034583030.2909831930833940.145491596541697
370.8831221148875750.2337557702248500.116877885112425
380.9046814766112470.1906370467775070.0953185233887533
390.9139926609920470.1720146780159060.0860073390079531
400.8919796019124670.2160407961750660.108020398087533
410.8438831492510650.3122337014978700.156116850748935
420.7660153354700250.4679693290599510.233984664529975
430.6542188213527350.691562357294530.345781178647265
440.5429558387714190.9140883224571630.457044161228581

\begin{tabular}{lllllllll}
\hline
Goldfeld-Quandt test for Heteroskedasticity \tabularnewline
p-values & Alternative Hypothesis \tabularnewline
breakpoint index & greater & 2-sided & less \tabularnewline
16 & 0.000697989967363515 & 0.00139597993472703 & 0.999302010032636 \tabularnewline
17 & 5.78564290888853e-05 & 0.000115712858177771 & 0.99994214357091 \tabularnewline
18 & 4.23915078926217e-06 & 8.47830157852434e-06 & 0.99999576084921 \tabularnewline
19 & 3.08190685036631e-07 & 6.16381370073261e-07 & 0.999999691809315 \tabularnewline
20 & 8.79520420503894e-08 & 1.75904084100779e-07 & 0.999999912047958 \tabularnewline
21 & 4.27369409037339e-08 & 8.54738818074678e-08 & 0.99999995726306 \tabularnewline
22 & 1.40184697940510e-08 & 2.80369395881021e-08 & 0.99999998598153 \tabularnewline
23 & 5.14919880119734e-09 & 1.02983976023947e-08 & 0.999999994850801 \tabularnewline
24 & 1.16246869537657e-07 & 2.32493739075314e-07 & 0.99999988375313 \tabularnewline
25 & 1.23130353760903e-07 & 2.46260707521805e-07 & 0.999999876869646 \tabularnewline
26 & 7.7283795597078e-07 & 1.54567591194156e-06 & 0.999999227162044 \tabularnewline
27 & 7.19839503419977e-06 & 1.43967900683995e-05 & 0.999992801604966 \tabularnewline
28 & 0.000121403844401110 & 0.000242807688802221 & 0.999878596155599 \tabularnewline
29 & 0.00158687446096917 & 0.00317374892193834 & 0.99841312553903 \tabularnewline
30 & 0.0181216007853252 & 0.0362432015706505 & 0.981878399214675 \tabularnewline
31 & 0.144898410331370 & 0.289796820662739 & 0.85510158966863 \tabularnewline
32 & 0.384541631498602 & 0.769083262997205 & 0.615458368501398 \tabularnewline
33 & 0.7208263037632 & 0.5583473924736 & 0.2791736962368 \tabularnewline
34 & 0.799858593784743 & 0.400282812430514 & 0.200141406215257 \tabularnewline
35 & 0.843728962428615 & 0.312542075142769 & 0.156271037571385 \tabularnewline
36 & 0.854508403458303 & 0.290983193083394 & 0.145491596541697 \tabularnewline
37 & 0.883122114887575 & 0.233755770224850 & 0.116877885112425 \tabularnewline
38 & 0.904681476611247 & 0.190637046777507 & 0.0953185233887533 \tabularnewline
39 & 0.913992660992047 & 0.172014678015906 & 0.0860073390079531 \tabularnewline
40 & 0.891979601912467 & 0.216040796175066 & 0.108020398087533 \tabularnewline
41 & 0.843883149251065 & 0.312233701497870 & 0.156116850748935 \tabularnewline
42 & 0.766015335470025 & 0.467969329059951 & 0.233984664529975 \tabularnewline
43 & 0.654218821352735 & 0.69156235729453 & 0.345781178647265 \tabularnewline
44 & 0.542955838771419 & 0.914088322457163 & 0.457044161228581 \tabularnewline
\hline
\end{tabular}
%Source: https://freestatistics.org/blog/index.php?pk=61064&T=5

[TABLE]
[ROW][C]Goldfeld-Quandt test for Heteroskedasticity[/C][/ROW]
[ROW][C]p-values[/C][C]Alternative Hypothesis[/C][/ROW]
[ROW][C]breakpoint index[/C][C]greater[/C][C]2-sided[/C][C]less[/C][/ROW]
[ROW][C]16[/C][C]0.000697989967363515[/C][C]0.00139597993472703[/C][C]0.999302010032636[/C][/ROW]
[ROW][C]17[/C][C]5.78564290888853e-05[/C][C]0.000115712858177771[/C][C]0.99994214357091[/C][/ROW]
[ROW][C]18[/C][C]4.23915078926217e-06[/C][C]8.47830157852434e-06[/C][C]0.99999576084921[/C][/ROW]
[ROW][C]19[/C][C]3.08190685036631e-07[/C][C]6.16381370073261e-07[/C][C]0.999999691809315[/C][/ROW]
[ROW][C]20[/C][C]8.79520420503894e-08[/C][C]1.75904084100779e-07[/C][C]0.999999912047958[/C][/ROW]
[ROW][C]21[/C][C]4.27369409037339e-08[/C][C]8.54738818074678e-08[/C][C]0.99999995726306[/C][/ROW]
[ROW][C]22[/C][C]1.40184697940510e-08[/C][C]2.80369395881021e-08[/C][C]0.99999998598153[/C][/ROW]
[ROW][C]23[/C][C]5.14919880119734e-09[/C][C]1.02983976023947e-08[/C][C]0.999999994850801[/C][/ROW]
[ROW][C]24[/C][C]1.16246869537657e-07[/C][C]2.32493739075314e-07[/C][C]0.99999988375313[/C][/ROW]
[ROW][C]25[/C][C]1.23130353760903e-07[/C][C]2.46260707521805e-07[/C][C]0.999999876869646[/C][/ROW]
[ROW][C]26[/C][C]7.7283795597078e-07[/C][C]1.54567591194156e-06[/C][C]0.999999227162044[/C][/ROW]
[ROW][C]27[/C][C]7.19839503419977e-06[/C][C]1.43967900683995e-05[/C][C]0.999992801604966[/C][/ROW]
[ROW][C]28[/C][C]0.000121403844401110[/C][C]0.000242807688802221[/C][C]0.999878596155599[/C][/ROW]
[ROW][C]29[/C][C]0.00158687446096917[/C][C]0.00317374892193834[/C][C]0.99841312553903[/C][/ROW]
[ROW][C]30[/C][C]0.0181216007853252[/C][C]0.0362432015706505[/C][C]0.981878399214675[/C][/ROW]
[ROW][C]31[/C][C]0.144898410331370[/C][C]0.289796820662739[/C][C]0.85510158966863[/C][/ROW]
[ROW][C]32[/C][C]0.384541631498602[/C][C]0.769083262997205[/C][C]0.615458368501398[/C][/ROW]
[ROW][C]33[/C][C]0.7208263037632[/C][C]0.5583473924736[/C][C]0.2791736962368[/C][/ROW]
[ROW][C]34[/C][C]0.799858593784743[/C][C]0.400282812430514[/C][C]0.200141406215257[/C][/ROW]
[ROW][C]35[/C][C]0.843728962428615[/C][C]0.312542075142769[/C][C]0.156271037571385[/C][/ROW]
[ROW][C]36[/C][C]0.854508403458303[/C][C]0.290983193083394[/C][C]0.145491596541697[/C][/ROW]
[ROW][C]37[/C][C]0.883122114887575[/C][C]0.233755770224850[/C][C]0.116877885112425[/C][/ROW]
[ROW][C]38[/C][C]0.904681476611247[/C][C]0.190637046777507[/C][C]0.0953185233887533[/C][/ROW]
[ROW][C]39[/C][C]0.913992660992047[/C][C]0.172014678015906[/C][C]0.0860073390079531[/C][/ROW]
[ROW][C]40[/C][C]0.891979601912467[/C][C]0.216040796175066[/C][C]0.108020398087533[/C][/ROW]
[ROW][C]41[/C][C]0.843883149251065[/C][C]0.312233701497870[/C][C]0.156116850748935[/C][/ROW]
[ROW][C]42[/C][C]0.766015335470025[/C][C]0.467969329059951[/C][C]0.233984664529975[/C][/ROW]
[ROW][C]43[/C][C]0.654218821352735[/C][C]0.69156235729453[/C][C]0.345781178647265[/C][/ROW]
[ROW][C]44[/C][C]0.542955838771419[/C][C]0.914088322457163[/C][C]0.457044161228581[/C][/ROW]
[/TABLE]
Source: https://freestatistics.org/blog/index.php?pk=61064&T=5

Globally Unique Identifier (entire table): ba.freestatistics.org/blog/index.php?pk=61064&T=5

As an alternative you can also use a QR Code:  

The GUIDs for individual cells are displayed in the table below:

Goldfeld-Quandt test for Heteroskedasticity
p-valuesAlternative Hypothesis
breakpoint indexgreater2-sidedless
160.0006979899673635150.001395979934727030.999302010032636
175.78564290888853e-050.0001157128581777710.99994214357091
184.23915078926217e-068.47830157852434e-060.99999576084921
193.08190685036631e-076.16381370073261e-070.999999691809315
208.79520420503894e-081.75904084100779e-070.999999912047958
214.27369409037339e-088.54738818074678e-080.99999995726306
221.40184697940510e-082.80369395881021e-080.99999998598153
235.14919880119734e-091.02983976023947e-080.999999994850801
241.16246869537657e-072.32493739075314e-070.99999988375313
251.23130353760903e-072.46260707521805e-070.999999876869646
267.7283795597078e-071.54567591194156e-060.999999227162044
277.19839503419977e-061.43967900683995e-050.999992801604966
280.0001214038444011100.0002428076888022210.999878596155599
290.001586874460969170.003173748921938340.99841312553903
300.01812160078532520.03624320157065050.981878399214675
310.1448984103313700.2897968206627390.85510158966863
320.3845416314986020.7690832629972050.615458368501398
330.72082630376320.55834739247360.2791736962368
340.7998585937847430.4002828124305140.200141406215257
350.8437289624286150.3125420751427690.156271037571385
360.8545084034583030.2909831930833940.145491596541697
370.8831221148875750.2337557702248500.116877885112425
380.9046814766112470.1906370467775070.0953185233887533
390.9139926609920470.1720146780159060.0860073390079531
400.8919796019124670.2160407961750660.108020398087533
410.8438831492510650.3122337014978700.156116850748935
420.7660153354700250.4679693290599510.233984664529975
430.6542188213527350.691562357294530.345781178647265
440.5429558387714190.9140883224571630.457044161228581


Meta Analysis of Goldfeld-Quandt test for Heteroskedasticity
Description# significant tests% significant testsOK/NOK
1% type I error level140.482758620689655NOK
5% type I error level150.517241379310345NOK
10% type I error level150.517241379310345NOK

\begin{tabular}{lllllllll}
\hline
Meta Analysis of Goldfeld-Quandt test for Heteroskedasticity \tabularnewline
Description & # significant tests & % significant tests & OK/NOK \tabularnewline
1% type I error level & 14 & 0.482758620689655 & NOK \tabularnewline
5% type I error level & 15 & 0.517241379310345 & NOK \tabularnewline
10% type I error level & 15 & 0.517241379310345 & NOK \tabularnewline
\hline
\end{tabular}
%Source: https://freestatistics.org/blog/index.php?pk=61064&T=6

[TABLE]
[ROW][C]Meta Analysis of Goldfeld-Quandt test for Heteroskedasticity[/C][/ROW]
[ROW][C]Description[/C][C]# significant tests[/C][C]% significant tests[/C][C]OK/NOK[/C][/ROW]
[ROW][C]1% type I error level[/C][C]14[/C][C]0.482758620689655[/C][C]NOK[/C][/ROW]
[ROW][C]5% type I error level[/C][C]15[/C][C]0.517241379310345[/C][C]NOK[/C][/ROW]
[ROW][C]10% type I error level[/C][C]15[/C][C]0.517241379310345[/C][C]NOK[/C][/ROW]
[/TABLE]
Source: https://freestatistics.org/blog/index.php?pk=61064&T=6

Globally Unique Identifier (entire table): ba.freestatistics.org/blog/index.php?pk=61064&T=6

As an alternative you can also use a QR Code:  

The GUIDs for individual cells are displayed in the table below:

Meta Analysis of Goldfeld-Quandt test for Heteroskedasticity
Description# significant tests% significant testsOK/NOK
1% type I error level140.482758620689655NOK
5% type I error level150.517241379310345NOK
10% type I error level150.517241379310345NOK


Parameters (Session):
par1 = 1 ; par2 = Include Monthly Dummies ; par3 = No Linear Trend ;
Parameters (R input):
par1 = 1 ; par2 = Include Monthly Dummies ; par3 = No Linear Trend ;
R code (references can be found in the software module):
library(lattice)
library(lmtest)
n25 <- 25 #minimum number of obs. for Goldfeld-Quandt test
par1 <- as.numeric(par1)
x <- t(y)
k <- length(x[1,])
n <- length(x[,1])
x1 <- cbind(x[,par1], x[,1:k!=par1])
mycolnames <- c(colnames(x)[par1], colnames(x)[1:k!=par1])
colnames(x1) <- mycolnames #colnames(x)[par1]
x <- x1
if (par3 == 'First Differences'){
x2 <- array(0, dim=c(n-1,k), dimnames=list(1:(n-1), paste('(1-B)',colnames(x),sep='')))
for (i in 1:n-1) {
for (j in 1:k) {
x2[i,j] <- x[i+1,j] - x[i,j]
}
}
x <- x2
}
if (par2 == 'Include Monthly Dummies'){
x2 <- array(0, dim=c(n,11), dimnames=list(1:n, paste('M', seq(1:11), sep ='')))
for (i in 1:11){
x2[seq(i,n,12),i] <- 1
}
x <- cbind(x, x2)
}
if (par2 == 'Include Quarterly Dummies'){
x2 <- array(0, dim=c(n,3), dimnames=list(1:n, paste('Q', seq(1:3), sep ='')))
for (i in 1:3){
x2[seq(i,n,4),i] <- 1
}
x <- cbind(x, x2)
}
k <- length(x[1,])
if (par3 == 'Linear Trend'){
x <- cbind(x, c(1:n))
colnames(x)[k+1] <- 't'
}
x
k <- length(x[1,])
df <- as.data.frame(x)
(mylm <- lm(df))
(mysum <- summary(mylm))
if (n > n25) {
kp3 <- k + 3
nmkm3 <- n - k - 3
gqarr <- array(NA, dim=c(nmkm3-kp3+1,3))
numgqtests <- 0
numsignificant1 <- 0
numsignificant5 <- 0
numsignificant10 <- 0
for (mypoint in kp3:nmkm3) {
j <- 0
numgqtests <- numgqtests + 1
for (myalt in c('greater', 'two.sided', 'less')) {
j <- j + 1
gqarr[mypoint-kp3+1,j] <- gqtest(mylm, point=mypoint, alternative=myalt)$p.value
}
if (gqarr[mypoint-kp3+1,2] < 0.01) numsignificant1 <- numsignificant1 + 1
if (gqarr[mypoint-kp3+1,2] < 0.05) numsignificant5 <- numsignificant5 + 1
if (gqarr[mypoint-kp3+1,2] < 0.10) numsignificant10 <- numsignificant10 + 1
}
gqarr
}
bitmap(file='test0.png')
plot(x[,1], type='l', main='Actuals and Interpolation', ylab='value of Actuals and Interpolation (dots)', xlab='time or index')
points(x[,1]-mysum$resid)
grid()
dev.off()
bitmap(file='test1.png')
plot(mysum$resid, type='b', pch=19, main='Residuals', ylab='value of Residuals', xlab='time or index')
grid()
dev.off()
bitmap(file='test2.png')
hist(mysum$resid, main='Residual Histogram', xlab='values of Residuals')
grid()
dev.off()
bitmap(file='test3.png')
densityplot(~mysum$resid,col='black',main='Residual Density Plot', xlab='values of Residuals')
dev.off()
bitmap(file='test4.png')
qqnorm(mysum$resid, main='Residual Normal Q-Q Plot')
qqline(mysum$resid)
grid()
dev.off()
(myerror <- as.ts(mysum$resid))
bitmap(file='test5.png')
dum <- cbind(lag(myerror,k=1),myerror)
dum
dum1 <- dum[2:length(myerror),]
dum1
z <- as.data.frame(dum1)
z
plot(z,main=paste('Residual Lag plot, lowess, and regression line'), ylab='values of Residuals', xlab='lagged values of Residuals')
lines(lowess(z))
abline(lm(z))
grid()
dev.off()
bitmap(file='test6.png')
acf(mysum$resid, lag.max=length(mysum$resid)/2, main='Residual Autocorrelation Function')
grid()
dev.off()
bitmap(file='test7.png')
pacf(mysum$resid, lag.max=length(mysum$resid)/2, main='Residual Partial Autocorrelation Function')
grid()
dev.off()
bitmap(file='test8.png')
opar <- par(mfrow = c(2,2), oma = c(0, 0, 1.1, 0))
plot(mylm, las = 1, sub='Residual Diagnostics')
par(opar)
dev.off()
if (n > n25) {
bitmap(file='test9.png')
plot(kp3:nmkm3,gqarr[,2], main='Goldfeld-Quandt test',ylab='2-sided p-value',xlab='breakpoint')
grid()
dev.off()
}
load(file='createtable')
a<-table.start()
a<-table.row.start(a)
a<-table.element(a, 'Multiple Linear Regression - Estimated Regression Equation', 1, TRUE)
a<-table.row.end(a)
myeq <- colnames(x)[1]
myeq <- paste(myeq, '[t] = ', sep='')
for (i in 1:k){
if (mysum$coefficients[i,1] > 0) myeq <- paste(myeq, '+', '')
myeq <- paste(myeq, mysum$coefficients[i,1], sep=' ')
if (rownames(mysum$coefficients)[i] != '(Intercept)') {
myeq <- paste(myeq, rownames(mysum$coefficients)[i], sep='')
if (rownames(mysum$coefficients)[i] != 't') myeq <- paste(myeq, '[t]', sep='')
}
}
myeq <- paste(myeq, ' + e[t]')
a<-table.row.start(a)
a<-table.element(a, myeq)
a<-table.row.end(a)
a<-table.end(a)
table.save(a,file='mytable1.tab')
a<-table.start()
a<-table.row.start(a)
a<-table.element(a,hyperlink('ols1.htm','Multiple Linear Regression - Ordinary Least Squares',''), 6, TRUE)
a<-table.row.end(a)
a<-table.row.start(a)
a<-table.element(a,'Variable',header=TRUE)
a<-table.element(a,'Parameter',header=TRUE)
a<-table.element(a,'S.D.',header=TRUE)
a<-table.element(a,'T-STAT
H0: parameter = 0',header=TRUE)
a<-table.element(a,'2-tail p-value',header=TRUE)
a<-table.element(a,'1-tail p-value',header=TRUE)
a<-table.row.end(a)
for (i in 1:k){
a<-table.row.start(a)
a<-table.element(a,rownames(mysum$coefficients)[i],header=TRUE)
a<-table.element(a,mysum$coefficients[i,1])
a<-table.element(a, round(mysum$coefficients[i,2],6))
a<-table.element(a, round(mysum$coefficients[i,3],4))
a<-table.element(a, round(mysum$coefficients[i,4],6))
a<-table.element(a, round(mysum$coefficients[i,4]/2,6))
a<-table.row.end(a)
}
a<-table.end(a)
table.save(a,file='mytable2.tab')
a<-table.start()
a<-table.row.start(a)
a<-table.element(a, 'Multiple Linear Regression - Regression Statistics', 2, TRUE)
a<-table.row.end(a)
a<-table.row.start(a)
a<-table.element(a, 'Multiple R',1,TRUE)
a<-table.element(a, sqrt(mysum$r.squared))
a<-table.row.end(a)
a<-table.row.start(a)
a<-table.element(a, 'R-squared',1,TRUE)
a<-table.element(a, mysum$r.squared)
a<-table.row.end(a)
a<-table.row.start(a)
a<-table.element(a, 'Adjusted R-squared',1,TRUE)
a<-table.element(a, mysum$adj.r.squared)
a<-table.row.end(a)
a<-table.row.start(a)
a<-table.element(a, 'F-TEST (value)',1,TRUE)
a<-table.element(a, mysum$fstatistic[1])
a<-table.row.end(a)
a<-table.row.start(a)
a<-table.element(a, 'F-TEST (DF numerator)',1,TRUE)
a<-table.element(a, mysum$fstatistic[2])
a<-table.row.end(a)
a<-table.row.start(a)
a<-table.element(a, 'F-TEST (DF denominator)',1,TRUE)
a<-table.element(a, mysum$fstatistic[3])
a<-table.row.end(a)
a<-table.row.start(a)
a<-table.element(a, 'p-value',1,TRUE)
a<-table.element(a, 1-pf(mysum$fstatistic[1],mysum$fstatistic[2],mysum$fstatistic[3]))
a<-table.row.end(a)
a<-table.row.start(a)
a<-table.element(a, 'Multiple Linear Regression - Residual Statistics', 2, TRUE)
a<-table.row.end(a)
a<-table.row.start(a)
a<-table.element(a, 'Residual Standard Deviation',1,TRUE)
a<-table.element(a, mysum$sigma)
a<-table.row.end(a)
a<-table.row.start(a)
a<-table.element(a, 'Sum Squared Residuals',1,TRUE)
a<-table.element(a, sum(myerror*myerror))
a<-table.row.end(a)
a<-table.end(a)
table.save(a,file='mytable3.tab')
a<-table.start()
a<-table.row.start(a)
a<-table.element(a, 'Multiple Linear Regression - Actuals, Interpolation, and Residuals', 4, TRUE)
a<-table.row.end(a)
a<-table.row.start(a)
a<-table.element(a, 'Time or Index', 1, TRUE)
a<-table.element(a, 'Actuals', 1, TRUE)
a<-table.element(a, 'Interpolation
Forecast', 1, TRUE)
a<-table.element(a, 'Residuals
Prediction Error', 1, TRUE)
a<-table.row.end(a)
for (i in 1:n) {
a<-table.row.start(a)
a<-table.element(a,i, 1, TRUE)
a<-table.element(a,x[i])
a<-table.element(a,x[i]-mysum$resid[i])
a<-table.element(a,mysum$resid[i])
a<-table.row.end(a)
}
a<-table.end(a)
table.save(a,file='mytable4.tab')
if (n > n25) {
a<-table.start()
a<-table.row.start(a)
a<-table.element(a,'Goldfeld-Quandt test for Heteroskedasticity',4,TRUE)
a<-table.row.end(a)
a<-table.row.start(a)
a<-table.element(a,'p-values',header=TRUE)
a<-table.element(a,'Alternative Hypothesis',3,header=TRUE)
a<-table.row.end(a)
a<-table.row.start(a)
a<-table.element(a,'breakpoint index',header=TRUE)
a<-table.element(a,'greater',header=TRUE)
a<-table.element(a,'2-sided',header=TRUE)
a<-table.element(a,'less',header=TRUE)
a<-table.row.end(a)
for (mypoint in kp3:nmkm3) {
a<-table.row.start(a)
a<-table.element(a,mypoint,header=TRUE)
a<-table.element(a,gqarr[mypoint-kp3+1,1])
a<-table.element(a,gqarr[mypoint-kp3+1,2])
a<-table.element(a,gqarr[mypoint-kp3+1,3])
a<-table.row.end(a)
}
a<-table.end(a)
table.save(a,file='mytable5.tab')
a<-table.start()
a<-table.row.start(a)
a<-table.element(a,'Meta Analysis of Goldfeld-Quandt test for Heteroskedasticity',4,TRUE)
a<-table.row.end(a)
a<-table.row.start(a)
a<-table.element(a,'Description',header=TRUE)
a<-table.element(a,'# significant tests',header=TRUE)
a<-table.element(a,'% significant tests',header=TRUE)
a<-table.element(a,'OK/NOK',header=TRUE)
a<-table.row.end(a)
a<-table.row.start(a)
a<-table.element(a,'1% type I error level',header=TRUE)
a<-table.element(a,numsignificant1)
a<-table.element(a,numsignificant1/numgqtests)
if (numsignificant1/numgqtests < 0.01) dum <- 'OK' else dum <- 'NOK'
a<-table.element(a,dum)
a<-table.row.end(a)
a<-table.row.start(a)
a<-table.element(a,'5% type I error level',header=TRUE)
a<-table.element(a,numsignificant5)
a<-table.element(a,numsignificant5/numgqtests)
if (numsignificant5/numgqtests < 0.05) dum <- 'OK' else dum <- 'NOK'
a<-table.element(a,dum)
a<-table.row.end(a)
a<-table.row.start(a)
a<-table.element(a,'10% type I error level',header=TRUE)
a<-table.element(a,numsignificant10)
a<-table.element(a,numsignificant10/numgqtests)
if (numsignificant10/numgqtests < 0.1) dum <- 'OK' else dum <- 'NOK'
a<-table.element(a,dum)
a<-table.row.end(a)
a<-table.end(a)
table.save(a,file='mytable6.tab')
}