Free Statistics

of Irreproducible Research!

Author's title

Author*Unverified author*
R Software Modulerwasp_autocorrelation.wasp
Title produced by software(Partial) Autocorrelation Function
Date of computationFri, 27 Nov 2009 11:14:57 -0700
Cite this page as followsStatistical Computations at FreeStatistics.org, Office for Research Development and Education, URL https://freestatistics.org/blog/index.php?v=date/2009/Nov/27/t12593461953yi75iylkd9tjor.htm/, Retrieved Sun, 28 Apr 2024 22:13:39 +0000
Statistical Computations at FreeStatistics.org, Office for Research Development and Education, URL https://freestatistics.org/blog/index.php?pk=61077, Retrieved Sun, 28 Apr 2024 22:13:39 +0000
QR Codes:

Original text written by user:
IsPrivate?No (this computation is public)
User-defined keywords
Estimated Impact97
Family? (F = Feedback message, R = changed R code, M = changed R Module, P = changed Parameters, D = changed Data)
-       [(Partial) Autocorrelation Function] [1e model] [2009-11-27 18:14:57] [b0f64d7ca2e98fc55ef2208a4524e4b4] [Current]
Feedback Forum

Post a new message
Dataseries X:
593530
610943
612613
611324
594167
595454
590865
589379
584428
573100
567456
569028
620735
628884
628232
612117
595404
597141
593408
590072
579799
574205
572775
572942
619567
625809
619916
587625
565742
557274
560576
548854
531673
525919
511038
498662
555362
564591
541657
527070
509846
514258
516922
507561
492622
490243
469357
477580
528379
533590
517945
506174
501866
516141
528222
532638
536322
536535
523597
536214
586570
596594
580523


Summary of computational transaction
Raw Inputview raw input (R code)
Raw Outputview raw output of R engine
Computing time1 seconds
R Server'Gwilym Jenkins' @ 72.249.127.135

\begin{tabular}{lllllllll}
\hline
Summary of computational transaction \tabularnewline
Raw Input & view raw input (R code)  \tabularnewline
Raw Output & view raw output of R engine  \tabularnewline
Computing time & 1 seconds \tabularnewline
R Server & 'Gwilym Jenkins' @ 72.249.127.135 \tabularnewline
\hline
\end{tabular}
%Source: https://freestatistics.org/blog/index.php?pk=61077&T=0

[TABLE]
[ROW][C]Summary of computational transaction[/C][/ROW]
[ROW][C]Raw Input[/C][C]view raw input (R code) [/C][/ROW]
[ROW][C]Raw Output[/C][C]view raw output of R engine [/C][/ROW]
[ROW][C]Computing time[/C][C]1 seconds[/C][/ROW]
[ROW][C]R Server[/C][C]'Gwilym Jenkins' @ 72.249.127.135[/C][/ROW]
[/TABLE]
Source: https://freestatistics.org/blog/index.php?pk=61077&T=0

Globally Unique Identifier (entire table): ba.freestatistics.org/blog/index.php?pk=61077&T=0

As an alternative you can also use a QR Code:  

The GUIDs for individual cells are displayed in the table below:

Summary of computational transaction
Raw Inputview raw input (R code)
Raw Outputview raw output of R engine
Computing time1 seconds
R Server'Gwilym Jenkins' @ 72.249.127.135


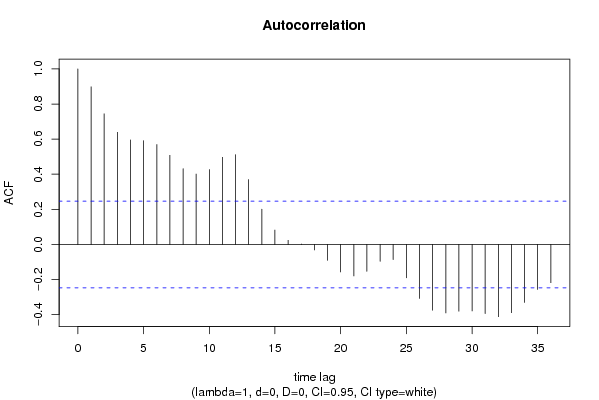
Autocorrelation Function
Time lag kACF(k)T-STATP-value
10.8984617.13130
20.74455.90930
30.6392325.07372e-06
40.5956624.72797e-06
50.5915064.69497e-06
60.5690044.51631.4e-05
70.5075944.02897.7e-05
80.4319173.42820.000538
90.4009643.18260.001134
100.4269633.38890.000607
110.4966893.94230.000103
120.511454.05956.9e-05
130.3698932.93590.002319
140.2010211.59560.057797
150.0817460.64880.2594
160.0235310.18680.426221
170.0020480.01630.493541
18-0.031328-0.24870.402217
19-0.090252-0.71640.23821
20-0.157018-1.24630.108636
21-0.179405-1.4240.079693
22-0.152946-1.2140.114646
23-0.096008-0.7620.224441
24-0.086239-0.68450.248085
25-0.190149-1.50930.068116
26-0.30747-2.44050.008746
27-0.37493-2.97590.00207
28-0.390292-3.09780.001455
29-0.380776-3.02230.001812
30-0.378795-3.00660.001896
31-0.394267-3.12940.001327
32-0.411593-3.26690.000881
33-0.389149-3.08880.001494
34-0.330521-2.62340.005453
35-0.256372-2.03490.023037
36-0.218093-1.73110.044168

\begin{tabular}{lllllllll}
\hline
Autocorrelation Function \tabularnewline
Time lag k & ACF(k) & T-STAT & P-value \tabularnewline
1 & 0.898461 & 7.1313 & 0 \tabularnewline
2 & 0.7445 & 5.9093 & 0 \tabularnewline
3 & 0.639232 & 5.0737 & 2e-06 \tabularnewline
4 & 0.595662 & 4.7279 & 7e-06 \tabularnewline
5 & 0.591506 & 4.6949 & 7e-06 \tabularnewline
6 & 0.569004 & 4.5163 & 1.4e-05 \tabularnewline
7 & 0.507594 & 4.0289 & 7.7e-05 \tabularnewline
8 & 0.431917 & 3.4282 & 0.000538 \tabularnewline
9 & 0.400964 & 3.1826 & 0.001134 \tabularnewline
10 & 0.426963 & 3.3889 & 0.000607 \tabularnewline
11 & 0.496689 & 3.9423 & 0.000103 \tabularnewline
12 & 0.51145 & 4.0595 & 6.9e-05 \tabularnewline
13 & 0.369893 & 2.9359 & 0.002319 \tabularnewline
14 & 0.201021 & 1.5956 & 0.057797 \tabularnewline
15 & 0.081746 & 0.6488 & 0.2594 \tabularnewline
16 & 0.023531 & 0.1868 & 0.426221 \tabularnewline
17 & 0.002048 & 0.0163 & 0.493541 \tabularnewline
18 & -0.031328 & -0.2487 & 0.402217 \tabularnewline
19 & -0.090252 & -0.7164 & 0.23821 \tabularnewline
20 & -0.157018 & -1.2463 & 0.108636 \tabularnewline
21 & -0.179405 & -1.424 & 0.079693 \tabularnewline
22 & -0.152946 & -1.214 & 0.114646 \tabularnewline
23 & -0.096008 & -0.762 & 0.224441 \tabularnewline
24 & -0.086239 & -0.6845 & 0.248085 \tabularnewline
25 & -0.190149 & -1.5093 & 0.068116 \tabularnewline
26 & -0.30747 & -2.4405 & 0.008746 \tabularnewline
27 & -0.37493 & -2.9759 & 0.00207 \tabularnewline
28 & -0.390292 & -3.0978 & 0.001455 \tabularnewline
29 & -0.380776 & -3.0223 & 0.001812 \tabularnewline
30 & -0.378795 & -3.0066 & 0.001896 \tabularnewline
31 & -0.394267 & -3.1294 & 0.001327 \tabularnewline
32 & -0.411593 & -3.2669 & 0.000881 \tabularnewline
33 & -0.389149 & -3.0888 & 0.001494 \tabularnewline
34 & -0.330521 & -2.6234 & 0.005453 \tabularnewline
35 & -0.256372 & -2.0349 & 0.023037 \tabularnewline
36 & -0.218093 & -1.7311 & 0.044168 \tabularnewline
\hline
\end{tabular}
%Source: https://freestatistics.org/blog/index.php?pk=61077&T=1

[TABLE]
[ROW][C]Autocorrelation Function[/C][/ROW]
[ROW][C]Time lag k[/C][C]ACF(k)[/C][C]T-STAT[/C][C]P-value[/C][/ROW]
[ROW][C]1[/C][C]0.898461[/C][C]7.1313[/C][C]0[/C][/ROW]
[ROW][C]2[/C][C]0.7445[/C][C]5.9093[/C][C]0[/C][/ROW]
[ROW][C]3[/C][C]0.639232[/C][C]5.0737[/C][C]2e-06[/C][/ROW]
[ROW][C]4[/C][C]0.595662[/C][C]4.7279[/C][C]7e-06[/C][/ROW]
[ROW][C]5[/C][C]0.591506[/C][C]4.6949[/C][C]7e-06[/C][/ROW]
[ROW][C]6[/C][C]0.569004[/C][C]4.5163[/C][C]1.4e-05[/C][/ROW]
[ROW][C]7[/C][C]0.507594[/C][C]4.0289[/C][C]7.7e-05[/C][/ROW]
[ROW][C]8[/C][C]0.431917[/C][C]3.4282[/C][C]0.000538[/C][/ROW]
[ROW][C]9[/C][C]0.400964[/C][C]3.1826[/C][C]0.001134[/C][/ROW]
[ROW][C]10[/C][C]0.426963[/C][C]3.3889[/C][C]0.000607[/C][/ROW]
[ROW][C]11[/C][C]0.496689[/C][C]3.9423[/C][C]0.000103[/C][/ROW]
[ROW][C]12[/C][C]0.51145[/C][C]4.0595[/C][C]6.9e-05[/C][/ROW]
[ROW][C]13[/C][C]0.369893[/C][C]2.9359[/C][C]0.002319[/C][/ROW]
[ROW][C]14[/C][C]0.201021[/C][C]1.5956[/C][C]0.057797[/C][/ROW]
[ROW][C]15[/C][C]0.081746[/C][C]0.6488[/C][C]0.2594[/C][/ROW]
[ROW][C]16[/C][C]0.023531[/C][C]0.1868[/C][C]0.426221[/C][/ROW]
[ROW][C]17[/C][C]0.002048[/C][C]0.0163[/C][C]0.493541[/C][/ROW]
[ROW][C]18[/C][C]-0.031328[/C][C]-0.2487[/C][C]0.402217[/C][/ROW]
[ROW][C]19[/C][C]-0.090252[/C][C]-0.7164[/C][C]0.23821[/C][/ROW]
[ROW][C]20[/C][C]-0.157018[/C][C]-1.2463[/C][C]0.108636[/C][/ROW]
[ROW][C]21[/C][C]-0.179405[/C][C]-1.424[/C][C]0.079693[/C][/ROW]
[ROW][C]22[/C][C]-0.152946[/C][C]-1.214[/C][C]0.114646[/C][/ROW]
[ROW][C]23[/C][C]-0.096008[/C][C]-0.762[/C][C]0.224441[/C][/ROW]
[ROW][C]24[/C][C]-0.086239[/C][C]-0.6845[/C][C]0.248085[/C][/ROW]
[ROW][C]25[/C][C]-0.190149[/C][C]-1.5093[/C][C]0.068116[/C][/ROW]
[ROW][C]26[/C][C]-0.30747[/C][C]-2.4405[/C][C]0.008746[/C][/ROW]
[ROW][C]27[/C][C]-0.37493[/C][C]-2.9759[/C][C]0.00207[/C][/ROW]
[ROW][C]28[/C][C]-0.390292[/C][C]-3.0978[/C][C]0.001455[/C][/ROW]
[ROW][C]29[/C][C]-0.380776[/C][C]-3.0223[/C][C]0.001812[/C][/ROW]
[ROW][C]30[/C][C]-0.378795[/C][C]-3.0066[/C][C]0.001896[/C][/ROW]
[ROW][C]31[/C][C]-0.394267[/C][C]-3.1294[/C][C]0.001327[/C][/ROW]
[ROW][C]32[/C][C]-0.411593[/C][C]-3.2669[/C][C]0.000881[/C][/ROW]
[ROW][C]33[/C][C]-0.389149[/C][C]-3.0888[/C][C]0.001494[/C][/ROW]
[ROW][C]34[/C][C]-0.330521[/C][C]-2.6234[/C][C]0.005453[/C][/ROW]
[ROW][C]35[/C][C]-0.256372[/C][C]-2.0349[/C][C]0.023037[/C][/ROW]
[ROW][C]36[/C][C]-0.218093[/C][C]-1.7311[/C][C]0.044168[/C][/ROW]
[/TABLE]
Source: https://freestatistics.org/blog/index.php?pk=61077&T=1

Globally Unique Identifier (entire table): ba.freestatistics.org/blog/index.php?pk=61077&T=1

As an alternative you can also use a QR Code:  

The GUIDs for individual cells are displayed in the table below:

Autocorrelation Function
Time lag kACF(k)T-STATP-value
10.8984617.13130
20.74455.90930
30.6392325.07372e-06
40.5956624.72797e-06
50.5915064.69497e-06
60.5690044.51631.4e-05
70.5075944.02897.7e-05
80.4319173.42820.000538
90.4009643.18260.001134
100.4269633.38890.000607
110.4966893.94230.000103
120.511454.05956.9e-05
130.3698932.93590.002319
140.2010211.59560.057797
150.0817460.64880.2594
160.0235310.18680.426221
170.0020480.01630.493541
18-0.031328-0.24870.402217
19-0.090252-0.71640.23821
20-0.157018-1.24630.108636
21-0.179405-1.4240.079693
22-0.152946-1.2140.114646
23-0.096008-0.7620.224441
24-0.086239-0.68450.248085
25-0.190149-1.50930.068116
26-0.30747-2.44050.008746
27-0.37493-2.97590.00207
28-0.390292-3.09780.001455
29-0.380776-3.02230.001812
30-0.378795-3.00660.001896
31-0.394267-3.12940.001327
32-0.411593-3.26690.000881
33-0.389149-3.08880.001494
34-0.330521-2.62340.005453
35-0.256372-2.03490.023037
36-0.218093-1.73110.044168


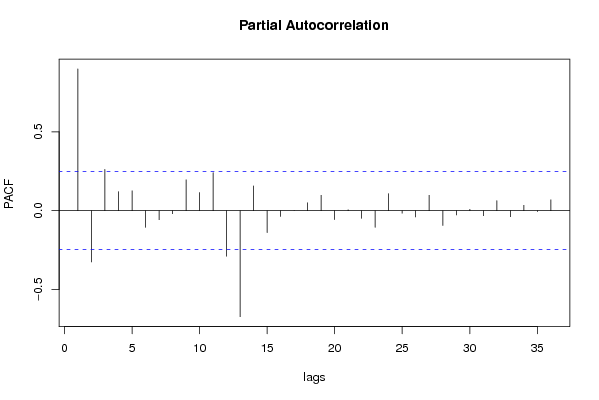
Partial Autocorrelation Function
Time lag kPACF(k)T-STATP-value
10.8984617.13130
2-0.32542-2.58290.006065
30.2612642.07370.0211
40.1199570.95210.172335
50.1259730.99990.160597
6-0.105611-0.83830.202527
7-0.057317-0.45490.325357
8-0.019719-0.15650.438063
90.1954431.55130.062922
100.1148290.91140.182772
110.2409981.91290.030156
12-0.288695-2.29140.012646
13-0.672286-5.33611e-06
140.1565091.24230.109374
15-0.139405-1.10650.13636
16-0.0371-0.29450.384683
17-0.000638-0.00510.497989
180.0499280.39630.346616
190.0971620.77120.221736
20-0.056719-0.45020.327058
210.0052840.04190.48334
22-0.049087-0.38960.349068
23-0.105464-0.83710.202851
240.1072680.85140.198882
25-0.016342-0.12970.448606
26-0.040253-0.31950.375202
270.0974440.77340.221077
28-0.09362-0.74310.230096
29-0.027218-0.2160.414829
300.008270.06560.473936
31-0.032308-0.25640.399224
320.062740.4980.310116
33-0.038018-0.30180.381914
340.0335320.26610.395497
35-0.005625-0.04460.482265
360.0685650.54420.294107

\begin{tabular}{lllllllll}
\hline
Partial Autocorrelation Function \tabularnewline
Time lag k & PACF(k) & T-STAT & P-value \tabularnewline
1 & 0.898461 & 7.1313 & 0 \tabularnewline
2 & -0.32542 & -2.5829 & 0.006065 \tabularnewline
3 & 0.261264 & 2.0737 & 0.0211 \tabularnewline
4 & 0.119957 & 0.9521 & 0.172335 \tabularnewline
5 & 0.125973 & 0.9999 & 0.160597 \tabularnewline
6 & -0.105611 & -0.8383 & 0.202527 \tabularnewline
7 & -0.057317 & -0.4549 & 0.325357 \tabularnewline
8 & -0.019719 & -0.1565 & 0.438063 \tabularnewline
9 & 0.195443 & 1.5513 & 0.062922 \tabularnewline
10 & 0.114829 & 0.9114 & 0.182772 \tabularnewline
11 & 0.240998 & 1.9129 & 0.030156 \tabularnewline
12 & -0.288695 & -2.2914 & 0.012646 \tabularnewline
13 & -0.672286 & -5.3361 & 1e-06 \tabularnewline
14 & 0.156509 & 1.2423 & 0.109374 \tabularnewline
15 & -0.139405 & -1.1065 & 0.13636 \tabularnewline
16 & -0.0371 & -0.2945 & 0.384683 \tabularnewline
17 & -0.000638 & -0.0051 & 0.497989 \tabularnewline
18 & 0.049928 & 0.3963 & 0.346616 \tabularnewline
19 & 0.097162 & 0.7712 & 0.221736 \tabularnewline
20 & -0.056719 & -0.4502 & 0.327058 \tabularnewline
21 & 0.005284 & 0.0419 & 0.48334 \tabularnewline
22 & -0.049087 & -0.3896 & 0.349068 \tabularnewline
23 & -0.105464 & -0.8371 & 0.202851 \tabularnewline
24 & 0.107268 & 0.8514 & 0.198882 \tabularnewline
25 & -0.016342 & -0.1297 & 0.448606 \tabularnewline
26 & -0.040253 & -0.3195 & 0.375202 \tabularnewline
27 & 0.097444 & 0.7734 & 0.221077 \tabularnewline
28 & -0.09362 & -0.7431 & 0.230096 \tabularnewline
29 & -0.027218 & -0.216 & 0.414829 \tabularnewline
30 & 0.00827 & 0.0656 & 0.473936 \tabularnewline
31 & -0.032308 & -0.2564 & 0.399224 \tabularnewline
32 & 0.06274 & 0.498 & 0.310116 \tabularnewline
33 & -0.038018 & -0.3018 & 0.381914 \tabularnewline
34 & 0.033532 & 0.2661 & 0.395497 \tabularnewline
35 & -0.005625 & -0.0446 & 0.482265 \tabularnewline
36 & 0.068565 & 0.5442 & 0.294107 \tabularnewline
\hline
\end{tabular}
%Source: https://freestatistics.org/blog/index.php?pk=61077&T=2

[TABLE]
[ROW][C]Partial Autocorrelation Function[/C][/ROW]
[ROW][C]Time lag k[/C][C]PACF(k)[/C][C]T-STAT[/C][C]P-value[/C][/ROW]
[ROW][C]1[/C][C]0.898461[/C][C]7.1313[/C][C]0[/C][/ROW]
[ROW][C]2[/C][C]-0.32542[/C][C]-2.5829[/C][C]0.006065[/C][/ROW]
[ROW][C]3[/C][C]0.261264[/C][C]2.0737[/C][C]0.0211[/C][/ROW]
[ROW][C]4[/C][C]0.119957[/C][C]0.9521[/C][C]0.172335[/C][/ROW]
[ROW][C]5[/C][C]0.125973[/C][C]0.9999[/C][C]0.160597[/C][/ROW]
[ROW][C]6[/C][C]-0.105611[/C][C]-0.8383[/C][C]0.202527[/C][/ROW]
[ROW][C]7[/C][C]-0.057317[/C][C]-0.4549[/C][C]0.325357[/C][/ROW]
[ROW][C]8[/C][C]-0.019719[/C][C]-0.1565[/C][C]0.438063[/C][/ROW]
[ROW][C]9[/C][C]0.195443[/C][C]1.5513[/C][C]0.062922[/C][/ROW]
[ROW][C]10[/C][C]0.114829[/C][C]0.9114[/C][C]0.182772[/C][/ROW]
[ROW][C]11[/C][C]0.240998[/C][C]1.9129[/C][C]0.030156[/C][/ROW]
[ROW][C]12[/C][C]-0.288695[/C][C]-2.2914[/C][C]0.012646[/C][/ROW]
[ROW][C]13[/C][C]-0.672286[/C][C]-5.3361[/C][C]1e-06[/C][/ROW]
[ROW][C]14[/C][C]0.156509[/C][C]1.2423[/C][C]0.109374[/C][/ROW]
[ROW][C]15[/C][C]-0.139405[/C][C]-1.1065[/C][C]0.13636[/C][/ROW]
[ROW][C]16[/C][C]-0.0371[/C][C]-0.2945[/C][C]0.384683[/C][/ROW]
[ROW][C]17[/C][C]-0.000638[/C][C]-0.0051[/C][C]0.497989[/C][/ROW]
[ROW][C]18[/C][C]0.049928[/C][C]0.3963[/C][C]0.346616[/C][/ROW]
[ROW][C]19[/C][C]0.097162[/C][C]0.7712[/C][C]0.221736[/C][/ROW]
[ROW][C]20[/C][C]-0.056719[/C][C]-0.4502[/C][C]0.327058[/C][/ROW]
[ROW][C]21[/C][C]0.005284[/C][C]0.0419[/C][C]0.48334[/C][/ROW]
[ROW][C]22[/C][C]-0.049087[/C][C]-0.3896[/C][C]0.349068[/C][/ROW]
[ROW][C]23[/C][C]-0.105464[/C][C]-0.8371[/C][C]0.202851[/C][/ROW]
[ROW][C]24[/C][C]0.107268[/C][C]0.8514[/C][C]0.198882[/C][/ROW]
[ROW][C]25[/C][C]-0.016342[/C][C]-0.1297[/C][C]0.448606[/C][/ROW]
[ROW][C]26[/C][C]-0.040253[/C][C]-0.3195[/C][C]0.375202[/C][/ROW]
[ROW][C]27[/C][C]0.097444[/C][C]0.7734[/C][C]0.221077[/C][/ROW]
[ROW][C]28[/C][C]-0.09362[/C][C]-0.7431[/C][C]0.230096[/C][/ROW]
[ROW][C]29[/C][C]-0.027218[/C][C]-0.216[/C][C]0.414829[/C][/ROW]
[ROW][C]30[/C][C]0.00827[/C][C]0.0656[/C][C]0.473936[/C][/ROW]
[ROW][C]31[/C][C]-0.032308[/C][C]-0.2564[/C][C]0.399224[/C][/ROW]
[ROW][C]32[/C][C]0.06274[/C][C]0.498[/C][C]0.310116[/C][/ROW]
[ROW][C]33[/C][C]-0.038018[/C][C]-0.3018[/C][C]0.381914[/C][/ROW]
[ROW][C]34[/C][C]0.033532[/C][C]0.2661[/C][C]0.395497[/C][/ROW]
[ROW][C]35[/C][C]-0.005625[/C][C]-0.0446[/C][C]0.482265[/C][/ROW]
[ROW][C]36[/C][C]0.068565[/C][C]0.5442[/C][C]0.294107[/C][/ROW]
[/TABLE]
Source: https://freestatistics.org/blog/index.php?pk=61077&T=2

Globally Unique Identifier (entire table): ba.freestatistics.org/blog/index.php?pk=61077&T=2

As an alternative you can also use a QR Code:  

The GUIDs for individual cells are displayed in the table below:

Partial Autocorrelation Function
Time lag kPACF(k)T-STATP-value
10.8984617.13130
2-0.32542-2.58290.006065
30.2612642.07370.0211
40.1199570.95210.172335
50.1259730.99990.160597
6-0.105611-0.83830.202527
7-0.057317-0.45490.325357
8-0.019719-0.15650.438063
90.1954431.55130.062922
100.1148290.91140.182772
110.2409981.91290.030156
12-0.288695-2.29140.012646
13-0.672286-5.33611e-06
140.1565091.24230.109374
15-0.139405-1.10650.13636
16-0.0371-0.29450.384683
17-0.000638-0.00510.497989
180.0499280.39630.346616
190.0971620.77120.221736
20-0.056719-0.45020.327058
210.0052840.04190.48334
22-0.049087-0.38960.349068
23-0.105464-0.83710.202851
240.1072680.85140.198882
25-0.016342-0.12970.448606
26-0.040253-0.31950.375202
270.0974440.77340.221077
28-0.09362-0.74310.230096
29-0.027218-0.2160.414829
300.008270.06560.473936
31-0.032308-0.25640.399224
320.062740.4980.310116
33-0.038018-0.30180.381914
340.0335320.26610.395497
35-0.005625-0.04460.482265
360.0685650.54420.294107


Parameters (Session):
par1 = 36 ; par2 = 1 ; par3 = 0 ; par4 = 0 ; par5 = 12 ; par6 = White Noise ; par7 = 0.95 ;
Parameters (R input):
par1 = 36 ; par2 = 1 ; par3 = 0 ; par4 = 0 ; par5 = 12 ; par6 = White Noise ; par7 = 0.95 ;
R code (references can be found in the software module):
if (par1 == 'Default') {
par1 = 10*log10(length(x))
} else {
par1 <- as.numeric(par1)
}
par2 <- as.numeric(par2)
par3 <- as.numeric(par3)
par4 <- as.numeric(par4)
par5 <- as.numeric(par5)
if (par6 == 'White Noise') par6 <- 'white' else par6 <- 'ma'
par7 <- as.numeric(par7)
if (par2 == 0) {
x <- log(x)
} else {
x <- (x ^ par2 - 1) / par2
}
if (par3 > 0) x <- diff(x,lag=1,difference=par3)
if (par4 > 0) x <- diff(x,lag=par5,difference=par4)
bitmap(file='pic1.png')
racf <- acf(x, par1, main='Autocorrelation', xlab='time lag', ylab='ACF', ci.type=par6, ci=par7, sub=paste('(lambda=',par2,', d=',par3,', D=',par4,', CI=', par7, ', CI type=',par6,')',sep=''))
dev.off()
bitmap(file='pic2.png')
rpacf <- pacf(x,par1,main='Partial Autocorrelation',xlab='lags',ylab='PACF')
dev.off()
(myacf <- c(racf$acf))
(mypacf <- c(rpacf$acf))
lengthx <- length(x)
sqrtn <- sqrt(lengthx)
load(file='createtable')
a<-table.start()
a<-table.row.start(a)
a<-table.element(a,'Autocorrelation Function',4,TRUE)
a<-table.row.end(a)
a<-table.row.start(a)
a<-table.element(a,'Time lag k',header=TRUE)
a<-table.element(a,hyperlink('basics.htm','ACF(k)','click here for more information about the Autocorrelation Function'),header=TRUE)
a<-table.element(a,'T-STAT',header=TRUE)
a<-table.element(a,'P-value',header=TRUE)
a<-table.row.end(a)
for (i in 2:(par1+1)) {
a<-table.row.start(a)
a<-table.element(a,i-1,header=TRUE)
a<-table.element(a,round(myacf[i],6))
mytstat <- myacf[i]*sqrtn
a<-table.element(a,round(mytstat,4))
a<-table.element(a,round(1-pt(abs(mytstat),lengthx),6))
a<-table.row.end(a)
}
a<-table.end(a)
table.save(a,file='mytable.tab')
a<-table.start()
a<-table.row.start(a)
a<-table.element(a,'Partial Autocorrelation Function',4,TRUE)
a<-table.row.end(a)
a<-table.row.start(a)
a<-table.element(a,'Time lag k',header=TRUE)
a<-table.element(a,hyperlink('basics.htm','PACF(k)','click here for more information about the Partial Autocorrelation Function'),header=TRUE)
a<-table.element(a,'T-STAT',header=TRUE)
a<-table.element(a,'P-value',header=TRUE)
a<-table.row.end(a)
for (i in 1:par1) {
a<-table.row.start(a)
a<-table.element(a,i,header=TRUE)
a<-table.element(a,round(mypacf[i],6))
mytstat <- mypacf[i]*sqrtn
a<-table.element(a,round(mytstat,4))
a<-table.element(a,round(1-pt(abs(mytstat),lengthx),6))
a<-table.row.end(a)
}
a<-table.end(a)
table.save(a,file='mytable1.tab')