Free Statistics
of Irreproducible Research!
Description of Statistical Computation | |||||||||||||||||||||||||||||||||||||||||
|---|---|---|---|---|---|---|---|---|---|---|---|---|---|---|---|---|---|---|---|---|---|---|---|---|---|---|---|---|---|---|---|---|---|---|---|---|---|---|---|---|---|
| Author's title | |||||||||||||||||||||||||||||||||||||||||
| Author | *Unverified author* | ||||||||||||||||||||||||||||||||||||||||
| R Software Module | rwasp_univariatedataseries.wasp | ||||||||||||||||||||||||||||||||||||||||
| Title produced by software | Univariate Data Series | ||||||||||||||||||||||||||||||||||||||||
| Date of computation | Sun, 04 Oct 2009 11:49:55 -0600 | ||||||||||||||||||||||||||||||||||||||||
| Cite this page as follows | Statistical Computations at FreeStatistics.org, Office for Research Development and Education, URL https://freestatistics.org/blog/index.php?v=date/2009/Oct/04/t1254678747esx1zu34aa4u5bq.htm/, Retrieved Sun, 28 Apr 2024 09:23:16 +0000 | ||||||||||||||||||||||||||||||||||||||||
| Statistical Computations at FreeStatistics.org, Office for Research Development and Education, URL https://freestatistics.org/blog/index.php?pk=43648, Retrieved Sun, 28 Apr 2024 09:23:16 +0000 | |||||||||||||||||||||||||||||||||||||||||
| QR Codes: | |||||||||||||||||||||||||||||||||||||||||
|
| |||||||||||||||||||||||||||||||||||||||||
| Original text written by user: | |||||||||||||||||||||||||||||||||||||||||
| IsPrivate? | No (this computation is public) | ||||||||||||||||||||||||||||||||||||||||
| User-defined keywords | KDGP1W1 (verbetering) | ||||||||||||||||||||||||||||||||||||||||
| Estimated Impact | 170 | ||||||||||||||||||||||||||||||||||||||||
Tree of Dependent Computations | |||||||||||||||||||||||||||||||||||||||||
| Family? (F = Feedback message, R = changed R code, M = changed R Module, P = changed Parameters, D = changed Data) | |||||||||||||||||||||||||||||||||||||||||
| - [Univariate Data Series] [Tijdreeks Koffie] [2009-09-22 09:59:11] [8c7c3dc396eba234a49aa27457495c03] - D [Univariate Data Series] [Cijferreeks Koffie] [2009-10-04 17:49:55] [c660e49618fa34ae630017997cd32f13] [Current] | |||||||||||||||||||||||||||||||||||||||||
| Feedback Forum | |||||||||||||||||||||||||||||||||||||||||
Post a new message | |||||||||||||||||||||||||||||||||||||||||
Dataset | |||||||||||||||||||||||||||||||||||||||||
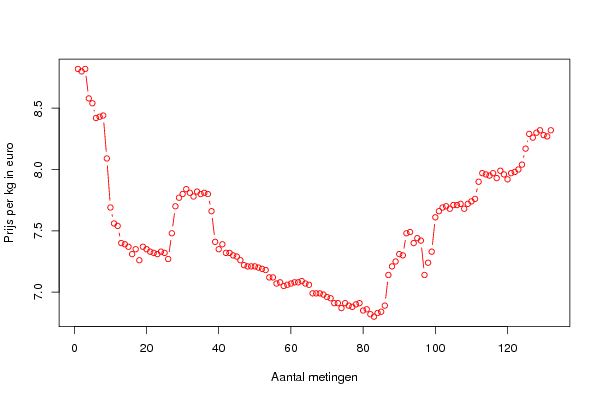
| Dataseries X: | |||||||||||||||||||||||||||||||||||||||||
8.82 8.8 8.82 8.58 8.54 8.42 8.43 8.44 8.09 7.69 7.56 7.54 7.4 7.39 7.37 7.31 7.35 7.26 7.37 7.35 7.33 7.32 7.31 7.33 7.32 7.27 7.48 7.7 7.77 7.8 7.84 7.81 7.78 7.82 7.8 7.81 7.8 7.66 7.41 7.35 7.39 7.32 7.32 7.3 7.29 7.26 7.22 7.21 7.21 7.21 7.2 7.19 7.18 7.12 7.12 7.07 7.08 7.05 7.06 7.07 7.08 7.08 7.09 7.07 7.06 6.99 6.99 6.99 6.98 6.96 6.95 6.91 6.91 6.87 6.91 6.89 6.88 6.9 6.91 6.85 6.86 6.82 6.8 6.83 6.84 6.89 7.14 7.21 7.25 7.31 7.3 7.48 7.49 7.4 7.44 7.42 7.14 7.24 7.33 7.61 7.66 7.69 7.7 7.68 7.71 7.71 7.72 7.68 7.72 7.74 7.76 7.9 7.97 7.96 7.95 7.97 7.93 7.99 7.96 7.92 7.97 7.98 8 8.04 8.17 8.29 8.26 8.3 8.32 8.28 8.27 8.32 | |||||||||||||||||||||||||||||||||||||||||
Tables (Output of Computation) | |||||||||||||||||||||||||||||||||||||||||
| |||||||||||||||||||||||||||||||||||||||||
Figures (Output of Computation) | |||||||||||||||||||||||||||||||||||||||||
Input Parameters & R Code | |||||||||||||||||||||||||||||||||||||||||
| Parameters (Session): | |||||||||||||||||||||||||||||||||||||||||
| par1 = Koffie ; par2 = Belgostat ; par3 = Tijdreeks Koffie 1998-2009 ; | |||||||||||||||||||||||||||||||||||||||||
| Parameters (R input): | |||||||||||||||||||||||||||||||||||||||||
| par1 = Koffie ; par2 = Belgostat ; par3 = Tijdreeks Koffie 1998-2009 ; | |||||||||||||||||||||||||||||||||||||||||
| R code (references can be found in the software module): | |||||||||||||||||||||||||||||||||||||||||
bitmap(file='test1.png') | |||||||||||||||||||||||||||||||||||||||||