Free Statistics

of Irreproducible Research!

Author's title

Author*Unverified author*
R Software Modulerwasp_histogram.wasp
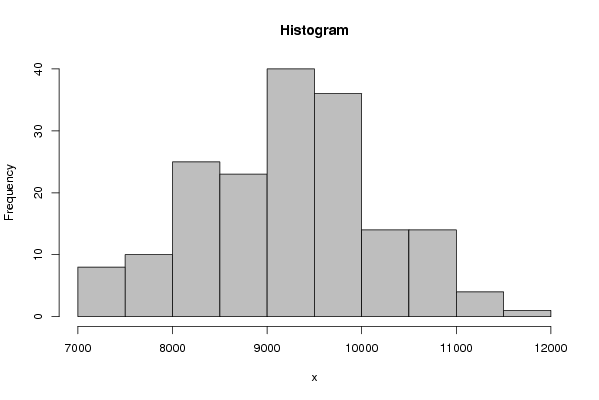
Title produced by softwareHistogram
Date of computationSun, 04 Oct 2009 13:05:20 -0600
Cite this page as followsStatistical Computations at FreeStatistics.org, Office for Research Development and Education, URL https://freestatistics.org/blog/index.php?v=date/2009/Oct/04/t12546832088cobn4x0uvx7otf.htm/, Retrieved Sun, 28 Apr 2024 11:47:40 +0000
Statistical Computations at FreeStatistics.org, Office for Research Development and Education, URL https://freestatistics.org/blog/index.php?pk=43660, Retrieved Sun, 28 Apr 2024 11:47:40 +0000
QR Codes:

Original text written by user:
IsPrivate?No (this computation is public)
User-defined keywordsKDGP1W1
Estimated Impact132
Family? (F = Feedback message, R = changed R code, M = changed R Module, P = changed Parameters, D = changed Data)
-       [Histogram] [] [2009-10-04 19:05:20] [46199ea7e385a69efb178ac615a86e3a] [Current]
Feedback Forum

Post a new message
Dataseries X:
8357
7454
8076
7248
7339
7292
7359
7537
7441
8057
8037
8257
8692
8119
8236
7432
7669
7453
7566
7731
7657
8130
8401
8737
9009
7919
8228
7903
7912
7857
7965
8091
8024
8772
8656
8953
9014
8103
8876
8231
8173
8087
8296
8007
8382
9168
9137
9321
9234
8451
9101
8279
8284
8225
8597
8305
8620
9102
9258
9652
9522
8874
9415
8525
8862
8421
8626
8750
8852
9412
9570
9513
9986
8907
9663
8799
8931
8732
8936
9127
9070
9773
9670
9929
10095
9025
9659
8954
9022
8855
9034
9196
9038
9650
9715
10052
10436
9314
9717
8997
9062
8885
9058
9095
9149
9857
9848
10269
10341
9690
10125
9349
9224
9224
9454
9347
9430
9933
10148
10677
10735
9760
10567
9333
9409
9502
9348
9319
9594
10160
10182
10810
11105
9874
10958
9311
9610
9398
9784
9425
9557
10166
10337
10770
11265
10183
10941
9628
9709
9637
9579
9741
9754
10508
10749
11079
11608
10668
10933
9703
9799
9656
9648
9712
9766
10540
10564
10911
11218
10230
10410
9227
9378
9105
9128


Summary of computational transaction
Raw Inputview raw input (R code)
Raw Outputview raw output of R engine
Computing time2 seconds
R Server'RServer@AstonUniversity' @ vre.aston.ac.uk

\begin{tabular}{lllllllll}
\hline
Summary of computational transaction \tabularnewline
Raw Input & view raw input (R code)  \tabularnewline
Raw Output & view raw output of R engine  \tabularnewline
Computing time & 2 seconds \tabularnewline
R Server & 'RServer@AstonUniversity' @ vre.aston.ac.uk \tabularnewline
\hline
\end{tabular}
%Source: https://freestatistics.org/blog/index.php?pk=43660&T=0

[TABLE]
[ROW][C]Summary of computational transaction[/C][/ROW]
[ROW][C]Raw Input[/C][C]view raw input (R code) [/C][/ROW]
[ROW][C]Raw Output[/C][C]view raw output of R engine [/C][/ROW]
[ROW][C]Computing time[/C][C]2 seconds[/C][/ROW]
[ROW][C]R Server[/C][C]'RServer@AstonUniversity' @ vre.aston.ac.uk[/C][/ROW]
[/TABLE]
Source: https://freestatistics.org/blog/index.php?pk=43660&T=0

Globally Unique Identifier (entire table): ba.freestatistics.org/blog/index.php?pk=43660&T=0

As an alternative you can also use a QR Code:  

The GUIDs for individual cells are displayed in the table below:

Summary of computational transaction
Raw Inputview raw input (R code)
Raw Outputview raw output of R engine
Computing time2 seconds
R Server'RServer@AstonUniversity' @ vre.aston.ac.uk


Frequency Table (Histogram)
BinsMidpointAbs. FrequencyRel. FrequencyCumul. Rel. Freq.Density
[7000,7500[725080.0457140.0457149.1e-05
[7500,8000[7750100.0571430.1028570.000114
[8000,8500[8250250.1428570.2457140.000286
[8500,9000[8750230.1314290.3771430.000263
[9000,9500[9250400.2285710.6057140.000457
[9500,10000[9750360.2057140.8114290.000411
[10000,10500[10250140.080.8914290.00016
[10500,11000[10750140.080.9714290.00016
[11000,11500[1125040.0228570.9942864.6e-05
[11500,12000]1175010.00571411.1e-05

\begin{tabular}{lllllllll}
\hline
Frequency Table (Histogram) \tabularnewline
Bins & Midpoint & Abs. Frequency & Rel. Frequency & Cumul. Rel. Freq. & Density \tabularnewline
[7000,7500[ & 7250 & 8 & 0.045714 & 0.045714 & 9.1e-05 \tabularnewline
[7500,8000[ & 7750 & 10 & 0.057143 & 0.102857 & 0.000114 \tabularnewline
[8000,8500[ & 8250 & 25 & 0.142857 & 0.245714 & 0.000286 \tabularnewline
[8500,9000[ & 8750 & 23 & 0.131429 & 0.377143 & 0.000263 \tabularnewline
[9000,9500[ & 9250 & 40 & 0.228571 & 0.605714 & 0.000457 \tabularnewline
[9500,10000[ & 9750 & 36 & 0.205714 & 0.811429 & 0.000411 \tabularnewline
[10000,10500[ & 10250 & 14 & 0.08 & 0.891429 & 0.00016 \tabularnewline
[10500,11000[ & 10750 & 14 & 0.08 & 0.971429 & 0.00016 \tabularnewline
[11000,11500[ & 11250 & 4 & 0.022857 & 0.994286 & 4.6e-05 \tabularnewline
[11500,12000] & 11750 & 1 & 0.005714 & 1 & 1.1e-05 \tabularnewline
\hline
\end{tabular}
%Source: https://freestatistics.org/blog/index.php?pk=43660&T=1

[TABLE]
[ROW][C]Frequency Table (Histogram)[/C][/ROW]
[ROW][C]Bins[/C][C]Midpoint[/C][C]Abs. Frequency[/C][C]Rel. Frequency[/C][C]Cumul. Rel. Freq.[/C][C]Density[/C][/ROW]
[ROW][C][7000,7500[[/C][C]7250[/C][C]8[/C][C]0.045714[/C][C]0.045714[/C][C]9.1e-05[/C][/ROW]
[ROW][C][7500,8000[[/C][C]7750[/C][C]10[/C][C]0.057143[/C][C]0.102857[/C][C]0.000114[/C][/ROW]
[ROW][C][8000,8500[[/C][C]8250[/C][C]25[/C][C]0.142857[/C][C]0.245714[/C][C]0.000286[/C][/ROW]
[ROW][C][8500,9000[[/C][C]8750[/C][C]23[/C][C]0.131429[/C][C]0.377143[/C][C]0.000263[/C][/ROW]
[ROW][C][9000,9500[[/C][C]9250[/C][C]40[/C][C]0.228571[/C][C]0.605714[/C][C]0.000457[/C][/ROW]
[ROW][C][9500,10000[[/C][C]9750[/C][C]36[/C][C]0.205714[/C][C]0.811429[/C][C]0.000411[/C][/ROW]
[ROW][C][10000,10500[[/C][C]10250[/C][C]14[/C][C]0.08[/C][C]0.891429[/C][C]0.00016[/C][/ROW]
[ROW][C][10500,11000[[/C][C]10750[/C][C]14[/C][C]0.08[/C][C]0.971429[/C][C]0.00016[/C][/ROW]
[ROW][C][11000,11500[[/C][C]11250[/C][C]4[/C][C]0.022857[/C][C]0.994286[/C][C]4.6e-05[/C][/ROW]
[ROW][C][11500,12000][/C][C]11750[/C][C]1[/C][C]0.005714[/C][C]1[/C][C]1.1e-05[/C][/ROW]
[/TABLE]
Source: https://freestatistics.org/blog/index.php?pk=43660&T=1

Globally Unique Identifier (entire table): ba.freestatistics.org/blog/index.php?pk=43660&T=1

As an alternative you can also use a QR Code:  

The GUIDs for individual cells are displayed in the table below:

Frequency Table (Histogram)
BinsMidpointAbs. FrequencyRel. FrequencyCumul. Rel. Freq.Density
[7000,7500[725080.0457140.0457149.1e-05
[7500,8000[7750100.0571430.1028570.000114
[8000,8500[8250250.1428570.2457140.000286
[8500,9000[8750230.1314290.3771430.000263
[9000,9500[9250400.2285710.6057140.000457
[9500,10000[9750360.2057140.8114290.000411
[10000,10500[10250140.080.8914290.00016
[10500,11000[10750140.080.9714290.00016
[11000,11500[1125040.0228570.9942864.6e-05
[11500,12000]1175010.00571411.1e-05


Parameters (Session):
par2 = grey ; par3 = FALSE ; par4 = Unknown ;
Parameters (R input):
par1 = ; par2 = grey ; par3 = FALSE ; par4 = Unknown ;
R code (references can be found in the software module):
par1 <- as.numeric(par1)
if (par3 == 'TRUE') par3 <- TRUE
if (par3 == 'FALSE') par3 <- FALSE
if (par4 == 'Unknown') par1 <- as.numeric(par1)
if (par4 == 'Interval/Ratio') par1 <- as.numeric(par1)
if (par4 == '3-point Likert') par1 <- c(1:3 - 0.5, 3.5)
if (par4 == '4-point Likert') par1 <- c(1:4 - 0.5, 4.5)
if (par4 == '5-point Likert') par1 <- c(1:5 - 0.5, 5.5)
if (par4 == '6-point Likert') par1 <- c(1:6 - 0.5, 6.5)
if (par4 == '7-point Likert') par1 <- c(1:7 - 0.5, 7.5)
if (par4 == '8-point Likert') par1 <- c(1:8 - 0.5, 8.5)
if (par4 == '9-point Likert') par1 <- c(1:9 - 0.5, 9.5)
if (par4 == '10-point Likert') par1 <- c(1:10 - 0.5, 10.5)
bitmap(file='test1.png')
if (is.na(par1)) {
myhist<-hist(x,col=par2,main=main,xlab=xlab,right=par3)
} else {
if (par1 < 0) par1 <- 3
if (par1 > 50) par1 <- 50
myhist<-hist(x,breaks=par1,col=par2,main=main,xlab=xlab,right=par3)
}
dev.off()
myhist
n <- length(x)
load(file='createtable')
a<-table.start()
a<-table.row.start(a)
a<-table.element(a,hyperlink('histogram.htm','Frequency Table (Histogram)',''),6,TRUE)
a<-table.row.end(a)
a<-table.row.start(a)
a<-table.element(a,'Bins',header=TRUE)
a<-table.element(a,'Midpoint',header=TRUE)
a<-table.element(a,'Abs. Frequency',header=TRUE)
a<-table.element(a,'Rel. Frequency',header=TRUE)
a<-table.element(a,'Cumul. Rel. Freq.',header=TRUE)
a<-table.element(a,'Density',header=TRUE)
a<-table.row.end(a)
crf <- 0
if (par3 == FALSE) mybracket <- '[' else mybracket <- ']'
mynumrows <- (length(myhist$breaks)-1)
for (i in 1:mynumrows) {
a<-table.row.start(a)
if (i == 1)
dum <- paste('[',myhist$breaks[i],sep='')
else
dum <- paste(mybracket,myhist$breaks[i],sep='')
dum <- paste(dum,myhist$breaks[i+1],sep=',')
if (i==mynumrows)
dum <- paste(dum,']',sep='')
else
dum <- paste(dum,mybracket,sep='')
a<-table.element(a,dum,header=TRUE)
a<-table.element(a,myhist$mids[i])
a<-table.element(a,myhist$counts[i])
rf <- myhist$counts[i]/n
crf <- crf + rf
a<-table.element(a,round(rf,6))
a<-table.element(a,round(crf,6))
a<-table.element(a,round(myhist$density[i],6))
a<-table.row.end(a)
}
a<-table.end(a)
table.save(a,file='mytable.tab')