Free Statistics
of Irreproducible Research!
Description of Statistical Computation | |||||||||||||||||||||||||||||||||||||||||
|---|---|---|---|---|---|---|---|---|---|---|---|---|---|---|---|---|---|---|---|---|---|---|---|---|---|---|---|---|---|---|---|---|---|---|---|---|---|---|---|---|---|
| Author's title | |||||||||||||||||||||||||||||||||||||||||
| Author | *The author of this computation has been verified* | ||||||||||||||||||||||||||||||||||||||||
| R Software Module | rwasp_univariatedataseries.wasp | ||||||||||||||||||||||||||||||||||||||||
| Title produced by software | Univariate Data Series | ||||||||||||||||||||||||||||||||||||||||
| Date of computation | Sun, 11 Oct 2009 14:27:40 -0600 | ||||||||||||||||||||||||||||||||||||||||
| Cite this page as follows | Statistical Computations at FreeStatistics.org, Office for Research Development and Education, URL https://freestatistics.org/blog/index.php?v=date/2009/Oct/11/t1255292945c5xfc5pmr5ptlci.htm/, Retrieved Sat, 04 May 2024 21:26:12 +0000 | ||||||||||||||||||||||||||||||||||||||||
| Statistical Computations at FreeStatistics.org, Office for Research Development and Education, URL https://freestatistics.org/blog/index.php?pk=45398, Retrieved Sat, 04 May 2024 21:26:12 +0000 | |||||||||||||||||||||||||||||||||||||||||
| QR Codes: | |||||||||||||||||||||||||||||||||||||||||
|
| |||||||||||||||||||||||||||||||||||||||||
| Original text written by user: | |||||||||||||||||||||||||||||||||||||||||
| IsPrivate? | No (this computation is public) | ||||||||||||||||||||||||||||||||||||||||
| User-defined keywords | KVN WS2 | ||||||||||||||||||||||||||||||||||||||||
| Estimated Impact | 173 | ||||||||||||||||||||||||||||||||||||||||
Tree of Dependent Computations | |||||||||||||||||||||||||||||||||||||||||
| Family? (F = Feedback message, R = changed R code, M = changed R Module, P = changed Parameters, D = changed Data) | |||||||||||||||||||||||||||||||||||||||||
| F [Univariate Data Series] [WS2_Tijdreeksen_C...] [2009-10-11 20:27:40] [f1100e00818182135823a11ccbd0f3b9] [Current] - M D [Univariate Data Series] [Geboortes Run Seq...] [2009-11-19 15:19:22] [1b4c3bbe3f2ba180dd536c5a6a81a8e6] - P [Univariate Data Series] [Univariate data s...] [2009-12-11 12:33:23] [1b4c3bbe3f2ba180dd536c5a6a81a8e6] - MPD [Univariate Data Series] [Huwelijken Run Se...] [2009-11-19 15:27:17] [1b4c3bbe3f2ba180dd536c5a6a81a8e6] - P [Univariate Data Series] [Univariate data s...] [2009-12-11 12:37:51] [1b4c3bbe3f2ba180dd536c5a6a81a8e6] - PD [Univariate Data Series] [Y Geboortes 2002-...] [2009-12-15 20:58:08] [1b4c3bbe3f2ba180dd536c5a6a81a8e6] - PD [Univariate Data Series] [Univariate data -...] [2010-11-28 09:57:44] [6f0e7a2d1a07390e3505a2db8288f975] - R [Univariate Data Series] [Paper - Endogene ...] [2010-12-01 15:56:05] [6f0e7a2d1a07390e3505a2db8288f975] - RMPD [Univariate Explorative Data Analysis] [Univariate EDA Y ...] [2009-12-15 21:04:31] [1b4c3bbe3f2ba180dd536c5a6a81a8e6] - PD [Univariate Data Series] [Univariate data s...] [2009-12-18 11:37:57] [1b4c3bbe3f2ba180dd536c5a6a81a8e6] - PD [Univariate Data Series] [Univariate data -...] [2010-11-28 10:05:01] [6f0e7a2d1a07390e3505a2db8288f975] - PD [Univariate Data Series] [Univariate data -...] [2010-11-28 10:05:01] [6f0e7a2d1a07390e3505a2db8288f975] - MPD [Univariate Data Series] [Werkloosheidsgraa...] [2009-11-19 15:49:08] [1b4c3bbe3f2ba180dd536c5a6a81a8e6] | |||||||||||||||||||||||||||||||||||||||||
| Feedback Forum | |||||||||||||||||||||||||||||||||||||||||
Post a new message | |||||||||||||||||||||||||||||||||||||||||
Dataset | |||||||||||||||||||||||||||||||||||||||||
| Dataseries X: | |||||||||||||||||||||||||||||||||||||||||
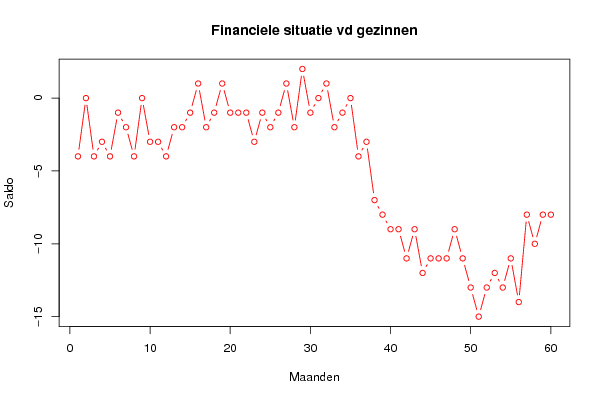
-4 0 -4 -3 -4 -1 -2 -4 0 -3 -3 -4 -2 -2 -1 1 -2 -1 1 -1 -1 -1 -3 -1 -2 -1 1 -2 2 -1 0 1 -2 -1 0 -4 -3 -7 -8 -9 -9 -11 -9 -12 -11 -11 -11 -9 -11 -13 -15 -13 -12 -13 -11 -14 -8 -10 -8 -8 | |||||||||||||||||||||||||||||||||||||||||
Tables (Output of Computation) | |||||||||||||||||||||||||||||||||||||||||
| |||||||||||||||||||||||||||||||||||||||||
Figures (Output of Computation) | |||||||||||||||||||||||||||||||||||||||||
Input Parameters & R Code | |||||||||||||||||||||||||||||||||||||||||
| Parameters (Session): | |||||||||||||||||||||||||||||||||||||||||
| par1 = Indicators Consumentenvertrouwen ; par2 = Belgostat ; par3 = Financi�le situatie van de gezinnen ; | |||||||||||||||||||||||||||||||||||||||||
| Parameters (R input): | |||||||||||||||||||||||||||||||||||||||||
| par1 = Indicators Consumentenvertrouwen ; par2 = Belgostat ; par3 = Financi�le situatie van de gezinnen ; | |||||||||||||||||||||||||||||||||||||||||
| R code (references can be found in the software module): | |||||||||||||||||||||||||||||||||||||||||
bitmap(file='test1.png') | |||||||||||||||||||||||||||||||||||||||||