Free Statistics
of Irreproducible Research!
Description of Statistical Computation | |||||||||||||||||||||||||||||||||||||||||
|---|---|---|---|---|---|---|---|---|---|---|---|---|---|---|---|---|---|---|---|---|---|---|---|---|---|---|---|---|---|---|---|---|---|---|---|---|---|---|---|---|---|
| Author's title | |||||||||||||||||||||||||||||||||||||||||
| Author | *The author of this computation has been verified* | ||||||||||||||||||||||||||||||||||||||||
| R Software Module | rwasp_univariatedataseries.wasp | ||||||||||||||||||||||||||||||||||||||||
| Title produced by software | Univariate Data Series | ||||||||||||||||||||||||||||||||||||||||
| Date of computation | Mon, 12 Oct 2009 16:14:27 -0600 | ||||||||||||||||||||||||||||||||||||||||
| Cite this page as follows | Statistical Computations at FreeStatistics.org, Office for Research Development and Education, URL https://freestatistics.org/blog/index.php?v=date/2009/Oct/13/t1255385862cvxs9d0x4zexyja.htm/, Retrieved Sat, 27 Apr 2024 08:26:37 +0000 | ||||||||||||||||||||||||||||||||||||||||
| Statistical Computations at FreeStatistics.org, Office for Research Development and Education, URL https://freestatistics.org/blog/index.php?pk=46086, Retrieved Sat, 27 Apr 2024 08:26:37 +0000 | |||||||||||||||||||||||||||||||||||||||||
| QR Codes: | |||||||||||||||||||||||||||||||||||||||||
|
| |||||||||||||||||||||||||||||||||||||||||
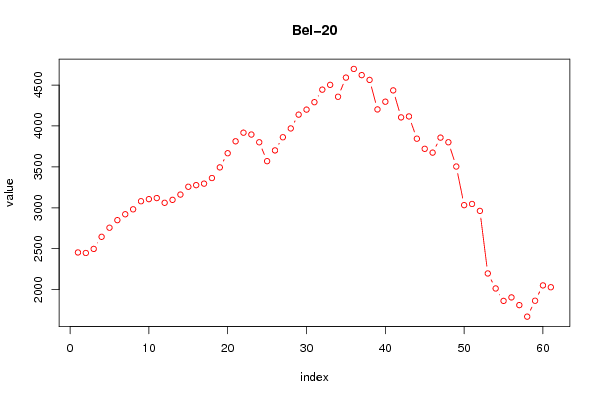
| Original text written by user: | Maandelijks overzicht van de aandelenmarkt voor de periode 06-2004 tot 06-2009 | ||||||||||||||||||||||||||||||||||||||||
| IsPrivate? | No (this computation is public) | ||||||||||||||||||||||||||||||||||||||||
| User-defined keywords | Aandelenmarkt Bel-20 06-2004 // 06-2009 | ||||||||||||||||||||||||||||||||||||||||
| Estimated Impact | 192 | ||||||||||||||||||||||||||||||||||||||||
Tree of Dependent Computations | |||||||||||||||||||||||||||||||||||||||||
| Family? (F = Feedback message, R = changed R code, M = changed R Module, P = changed Parameters, D = changed Data) | |||||||||||||||||||||||||||||||||||||||||
| - [Exercise 1.13] [Ex. 1.13 Babies c...] [2009-10-07 19:52:56] [62d80b0d35658f72f0b015f194fffbd1] - P [Exercise 1.13] [Ex. 1.13 Babies c...] [2009-10-07 20:14:54] [62d80b0d35658f72f0b015f194fffbd1] - R [Exercise 1.13] [Ex. 1.13 Babies c...] [2009-10-07 20:34:03] [62d80b0d35658f72f0b015f194fffbd1] F RMPD [Univariate Data Series] [3e grafiek] [2009-10-12 22:14:27] [2f1ac16c1440fb5aa417f0550c73728d] [Current] - PD [Univariate Data Series] [Y[t] - X[t] = c +...] [2009-10-20 19:10:29] [df1349bc077b4746949c1672214183f7] - PD [Univariate Data Series] [Y[t] / X[t] = c +...] [2009-10-20 19:15:17] [df1349bc077b4746949c1672214183f7] - RM D [Central Tendency] [Central Tendency ...] [2009-10-20 19:21:07] [df1349bc077b4746949c1672214183f7] - RM [Harrell-Davis Quantiles] [Harrel Davis 95% ...] [2009-10-20 19:29:53] [df1349bc077b4746949c1672214183f7] - RM [Percentiles] [Percentiles 80% P...] [2009-10-20 19:34:55] [df1349bc077b4746949c1672214183f7] - PD [Central Tendency] [workshop 3 part 3] [2009-10-21 17:22:50] [af8eb90b4bf1bcfcc4325c143dbee260] | |||||||||||||||||||||||||||||||||||||||||
| Feedback Forum | |||||||||||||||||||||||||||||||||||||||||
Post a new message | |||||||||||||||||||||||||||||||||||||||||
Dataset | |||||||||||||||||||||||||||||||||||||||||
| Dataseries X: | |||||||||||||||||||||||||||||||||||||||||
2454.62 2448.05 2497.84 2645.64 2756.76 2849.27 2921.44 2981.85 3080.58 3106.22 3119.31 3061.26 3097.31 3161.69 3257.16 3277.01 3295.32 3363.99 3494.17 3667.03 3813.06 3917.96 3895.51 3801.06 3570.12 3701.61 3862.27 3970.1 4138.52 4199.75 4290.89 4443.91 4502.64 4356.98 4591.27 4696.96 4621.4 4562.84 4202.52 4296.49 4435.23 4105.18 4116.68 3844.49 3720.98 3674.4 3857.62 3801.06 3504.37 3032.6 3047.03 2962.34 2197.82 2014.45 1862.83 1905.41 1810.99 1670.07 1864.44 2052.02 2029.6 | |||||||||||||||||||||||||||||||||||||||||
Tables (Output of Computation) | |||||||||||||||||||||||||||||||||||||||||
| |||||||||||||||||||||||||||||||||||||||||
Figures (Output of Computation) | |||||||||||||||||||||||||||||||||||||||||
Input Parameters & R Code | |||||||||||||||||||||||||||||||||||||||||
| Parameters (Session): | |||||||||||||||||||||||||||||||||||||||||
| par1 = Aandelenmarkt BEL-20, maandelijks ; par2 = Belgostat - Aandelen en grondstoffenmarkt ; par3 = BEL-20 voor een periode tussen 06-2004 // 06-2009 ; | |||||||||||||||||||||||||||||||||||||||||
| Parameters (R input): | |||||||||||||||||||||||||||||||||||||||||
| par1 = Aandelenmarkt BEL-20, maandelijks ; par2 = Belgostat - Aandelen en grondstoffenmarkt ; par3 = BEL-20 voor een periode tussen 06-2004 // 06-2009 ; | |||||||||||||||||||||||||||||||||||||||||
| R code (references can be found in the software module): | |||||||||||||||||||||||||||||||||||||||||
bitmap(file='test1.png') | |||||||||||||||||||||||||||||||||||||||||