Free Statistics
of Irreproducible Research!
Description of Statistical Computation | |||||||||||||||||||||||||||||||||||||||||
|---|---|---|---|---|---|---|---|---|---|---|---|---|---|---|---|---|---|---|---|---|---|---|---|---|---|---|---|---|---|---|---|---|---|---|---|---|---|---|---|---|---|
| Author's title | |||||||||||||||||||||||||||||||||||||||||
| Author | *The author of this computation has been verified* | ||||||||||||||||||||||||||||||||||||||||
| R Software Module | rwasp_univariatedataseries.wasp | ||||||||||||||||||||||||||||||||||||||||
| Title produced by software | Univariate Data Series | ||||||||||||||||||||||||||||||||||||||||
| Date of computation | Mon, 12 Oct 2009 16:23:40 -0600 | ||||||||||||||||||||||||||||||||||||||||
| Cite this page as follows | Statistical Computations at FreeStatistics.org, Office for Research Development and Education, URL https://freestatistics.org/blog/index.php?v=date/2009/Oct/13/t1255386432xzjmn8l9zi7zpie.htm/, Retrieved Sat, 27 Apr 2024 10:23:06 +0000 | ||||||||||||||||||||||||||||||||||||||||
| Statistical Computations at FreeStatistics.org, Office for Research Development and Education, URL https://freestatistics.org/blog/index.php?pk=46090, Retrieved Sat, 27 Apr 2024 10:23:06 +0000 | |||||||||||||||||||||||||||||||||||||||||
| QR Codes: | |||||||||||||||||||||||||||||||||||||||||
|
| |||||||||||||||||||||||||||||||||||||||||
| Original text written by user: | |||||||||||||||||||||||||||||||||||||||||
| IsPrivate? | No (this computation is public) | ||||||||||||||||||||||||||||||||||||||||
| User-defined keywords | SHWWS2V1.2 | ||||||||||||||||||||||||||||||||||||||||
| Estimated Impact | 135 | ||||||||||||||||||||||||||||||||||||||||
Tree of Dependent Computations | |||||||||||||||||||||||||||||||||||||||||
| Family? (F = Feedback message, R = changed R code, M = changed R Module, P = changed Parameters, D = changed Data) | |||||||||||||||||||||||||||||||||||||||||
| - [Univariate Data Series] [] [2009-10-12 22:23:40] [71596e6a53ccce532e52aaf6113616ef] [Current] | |||||||||||||||||||||||||||||||||||||||||
| Feedback Forum | |||||||||||||||||||||||||||||||||||||||||
Post a new message | |||||||||||||||||||||||||||||||||||||||||
Dataset | |||||||||||||||||||||||||||||||||||||||||
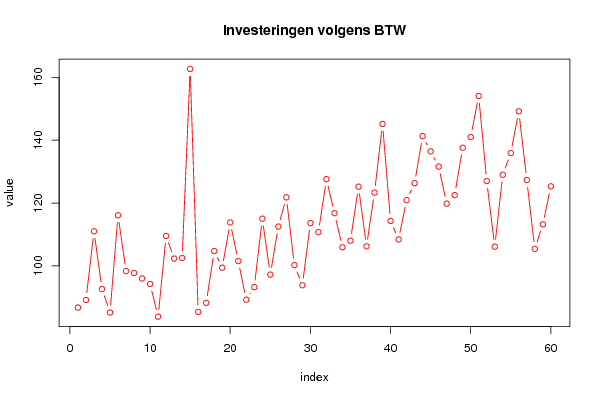
| Dataseries X: | |||||||||||||||||||||||||||||||||||||||||
86,7 89,1 111 92,6 85,1 116,1 98,3 97,7 95,95 94,2 83,8 109,5 102,3 102,5 162,7 85,3 88,2 104,7 99,4 113,8 101,5 89,2 93,2 115 97,2 112,5 121,8 100,2 93,8 113,6 110,7 127,6 116,75 105,9 108 125,2 106,2 123,3 145,2 114,3 108,4 120,9 126,3 141,3 136,45 131,6 119,8 122,5 137,6 141 154,1 127 106,1 129 135,9 149,2 127,3 105,4 113,2 125,3 | |||||||||||||||||||||||||||||||||||||||||
Tables (Output of Computation) | |||||||||||||||||||||||||||||||||||||||||
| |||||||||||||||||||||||||||||||||||||||||
Figures (Output of Computation) | |||||||||||||||||||||||||||||||||||||||||
Input Parameters & R Code | |||||||||||||||||||||||||||||||||||||||||
| Parameters (Session): | |||||||||||||||||||||||||||||||||||||||||
| par1 = Investeringen volgens BTW ; par2 = http://www.nbb.be/belgostat/PresentationLinker?TableId=483000052&Lang=N ; par3 = Investeringen volgens BTW van alle aangevers (indexcijfers 2000=100) - 03/2004 - 03/2009 - Pieken op 31/20XX weggewerkt adhv het gemiddelde van vorige en volgende maand ; | |||||||||||||||||||||||||||||||||||||||||
| Parameters (R input): | |||||||||||||||||||||||||||||||||||||||||
| par1 = Investeringen volgens BTW ; par2 = http://www.nbb.be/belgostat/PresentationLinker?TableId=483000052&Lang=N ; par3 = Investeringen volgens BTW van alle aangevers (indexcijfers 2000=100) - 03/2004 - 03/2009 - Pieken op 31/20XX weggewerkt adhv het gemiddelde van vorige en volgende maand ; | |||||||||||||||||||||||||||||||||||||||||
| R code (references can be found in the software module): | |||||||||||||||||||||||||||||||||||||||||
bitmap(file='test1.png') | |||||||||||||||||||||||||||||||||||||||||