Free Statistics
of Irreproducible Research!
Description of Statistical Computation | |||||||||||||||||||||||||||||||||||||||||
|---|---|---|---|---|---|---|---|---|---|---|---|---|---|---|---|---|---|---|---|---|---|---|---|---|---|---|---|---|---|---|---|---|---|---|---|---|---|---|---|---|---|
| Author's title | |||||||||||||||||||||||||||||||||||||||||
| Author | *The author of this computation has been verified* | ||||||||||||||||||||||||||||||||||||||||
| R Software Module | rwasp_univariatedataseries.wasp | ||||||||||||||||||||||||||||||||||||||||
| Title produced by software | Univariate Data Series | ||||||||||||||||||||||||||||||||||||||||
| Date of computation | Mon, 12 Oct 2009 19:35:54 -0600 | ||||||||||||||||||||||||||||||||||||||||
| Cite this page as follows | Statistical Computations at FreeStatistics.org, Office for Research Development and Education, URL https://freestatistics.org/blog/index.php?v=date/2009/Oct/13/t12553992158cj9eq3lkg8h1tx.htm/, Retrieved Sat, 27 Apr 2024 07:43:09 +0000 | ||||||||||||||||||||||||||||||||||||||||
| Statistical Computations at FreeStatistics.org, Office for Research Development and Education, URL https://freestatistics.org/blog/index.php?pk=46117, Retrieved Sat, 27 Apr 2024 07:43:09 +0000 | |||||||||||||||||||||||||||||||||||||||||
| QR Codes: | |||||||||||||||||||||||||||||||||||||||||
|
| |||||||||||||||||||||||||||||||||||||||||
| Original text written by user: | |||||||||||||||||||||||||||||||||||||||||
| IsPrivate? | No (this computation is public) | ||||||||||||||||||||||||||||||||||||||||
| User-defined keywords | van 09-1999 tot 06-2009!!!! | ||||||||||||||||||||||||||||||||||||||||
| Estimated Impact | 157 | ||||||||||||||||||||||||||||||||||||||||
Tree of Dependent Computations | |||||||||||||||||||||||||||||||||||||||||
| Family? (F = Feedback message, R = changed R code, M = changed R Module, P = changed Parameters, D = changed Data) | |||||||||||||||||||||||||||||||||||||||||
| - [Univariate Data Series] [De Belgische uitv...] [2009-10-13 01:35:54] [0cc924834281808eda7297686c82928f] [Current] F PD [Univariate Data Series] [Belgische uitvoer...] [2009-10-13 07:43:28] [74be16979710d4c4e7c6647856088456] - P [Univariate Data Series] [Belgische export ...] [2009-10-20 20:53:52] [df6326eec97a6ca984a853b142930499] - P [Univariate Data Series] [Belgische uitvoer...] [2009-10-20 20:59:23] [df6326eec97a6ca984a853b142930499] F MP [Univariate Data Series] [Belgische export ...] [2009-11-02 11:26:43] [df6326eec97a6ca984a853b142930499] - RMPD [Trivariate Scatterplots] [WS4-Trivariate Sc...] [2009-11-02 11:33:01] [df6326eec97a6ca984a853b142930499] - RMPD [Partial Correlation] [WS4-Partial Corre...] [2009-11-02 11:45:51] [df6326eec97a6ca984a853b142930499] - RMPD [Univariate Data Series] [ws8] [2009-11-27 12:04:12] [acdebb2ecda2ddb208f4e14f4a68b9e7] - PD [Univariate Data Series] [nieuw ingeschreve...] [2009-12-03 15:53:26] [acdebb2ecda2ddb208f4e14f4a68b9e7] - PD [Univariate Data Series] [consumptiekrediet] [2009-12-04 10:09:44] [acdebb2ecda2ddb208f4e14f4a68b9e7] - PD [Univariate Data Series] [Verkoopprijzen pe...] [2009-12-20 18:48:32] [acdebb2ecda2ddb208f4e14f4a68b9e7] - PD [Univariate Data Series] [Verkoopprijs per ...] [2009-12-20 19:05:51] [acdebb2ecda2ddb208f4e14f4a68b9e7] - PD [Univariate Data Series] [Aantal ton ge�mpo...] [2009-12-30 10:29:06] [acdebb2ecda2ddb208f4e14f4a68b9e7] - PD [Univariate Data Series] [Verkoopprijzen va...] [2009-12-30 11:02:17] [acdebb2ecda2ddb208f4e14f4a68b9e7] - RMPD [Standard Deviation-Mean Plot] [] [2009-12-30 11:32:10] [acdebb2ecda2ddb208f4e14f4a68b9e7] - RMPD [Standard Deviation-Mean Plot] [Standard deviatio...] [2009-12-30 11:43:59] [acdebb2ecda2ddb208f4e14f4a68b9e7] - RMPD [Variance Reduction Matrix] [Variance reductio...] [2009-12-30 11:52:14] [acdebb2ecda2ddb208f4e14f4a68b9e7] - RMPD [Variance Reduction Matrix] [Variance reductio...] [2009-12-30 12:31:26] [acdebb2ecda2ddb208f4e14f4a68b9e7] - RMPD [(Partial) Autocorrelation Function] [Autocorrelatiefun...] [2009-12-30 13:05:14] [acdebb2ecda2ddb208f4e14f4a68b9e7] - RMPD [(Partial) Autocorrelation Function] [Autocorrelatiefun...] [2009-12-30 13:18:23] [acdebb2ecda2ddb208f4e14f4a68b9e7] - RMPD [(Partial) Autocorrelation Function] [autocorrelatiefun...] [2009-12-30 13:39:49] [acdebb2ecda2ddb208f4e14f4a68b9e7] - RMPD [(Partial) Autocorrelation Function] [Autocorrelatiefun...] [2009-12-30 13:42:19] [acdebb2ecda2ddb208f4e14f4a68b9e7] - P [(Partial) Autocorrelation Function] [Autocorrelatiefun...] [2009-12-31 10:14:57] [acdebb2ecda2ddb208f4e14f4a68b9e7] - RMPD [(Partial) Autocorrelation Function] [Autocorrelatiefun...] [2009-12-30 13:48:46] [acdebb2ecda2ddb208f4e14f4a68b9e7] - RMPD [(Partial) Autocorrelation Function] [Autocorrelatie me...] [2009-12-30 13:51:16] [acdebb2ecda2ddb208f4e14f4a68b9e7] - RMPD [Spectral Analysis] [Spectrum analyse ...] [2009-12-30 14:05:13] [acdebb2ecda2ddb208f4e14f4a68b9e7] - RMPD [Spectral Analysis] [Spectrum analyse ...] [2009-12-30 14:40:35] [acdebb2ecda2ddb208f4e14f4a68b9e7] - RMPD [Spectral Analysis] [spectrumanalyse z...] [2009-12-30 15:30:46] [acdebb2ecda2ddb208f4e14f4a68b9e7] - RMPD [Spectral Analysis] [Spectrum analyse ...] [2009-12-30 17:20:15] [acdebb2ecda2ddb208f4e14f4a68b9e7] - RMPD [Spectral Analysis] [Spectrum analyse ...] [2009-12-30 17:26:08] [acdebb2ecda2ddb208f4e14f4a68b9e7] - PD [Univariate Data Series] [Aantal ton geslac...] [2009-12-20 19:14:58] [acdebb2ecda2ddb208f4e14f4a68b9e7] | |||||||||||||||||||||||||||||||||||||||||
| Feedback Forum | |||||||||||||||||||||||||||||||||||||||||
Post a new message | |||||||||||||||||||||||||||||||||||||||||
Dataset | |||||||||||||||||||||||||||||||||||||||||
| Dataseries X: | |||||||||||||||||||||||||||||||||||||||||
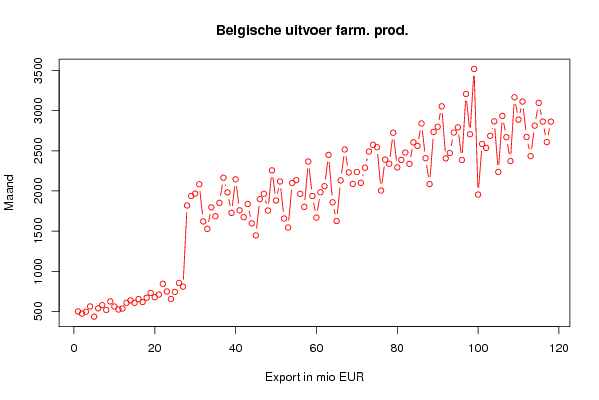
500 472.6 496.1 562 434.8 538.2 577.6 518.1 625.2 561.2 523.3 536.1 607.3 637.3 606.9 652.9 617.2 670.4 729.9 677.2 710 844.3 748.2 653.9 742.6 854.2 808.4 1819 1936.5 1966.1 2083.1 1620.1 1527.6 1795 1685.1 1851.8 2164.4 1981.8 1726.5 2144.6 1758.2 1672.9 1837.3 1596.1 1446 1898.4 1964.1 1755.9 2255.3 1881.2 2117.9 1656.5 1544.1 2098.9 2133.3 1963.5 1801.2 2365.4 1936.5 1667.6 1983.5 2058.6 2448.3 1858.1 1625.4 2130.6 2515.7 2230.2 2086.9 2235 2100.2 2288.6 2490 2573.7 2543.8 2004.7 2390 2338.4 2724.5 2292.5 2386 2477.9 2337 2605.1 2560.8 2839.3 2407.2 2085.2 2735.6 2798.7 3053.2 2405 2471.9 2727.3 2790.7 2385.4 3206.6 2705.6 3518.4 1954.9 2584.3 2535.8 2685.9 2866 2236.6 2934.9 2668.6 2371.2 3165.9 2887.2 3112.2 2671.2 2432.6 2812.3 3095.7 2862.9 2607.3 2862.5 | |||||||||||||||||||||||||||||||||||||||||
Tables (Output of Computation) | |||||||||||||||||||||||||||||||||||||||||
| |||||||||||||||||||||||||||||||||||||||||
Figures (Output of Computation) | |||||||||||||||||||||||||||||||||||||||||
Input Parameters & R Code | |||||||||||||||||||||||||||||||||||||||||
| Parameters (Session): | |||||||||||||||||||||||||||||||||||||||||
| par1 = Belgische uitvoer volgens het Geharmoniseerd Systeem: chemie, plastiek, hout en textiel (waarde) - Producten van de chemische en van de aanverwante industrie�n - Farmaceutische producten ; par2 = Belgostat ; par3 = De Belgische uitvoer van Farmaceutische producten van 09-1999 tot en met 09-2009 ; | |||||||||||||||||||||||||||||||||||||||||
| Parameters (R input): | |||||||||||||||||||||||||||||||||||||||||
| par1 = Belgische uitvoer volgens het Geharmoniseerd Systeem: chemie, plastiek, hout en textiel (waarde) - Producten van de chemische en van de aanverwante industrie�n - Farmaceutische producten ; par2 = Belgostat ; par3 = De Belgische uitvoer van Farmaceutische producten van 09-1999 tot en met 09-2009 ; | |||||||||||||||||||||||||||||||||||||||||
| R code (references can be found in the software module): | |||||||||||||||||||||||||||||||||||||||||
bitmap(file='test1.png') | |||||||||||||||||||||||||||||||||||||||||