Free Statistics
of Irreproducible Research!
Description of Statistical Computation | |||||||||||||||||||||||||||||||||||||||||
|---|---|---|---|---|---|---|---|---|---|---|---|---|---|---|---|---|---|---|---|---|---|---|---|---|---|---|---|---|---|---|---|---|---|---|---|---|---|---|---|---|---|
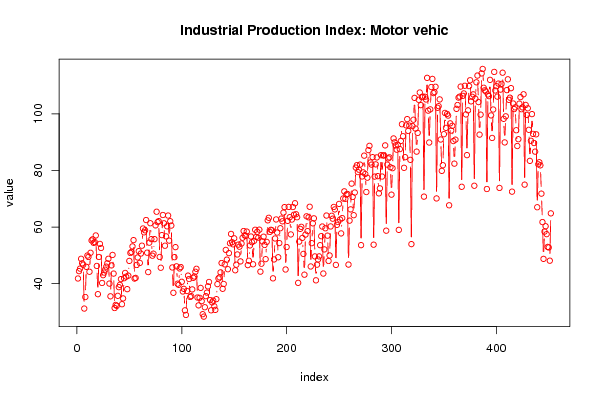
| Author's title | Industrial Production Index: Motor vehicles and parts NAICS=3361-3; 2002=10... | ||||||||||||||||||||||||||||||||||||||||
| Author | *The author of this computation has been verified* | ||||||||||||||||||||||||||||||||||||||||
| R Software Module | rwasp_univariatedataseries.wasp | ||||||||||||||||||||||||||||||||||||||||
| Title produced by software | Univariate Data Series | ||||||||||||||||||||||||||||||||||||||||
| Date of computation | Tue, 13 Oct 2009 13:14:28 -0600 | ||||||||||||||||||||||||||||||||||||||||
| Cite this page as follows | Statistical Computations at FreeStatistics.org, Office for Research Development and Education, URL https://freestatistics.org/blog/index.php?v=date/2009/Oct/13/t12554613289zh46r4jrfq0kfi.htm/, Retrieved Sat, 27 Apr 2024 11:49:12 +0000 | ||||||||||||||||||||||||||||||||||||||||
| Statistical Computations at FreeStatistics.org, Office for Research Development and Education, URL https://freestatistics.org/blog/index.php?pk=46315, Retrieved Sat, 27 Apr 2024 11:49:12 +0000 | |||||||||||||||||||||||||||||||||||||||||
| QR Codes: | |||||||||||||||||||||||||||||||||||||||||
|
| |||||||||||||||||||||||||||||||||||||||||
| Original text written by user: | |||||||||||||||||||||||||||||||||||||||||
| IsPrivate? | No (this computation is public) | ||||||||||||||||||||||||||||||||||||||||
| User-defined keywords | Industrial Production Index: Motor vehicles and parts NAICS=3361-3; 2002=100; NSA www.economagic.com | ||||||||||||||||||||||||||||||||||||||||
| Estimated Impact | 108 | ||||||||||||||||||||||||||||||||||||||||
Tree of Dependent Computations | |||||||||||||||||||||||||||||||||||||||||
| Family? (F = Feedback message, R = changed R code, M = changed R Module, P = changed Parameters, D = changed Data) | |||||||||||||||||||||||||||||||||||||||||
| - [Univariate Data Series] [Industrial Produc...] [2009-10-13 19:14:28] [b08f24ccf7d7e0757793cda532be96b3] [Current] | |||||||||||||||||||||||||||||||||||||||||
| Feedback Forum | |||||||||||||||||||||||||||||||||||||||||
Post a new message | |||||||||||||||||||||||||||||||||||||||||
Dataset | |||||||||||||||||||||||||||||||||||||||||
| Dataseries X: | |||||||||||||||||||||||||||||||||||||||||
41.8425 44.4434 45.3207 48.7901 47.2156 46.7036 31.2174 35.2992 45.9548 49.9451 49.4531 44.2186 50.927 55.2689 55.6843 54.4255 54.708 57.0364 46.2676 36.305 49.4334 54.0442 52.6138 40.2562 43.017 43.9331 44.9489 46.0194 47.2105 48.8029 40.0383 35.5531 46.4756 50.1612 43.5706 31.4169 32.4918 32.1866 35.7192 38.7836 39.5923 41.6231 32.7599 34.8102 41.932 43.7973 42.4805 38.0757 42.8429 48.0584 50.8531 51.2046 53.1879 55.3882 41.817 42.0496 46.6149 49.2709 51.5047 47.3289 50.6458 53.4171 59.5041 58.1524 58.8759 62.4869 50.9484 44.104 54.4907 61.3535 55.7428 49.8878 50.6021 55.7335 60.5976 65.4144 61.7519 62.1007 49.4427 45.6341 57.1604 64.2644 61.3269 53.416 56.7109 60.2733 64.0642 55.2131 62.0788 60.5322 45.7352 36.7874 49.3674 52.9091 46.1371 39.9977 39.5911 45.3943 45.8745 40.6722 37.2617 38.1738 30.5861 28.9649 37.4236 42.8472 41.6633 35.3132 35.6075 37.9868 42.0766 42.5593 44.2188 45.2648 35.1174 32.3555 35.0359 38.5214 33.8393 29.2314 28.364 31.6872 35.6076 36.855 39.0784 40.6122 34.2337 30.6021 33.403 34.0315 32.0458 30.7536 34.542 39.8511 41.8476 42.2672 44.007 47.3011 38.2021 39.9134 46.8413 51.9309 48.4926 45.1152 50.8029 54.2967 57.5755 54.6477 53.9186 56.0227 44.753 46.6963 50.3242 53.7908 53.0673 47.883 54.1865 56.234 58.5908 57.0877 56.8797 58.4162 46.5665 48.1023 53.5163 56.6703 54.6475 46.8664 55.1275 59.045 56.5076 58.3432 56.2593 59.0806 44.2511 47.0563 54.9535 56.5929 53.6903 48.6753 54.7707 62.3834 63.2707 58.2794 59.0312 58.8636 41.8981 48.5678 55.9732 62.6921 58.0668 49.342 54.3421 59.5866 62.9949 62.0387 65.1126 67.0443 45.0217 52.9553 62.1883 67.1199 63.4959 57.4058 62.657 67.0878 64.3608 68.4145 64.5355 63.475 40.3053 54.8696 59.3598 60.0869 56.177 50.5259 43.1849 57.3531 63.8039 58.5816 63.463 67.1747 46.0863 54.3141 61.3287 63.0828 49.6354 41.2037 46.7193 48.5563 49.6537 53.6085 56.7873 60.1904 43.5878 52.1061 59.5798 64.0711 56.9658 48.0362 49.982 60.2253 63.9829 62.9594 67.1074 66.2417 46.6375 60.774 61.7757 68.1683 62.65 57.77 63.1766 70.0859 72.6157 69.9856 71.4666 71.6753 46.7492 62.262 66.2547 75.3409 70.6366 64.2012 72.2035 81.0022 81.8547 79.4259 80.2618 82.0516 53.6196 77.8787 79.3195 85.2198 78.7596 72.3842 77.4396 87.1824 88.6946 82.8143 82.0566 84.6927 53.7756 77.8255 82.1415 84.6046 77.9895 71.9141 73.6719 85.3966 77.8466 85.3102 85.2973 88.8489 58.7187 82.0608 84.2591 84.6313 81.1312 71.4435 80.7986 91.2965 89.9458 88.8676 87.3366 89.0819 59.0037 87.532 90.4089 96.3289 92.0895 80.9245 84.6872 95.9176 98.12 93.9374 95.842 83.7442 53.98 95.6735 97.918 105.6269 94.7775 86.6394 93.2571 104.9521 107.5203 103.0658 105.878 106.0672 70.7451 106.0097 105.0533 112.6953 101.1115 89.8597 101.5641 109.4579 112.3277 107.3104 107.6682 109.5454 70.1139 102.1196 102.6988 105.0844 90.9278 79.8459 81.8435 92.7982 100.306 95.0331 99.9587 99.3636 67.6987 96.6307 94.0726 95.7602 90.3734 82.3961 90.8751 101.7506 103.1035 105.7144 106.0632 109.613 74.2258 106.3457 107.194 109.9028 99.7969 85.4148 101.2245 109.8004 111.8553 104.3963 106.0017 106.8735 74.5939 105.339 111.1359 113.5087 104.1428 92.6447 99.7083 114.2745 115.8436 109.1899 108.3161 107.9264 73.441 106.8394 106.2397 111.9865 99.4427 91.4725 101.5232 114.7936 108.2416 109.7544 106.0768 110.6663 73.8229 108.5442 110.5707 114.5116 98.2217 89.8933 99.1159 108.3769 112.1844 104.9371 105.7001 109.0611 72.5028 103.6442 101.6834 102.2889 94.2002 88.6249 91.0294 103.5901 105.8859 101.6204 102.2795 106.9052 74.9858 103.1353 99.6151 101.9564 94.3444 83.3764 90.4731 99.9023 92.9001 89.6838 86.6408 92.7725 67.0048 82.1726 82.8959 81.803 71.8056 61.7627 48.7681 58.403 60.2918 57.4989 52.995 52.7973 48.1214 64.8449 | |||||||||||||||||||||||||||||||||||||||||
Tables (Output of Computation) | |||||||||||||||||||||||||||||||||||||||||
| |||||||||||||||||||||||||||||||||||||||||
Figures (Output of Computation) | |||||||||||||||||||||||||||||||||||||||||
Input Parameters & R Code | |||||||||||||||||||||||||||||||||||||||||
| Parameters (Session): | |||||||||||||||||||||||||||||||||||||||||
| par1 = Industrial Production Index: Primary metal NAICS=331; 2002=100; NSA ; par2 = http://economagic.com/em-cgi/data.exe/frbg17/G331_ipnsa ; par3 = Industrial Production Index: Primary metal NAICS=331; 2002=100; NSA ; | |||||||||||||||||||||||||||||||||||||||||
| Parameters (R input): | |||||||||||||||||||||||||||||||||||||||||
| par1 = Industrial Production Index: Motor vehicles and parts NAICS=3361-3; 2002=100; NSA ; par2 = http://economagic.com/em-cgi/data.exe/frbg17/G3361T3_ipnsa ; par3 = Industrial Production Index: Motor vehicles and parts NAICS=3361-3; 2002=100; NSA ; | |||||||||||||||||||||||||||||||||||||||||
| R code (references can be found in the software module): | |||||||||||||||||||||||||||||||||||||||||
bitmap(file='test1.png') | |||||||||||||||||||||||||||||||||||||||||