Free Statistics
of Irreproducible Research!
Description of Statistical Computation | |||||||||||||||||||||||||||||||||||||||||||||||||||||||||||||||||||||||||||||||||||||||||||||||||||||||||||||||||||||||||||||||||||||||||||||||||||
|---|---|---|---|---|---|---|---|---|---|---|---|---|---|---|---|---|---|---|---|---|---|---|---|---|---|---|---|---|---|---|---|---|---|---|---|---|---|---|---|---|---|---|---|---|---|---|---|---|---|---|---|---|---|---|---|---|---|---|---|---|---|---|---|---|---|---|---|---|---|---|---|---|---|---|---|---|---|---|---|---|---|---|---|---|---|---|---|---|---|---|---|---|---|---|---|---|---|---|---|---|---|---|---|---|---|---|---|---|---|---|---|---|---|---|---|---|---|---|---|---|---|---|---|---|---|---|---|---|---|---|---|---|---|---|---|---|---|---|---|---|---|---|---|---|---|---|---|
| Author's title | |||||||||||||||||||||||||||||||||||||||||||||||||||||||||||||||||||||||||||||||||||||||||||||||||||||||||||||||||||||||||||||||||||||||||||||||||||
| Author | *The author of this computation has been verified* | ||||||||||||||||||||||||||||||||||||||||||||||||||||||||||||||||||||||||||||||||||||||||||||||||||||||||||||||||||||||||||||||||||||||||||||||||||
| R Software Module | rwasp_harrell_davis.wasp | ||||||||||||||||||||||||||||||||||||||||||||||||||||||||||||||||||||||||||||||||||||||||||||||||||||||||||||||||||||||||||||||||||||||||||||||||||
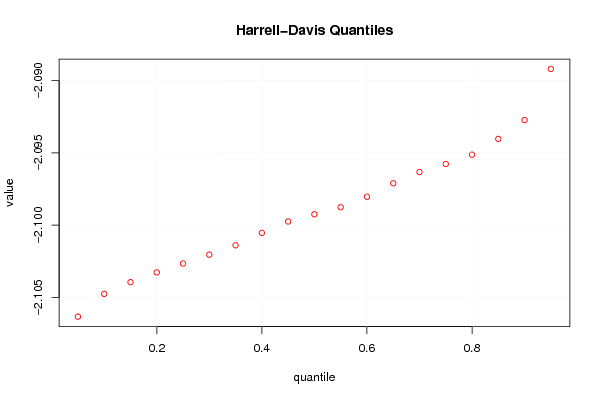
| Title produced by software | Harrell-Davis Quantiles | ||||||||||||||||||||||||||||||||||||||||||||||||||||||||||||||||||||||||||||||||||||||||||||||||||||||||||||||||||||||||||||||||||||||||||||||||||
| Date of computation | Fri, 16 Oct 2009 04:41:00 -0600 | ||||||||||||||||||||||||||||||||||||||||||||||||||||||||||||||||||||||||||||||||||||||||||||||||||||||||||||||||||||||||||||||||||||||||||||||||||
| Cite this page as follows | Statistical Computations at FreeStatistics.org, Office for Research Development and Education, URL https://freestatistics.org/blog/index.php?v=date/2009/Oct/16/t1255689854xaqjhzhpyu9pu5b.htm/, Retrieved Tue, 30 Apr 2024 05:36:12 +0000 | ||||||||||||||||||||||||||||||||||||||||||||||||||||||||||||||||||||||||||||||||||||||||||||||||||||||||||||||||||||||||||||||||||||||||||||||||||
| Statistical Computations at FreeStatistics.org, Office for Research Development and Education, URL https://freestatistics.org/blog/index.php?pk=46949, Retrieved Tue, 30 Apr 2024 05:36:12 +0000 | |||||||||||||||||||||||||||||||||||||||||||||||||||||||||||||||||||||||||||||||||||||||||||||||||||||||||||||||||||||||||||||||||||||||||||||||||||
| QR Codes: | |||||||||||||||||||||||||||||||||||||||||||||||||||||||||||||||||||||||||||||||||||||||||||||||||||||||||||||||||||||||||||||||||||||||||||||||||||
|
| |||||||||||||||||||||||||||||||||||||||||||||||||||||||||||||||||||||||||||||||||||||||||||||||||||||||||||||||||||||||||||||||||||||||||||||||||||
| Original text written by user: | |||||||||||||||||||||||||||||||||||||||||||||||||||||||||||||||||||||||||||||||||||||||||||||||||||||||||||||||||||||||||||||||||||||||||||||||||||
| IsPrivate? | No (this computation is public) | ||||||||||||||||||||||||||||||||||||||||||||||||||||||||||||||||||||||||||||||||||||||||||||||||||||||||||||||||||||||||||||||||||||||||||||||||||
| User-defined keywords | |||||||||||||||||||||||||||||||||||||||||||||||||||||||||||||||||||||||||||||||||||||||||||||||||||||||||||||||||||||||||||||||||||||||||||||||||||
| Estimated Impact | 117 | ||||||||||||||||||||||||||||||||||||||||||||||||||||||||||||||||||||||||||||||||||||||||||||||||||||||||||||||||||||||||||||||||||||||||||||||||||
Tree of Dependent Computations | |||||||||||||||||||||||||||||||||||||||||||||||||||||||||||||||||||||||||||||||||||||||||||||||||||||||||||||||||||||||||||||||||||||||||||||||||||
| Family? (F = Feedback message, R = changed R code, M = changed R Module, P = changed Parameters, D = changed Data) | |||||||||||||||||||||||||||||||||||||||||||||||||||||||||||||||||||||||||||||||||||||||||||||||||||||||||||||||||||||||||||||||||||||||||||||||||||
| - [Bivariate Data Series] [Bivariate dataset] [2008-01-05 23:51:08] [74be16979710d4c4e7c6647856088456] F RMPD [Univariate Explorative Data Analysis] [Colombia Coffee] [2008-01-07 14:21:11] [74be16979710d4c4e7c6647856088456] F RMPD [Univariate Data Series] [] [2009-10-14 08:30:28] [74be16979710d4c4e7c6647856088456] - RMPD [Harrell-Davis Quantiles] [SHW_WS3_Q3 voorsp...] [2009-10-16 10:41:00] [f0f26816ac6124f58333f11f6c174000] [Current] | |||||||||||||||||||||||||||||||||||||||||||||||||||||||||||||||||||||||||||||||||||||||||||||||||||||||||||||||||||||||||||||||||||||||||||||||||||
| Feedback Forum | |||||||||||||||||||||||||||||||||||||||||||||||||||||||||||||||||||||||||||||||||||||||||||||||||||||||||||||||||||||||||||||||||||||||||||||||||||
Post a new message | |||||||||||||||||||||||||||||||||||||||||||||||||||||||||||||||||||||||||||||||||||||||||||||||||||||||||||||||||||||||||||||||||||||||||||||||||||
Dataset | |||||||||||||||||||||||||||||||||||||||||||||||||||||||||||||||||||||||||||||||||||||||||||||||||||||||||||||||||||||||||||||||||||||||||||||||||||
| Dataseries X: | |||||||||||||||||||||||||||||||||||||||||||||||||||||||||||||||||||||||||||||||||||||||||||||||||||||||||||||||||||||||||||||||||||||||||||||||||||
-2.08459015 -2.084139482 -2.088701546 -2.091544359 -2.089390446 -2.086901271 -2.085599746 -2.08742381 -2.093887342 -2.095893691 -2.091975472 -2.09244865 -2.09565 -2.095845274 -2.093161272 -2.092853846 -2.0928748 -2.093683784 -2.094184837 -2.097200613 -2.095753659 -2.096785246 -2.096368447 -2.095345725 -2.092687879 -2.093193124 -2.092260024 -2.092495694 -2.093859451 -2.095758586 -2.094597509 -2.091013085 -2.093223477 -2.093852802 -2.094982547 -2.09398957 -2.095647939 -2.095228638 -2.096383324 -2.095880221 -2.095007621 -2.093853488 -2.094144186 -2.095746868 -2.095680347 -2.097695049 -2.098450058 -2.099198044 -2.099089189 -2.099476174 -2.099957143 -2.100178567 -2.102059091 -2.102647002 -2.103123235 -2.102623138 -2.103165422 -2.102972118 -2.10155247 -2.101613961 -2.098782587 -2.099326322 -2.098527451 -2.098528763 -2.099315042 -2.099877728 -2.099215526 -2.099215526 -2.098943382 -2.096225737 -2.096803441 -2.09587561 -2.097095122 -2.098978875 -2.101873612 -2.10299589 -2.101251943 -2.100396996 -2.099605882 -2.099829232 -2.101086072 -2.102830941 -2.102186801 -2.103663557 -2.107623577 -2.105919365 -2.104433762 -2.101850959 -2.099995847 -2.101438052 -2.104421277 -2.107563303 -2.105547558 -2.105337666 -2.106823077 -2.106771686 -2.104862884 -2.104725766 -2.103426316 -2.103803075 -2.105536364 -2.106065803 -2.106540827 -2.105206859 -2.103772297 -2.103229913 -2.10204982 -2.099946178 -2.100715803 -2.099925575 -2.098369388 -2.099502446 -2.098890826 -2.09588369 -2.095679817 -2.095280711 -2.092904552 -2.0949 -2.094259233 -2.097355919 -2.098822457 -2.098621805 -2.09945 -2.096040089 -2.094370821 -2.095459389 -2.096877887 -2.096779607 -2.098821569 -2.098386036 -2.099474156 -2.099239853 -2.095739844 -2.097076987 -2.096919932 -2.101134867 -2.103471774 -2.105650845 -2.103740231 -2.103842308 -2.103856835 -2.103715916 -2.104636842 -2.103348111 -2.104129852 -2.101606387 -2.101515055 -2.102852381 -2.104966414 -2.102236802 -2.102861738 -2.101456604 -2.101417436 -2.102461205 -2.101163504 -2.101746298 -2.102459663 -2.10401215 -2.104627018 -2.100961453 -2.097760465 -2.099432191 -2.098763216 -2.099480452 -2.100553775 -2.096750575 -2.098197384 -2.09949193 -2.099561482 -2.098159479 -2.095900912 -2.097377314 -2.098537392 -2.096913575 -2.095743102 -2.095890991 -2.095678578 -2.098798876 -2.098370166 -2.096946168 -2.098127395 -2.099275 -2.102392226 -2.101208204 -2.100205445 -2.101636633 -2.102835982 -2.102719383 -2.104532644 -2.104588323 -2.103367777 -2.102719615 -2.10263523 -2.102163986 -2.101952402 -2.102130467 -2.104317793 -2.104281533 -2.103940887 -2.105030435 -2.103340487 -2.100194627 -2.097172727 -2.096563789 -2.094979776 -2.094277682 -2.091227095 -2.092315254 -2.087907598 -2.085437748 -2.085015789 -2.087271956 -2.087045249 -2.090159306 -2.096816667 -2.098950791 -2.10025343 -2.10188172 -2.107328453 -2.107414499 -2.111427663 -2.114428613 -2.116807895 -2.113098032 | |||||||||||||||||||||||||||||||||||||||||||||||||||||||||||||||||||||||||||||||||||||||||||||||||||||||||||||||||||||||||||||||||||||||||||||||||||
Tables (Output of Computation) | |||||||||||||||||||||||||||||||||||||||||||||||||||||||||||||||||||||||||||||||||||||||||||||||||||||||||||||||||||||||||||||||||||||||||||||||||||
| |||||||||||||||||||||||||||||||||||||||||||||||||||||||||||||||||||||||||||||||||||||||||||||||||||||||||||||||||||||||||||||||||||||||||||||||||||
Figures (Output of Computation) | |||||||||||||||||||||||||||||||||||||||||||||||||||||||||||||||||||||||||||||||||||||||||||||||||||||||||||||||||||||||||||||||||||||||||||||||||||
Input Parameters & R Code | |||||||||||||||||||||||||||||||||||||||||||||||||||||||||||||||||||||||||||||||||||||||||||||||||||||||||||||||||||||||||||||||||||||||||||||||||||
| Parameters (Session): | |||||||||||||||||||||||||||||||||||||||||||||||||||||||||||||||||||||||||||||||||||||||||||||||||||||||||||||||||||||||||||||||||||||||||||||||||||
| par1 = 0.05 ; par2 = 0.95 ; par3 = 0.05 ; | |||||||||||||||||||||||||||||||||||||||||||||||||||||||||||||||||||||||||||||||||||||||||||||||||||||||||||||||||||||||||||||||||||||||||||||||||||
| Parameters (R input): | |||||||||||||||||||||||||||||||||||||||||||||||||||||||||||||||||||||||||||||||||||||||||||||||||||||||||||||||||||||||||||||||||||||||||||||||||||
| par1 = 0.05 ; par2 = 0.95 ; par3 = 0.05 ; | |||||||||||||||||||||||||||||||||||||||||||||||||||||||||||||||||||||||||||||||||||||||||||||||||||||||||||||||||||||||||||||||||||||||||||||||||||
| R code (references can be found in the software module): | |||||||||||||||||||||||||||||||||||||||||||||||||||||||||||||||||||||||||||||||||||||||||||||||||||||||||||||||||||||||||||||||||||||||||||||||||||
par1 <- as(par1,'numeric') | |||||||||||||||||||||||||||||||||||||||||||||||||||||||||||||||||||||||||||||||||||||||||||||||||||||||||||||||||||||||||||||||||||||||||||||||||||