Free Statistics

of Irreproducible Research!

Author's title

Author*The author of this computation has been verified*
R Software Modulerwasp_centraltendency.wasp
Title produced by softwareCentral Tendency
Date of computationFri, 16 Oct 2009 05:04:07 -0600
Cite this page as followsStatistical Computations at FreeStatistics.org, Office for Research Development and Education, URL https://freestatistics.org/blog/index.php?v=date/2009/Oct/16/t1255691137xoqs695kb372brj.htm/, Retrieved Tue, 30 Apr 2024 01:44:12 +0000
Statistical Computations at FreeStatistics.org, Office for Research Development and Education, URL https://freestatistics.org/blog/index.php?pk=46955, Retrieved Tue, 30 Apr 2024 01:44:12 +0000
QR Codes:

Original text written by user:
IsPrivate?No (this computation is public)
User-defined keywords
Estimated Impact137
Family? (F = Feedback message, R = changed R code, M = changed R Module, P = changed Parameters, D = changed Data)
-     [Central Tendency] [central tendensy] [2009-10-15 22:21:41] [cd6314e7e707a6546bd4604c9d1f2b69]
-    D    [Central Tendency] [central tendensy] [2009-10-16 11:04:07] [ea241b681aafed79da4b5b99fad98471] [Current]
Feedback Forum

Post a new message
Dataseries X:
1.059376305
1.049152594
1.039136096
1.034096272
1.027914872
1.033843429
1.120843461
1.174158677
1.094239538
1.101666202
1.083007576
1.097517002
1.096837041
1.076749714
1.070928291
1.065628558
1.054205568
1.062477081
1.138160109
1.164586135
1.090276521
1.085179676
1.060722518
1.069447754
1.018013057
1.02393652
1.010229136
1.03043911
1.015556854
1.016775496
1.067390857
1.059332898
1.02471349
0.978889105
0.963805308
0.96200824
0.956267939
0.932043091
0.922885045
0.904181723
0.901906678
0.928439608
1.003536994
0.987562231
0.928304053
0.906744159
0.899379103
0.917661191
0.904426023
0.891150309
0.905491261
0.896949109
0.886319264
0.912090346
0.972560901
0.965845826
0.927261332
0.921785356
0.915782268
0.950288718
0.972234538
0.978728706
0.984010385
0.969976827
0.978680947
1.003454701
1.049865153
1.047773391
1.016163609


Summary of computational transaction
Raw Inputview raw input (R code)
Raw Outputview raw output of R engine
Computing time2 seconds
R Server'Sir Ronald Aylmer Fisher' @ 193.190.124.24

\begin{tabular}{lllllllll}
\hline
Summary of computational transaction \tabularnewline
Raw Input & view raw input (R code)  \tabularnewline
Raw Output & view raw output of R engine  \tabularnewline
Computing time & 2 seconds \tabularnewline
R Server & 'Sir Ronald Aylmer Fisher' @ 193.190.124.24 \tabularnewline
\hline
\end{tabular}
%Source: https://freestatistics.org/blog/index.php?pk=46955&T=0

[TABLE]
[ROW][C]Summary of computational transaction[/C][/ROW]
[ROW][C]Raw Input[/C][C]view raw input (R code) [/C][/ROW]
[ROW][C]Raw Output[/C][C]view raw output of R engine [/C][/ROW]
[ROW][C]Computing time[/C][C]2 seconds[/C][/ROW]
[ROW][C]R Server[/C][C]'Sir Ronald Aylmer Fisher' @ 193.190.124.24[/C][/ROW]
[/TABLE]
Source: https://freestatistics.org/blog/index.php?pk=46955&T=0

Globally Unique Identifier (entire table): ba.freestatistics.org/blog/index.php?pk=46955&T=0

As an alternative you can also use a QR Code:  

The GUIDs for individual cells are displayed in the table below:

Summary of computational transaction
Raw Inputview raw input (R code)
Raw Outputview raw output of R engine
Computing time2 seconds
R Server'Sir Ronald Aylmer Fisher' @ 193.190.124.24


Central Tendency - Ungrouped Data
MeasureValueS.E.Value/S.E.
Arithmetic Mean1.005231765884060.0088121316333995114.073621196721
Geometric Mean1.00261134060415
Harmonic Mean1.00000000003222
Quadratic Mean1.00785482699109
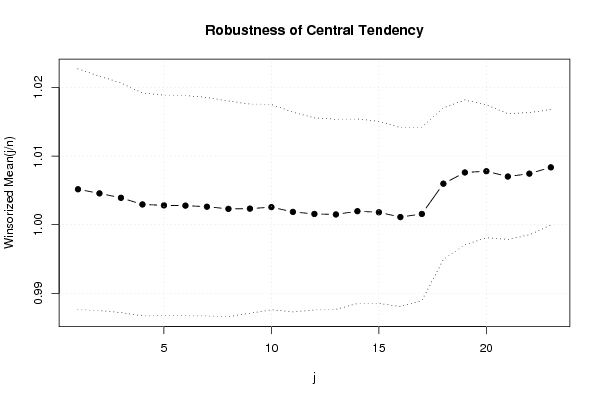
Winsorized Mean ( 1 / 23 )1.005163048536230.00876036196426946114.739899177220
Winsorized Mean ( 2 / 23 )1.004565157927540.00853788518262427117.659717417137
Winsorized Mean ( 3 / 23 )1.003917912101450.00835416590864884120.169736042963
Winsorized Mean ( 4 / 23 )1.002952713028990.00811317655520843123.620225223019
Winsorized Mean ( 5 / 23 )1.002816904695650.0080302140552986124.880469909013
Winsorized Mean ( 6 / 23 )1.002779021130430.00801615055877951125.094833708202
Winsorized Mean ( 7 / 23 )1.002623573956520.00795163326727705126.090268534210
Winsorized Mean ( 8 / 23 )1.002309357260870.00784878151921724127.702542720393
Winsorized Mean ( 9 / 23 )1.002341880130430.00761760901529084131.582216692722
Winsorized Mean ( 10 / 23 )1.002562144188410.00747523169522959134.117868858594
Winsorized Mean ( 11 / 23 )1.001864052463770.00726959740294441137.815617142427
Winsorized Mean ( 12 / 23 )1.001568877159420.00699783975501653143.125437595427
Winsorized Mean ( 13 / 23 )1.001497123188410.00692270839813277144.668396470164
Winsorized Mean ( 14 / 23 )1.001967724057970.00671589891153526149.193389783903
Winsorized Mean ( 15 / 23 )1.001811294057970.00662428058727112151.233221609453
Winsorized Mean ( 16 / 23 )1.001111949826090.00651676460856514153.621008270009
Winsorized Mean ( 17 / 23 )1.001567480840580.00631233128705051158.668396079790
Winsorized Mean ( 18 / 23 )1.005976023623190.00552267281831535182.153833246644
Winsorized Mean ( 19 / 23 )1.007610523130430.00528109577575268190.795729885589
Winsorized Mean ( 20 / 23 )1.007788195884060.00483411086189311208.474365747043
Winsorized Mean ( 21 / 23 )1.007014133753620.00457369806089321220.175035681512
Winsorized Mean ( 22 / 23 )1.007437540971010.00445250842305115226.262916372127
Winsorized Mean ( 23 / 23 )1.008354806971010.00420201336609944239.969443007039
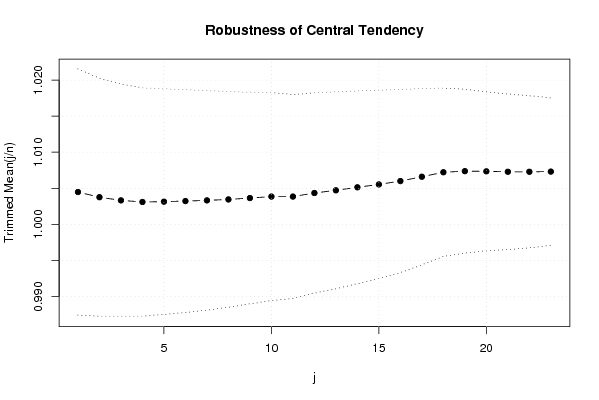
Trimmed Mean ( 1 / 23 )1.004485282164180.00852852149145712117.779533436171
Trimmed Mean ( 2 / 23 )1.003765807092310.00824980223658404121.671499304683
Trimmed Mean ( 3 / 23 )1.003328067349210.00805833058903873124.508178991065
Trimmed Mean ( 4 / 23 )1.003105666868850.00791043521868618126.807898571661
Trimmed Mean ( 5 / 23 )1.003150386423730.00781636315738039128.339787472199
Trimmed Mean ( 6 / 23 )1.003231124105260.00772264936780424129.907636139450
Trimmed Mean ( 7 / 23 )1.003325654727270.0076065646102681131.902600731595
Trimmed Mean ( 8 / 23 )1.003456230396230.00747530706072973134.236121973867
Trimmed Mean ( 9 / 23 )1.003650186882350.0073327887894471136.871552652211
Trimmed Mean ( 10 / 23 )1.003854887938780.0072045152150572139.336909975671
Trimmed Mean ( 11 / 23 )1.003854887938780.00706966214467896141.994747046623
Trimmed Mean ( 12 / 23 )1.004348639111110.00693784595416492144.763756034131
Trimmed Mean ( 13 / 23 )1.004720351465120.00682194247208138147.277751985876
Trimmed Mean ( 14 / 23 )1.005137617414630.00667884625606457150.495696244234
Trimmed Mean ( 15 / 23 )1.005538208333330.00653078555521017153.968952101195
Trimmed Mean ( 16 / 23 )1.006001554432430.00634500528803944158.550152247908
Trimmed Mean ( 17 / 23 )1.006604023571430.00610875292472836164.780608411362
Trimmed Mean ( 18 / 23 )1.007223491393940.00583113529424674172.731970802960
Trimmed Mean ( 19 / 23 )1.007377748161290.00567431835284878177.532821656990
Trimmed Mean ( 20 / 23 )1.007348598482760.00550777123696073182.895867519477
Trimmed Mean ( 21 / 23 )1.007292427703700.00538821295056276186.943693010221
Trimmed Mean ( 22 / 23 )1.007292427703700.00527216794024152191.058486588642
Trimmed Mean ( 23 / 23 )1.007314202913040.00510896698676115197.165925229757
Median1.015556854
Midrange1.0302389705
Midmean - Weighted Average at Xnp1.00501230314706
Midmean - Weighted Average at X(n+1)p1.00660402357143
Midmean - Empirical Distribution Function1.00660402357143
Midmean - Empirical Distribution Function - Averaging1.00660402357143
Midmean - Empirical Distribution Function - Interpolation1.00660402357143
Midmean - Closest Observation1.00443278980556
Midmean - True Basic - Statistics Graphics Toolkit1.00660402357143
Midmean - MS Excel (old versions)1.00660402357143
Number of observations69

\begin{tabular}{lllllllll}
\hline
Central Tendency - Ungrouped Data \tabularnewline
Measure & Value & S.E. & Value/S.E. \tabularnewline
Arithmetic Mean & 1.00523176588406 & 0.0088121316333995 & 114.073621196721 \tabularnewline
Geometric Mean & 1.00261134060415 &  &  \tabularnewline
Harmonic Mean & 1.00000000003222 &  &  \tabularnewline
Quadratic Mean & 1.00785482699109 &  &  \tabularnewline
Winsorized Mean ( 1 / 23 ) & 1.00516304853623 & 0.00876036196426946 & 114.739899177220 \tabularnewline
Winsorized Mean ( 2 / 23 ) & 1.00456515792754 & 0.00853788518262427 & 117.659717417137 \tabularnewline
Winsorized Mean ( 3 / 23 ) & 1.00391791210145 & 0.00835416590864884 & 120.169736042963 \tabularnewline
Winsorized Mean ( 4 / 23 ) & 1.00295271302899 & 0.00811317655520843 & 123.620225223019 \tabularnewline
Winsorized Mean ( 5 / 23 ) & 1.00281690469565 & 0.0080302140552986 & 124.880469909013 \tabularnewline
Winsorized Mean ( 6 / 23 ) & 1.00277902113043 & 0.00801615055877951 & 125.094833708202 \tabularnewline
Winsorized Mean ( 7 / 23 ) & 1.00262357395652 & 0.00795163326727705 & 126.090268534210 \tabularnewline
Winsorized Mean ( 8 / 23 ) & 1.00230935726087 & 0.00784878151921724 & 127.702542720393 \tabularnewline
Winsorized Mean ( 9 / 23 ) & 1.00234188013043 & 0.00761760901529084 & 131.582216692722 \tabularnewline
Winsorized Mean ( 10 / 23 ) & 1.00256214418841 & 0.00747523169522959 & 134.117868858594 \tabularnewline
Winsorized Mean ( 11 / 23 ) & 1.00186405246377 & 0.00726959740294441 & 137.815617142427 \tabularnewline
Winsorized Mean ( 12 / 23 ) & 1.00156887715942 & 0.00699783975501653 & 143.125437595427 \tabularnewline
Winsorized Mean ( 13 / 23 ) & 1.00149712318841 & 0.00692270839813277 & 144.668396470164 \tabularnewline
Winsorized Mean ( 14 / 23 ) & 1.00196772405797 & 0.00671589891153526 & 149.193389783903 \tabularnewline
Winsorized Mean ( 15 / 23 ) & 1.00181129405797 & 0.00662428058727112 & 151.233221609453 \tabularnewline
Winsorized Mean ( 16 / 23 ) & 1.00111194982609 & 0.00651676460856514 & 153.621008270009 \tabularnewline
Winsorized Mean ( 17 / 23 ) & 1.00156748084058 & 0.00631233128705051 & 158.668396079790 \tabularnewline
Winsorized Mean ( 18 / 23 ) & 1.00597602362319 & 0.00552267281831535 & 182.153833246644 \tabularnewline
Winsorized Mean ( 19 / 23 ) & 1.00761052313043 & 0.00528109577575268 & 190.795729885589 \tabularnewline
Winsorized Mean ( 20 / 23 ) & 1.00778819588406 & 0.00483411086189311 & 208.474365747043 \tabularnewline
Winsorized Mean ( 21 / 23 ) & 1.00701413375362 & 0.00457369806089321 & 220.175035681512 \tabularnewline
Winsorized Mean ( 22 / 23 ) & 1.00743754097101 & 0.00445250842305115 & 226.262916372127 \tabularnewline
Winsorized Mean ( 23 / 23 ) & 1.00835480697101 & 0.00420201336609944 & 239.969443007039 \tabularnewline
Trimmed Mean ( 1 / 23 ) & 1.00448528216418 & 0.00852852149145712 & 117.779533436171 \tabularnewline
Trimmed Mean ( 2 / 23 ) & 1.00376580709231 & 0.00824980223658404 & 121.671499304683 \tabularnewline
Trimmed Mean ( 3 / 23 ) & 1.00332806734921 & 0.00805833058903873 & 124.508178991065 \tabularnewline
Trimmed Mean ( 4 / 23 ) & 1.00310566686885 & 0.00791043521868618 & 126.807898571661 \tabularnewline
Trimmed Mean ( 5 / 23 ) & 1.00315038642373 & 0.00781636315738039 & 128.339787472199 \tabularnewline
Trimmed Mean ( 6 / 23 ) & 1.00323112410526 & 0.00772264936780424 & 129.907636139450 \tabularnewline
Trimmed Mean ( 7 / 23 ) & 1.00332565472727 & 0.0076065646102681 & 131.902600731595 \tabularnewline
Trimmed Mean ( 8 / 23 ) & 1.00345623039623 & 0.00747530706072973 & 134.236121973867 \tabularnewline
Trimmed Mean ( 9 / 23 ) & 1.00365018688235 & 0.0073327887894471 & 136.871552652211 \tabularnewline
Trimmed Mean ( 10 / 23 ) & 1.00385488793878 & 0.0072045152150572 & 139.336909975671 \tabularnewline
Trimmed Mean ( 11 / 23 ) & 1.00385488793878 & 0.00706966214467896 & 141.994747046623 \tabularnewline
Trimmed Mean ( 12 / 23 ) & 1.00434863911111 & 0.00693784595416492 & 144.763756034131 \tabularnewline
Trimmed Mean ( 13 / 23 ) & 1.00472035146512 & 0.00682194247208138 & 147.277751985876 \tabularnewline
Trimmed Mean ( 14 / 23 ) & 1.00513761741463 & 0.00667884625606457 & 150.495696244234 \tabularnewline
Trimmed Mean ( 15 / 23 ) & 1.00553820833333 & 0.00653078555521017 & 153.968952101195 \tabularnewline
Trimmed Mean ( 16 / 23 ) & 1.00600155443243 & 0.00634500528803944 & 158.550152247908 \tabularnewline
Trimmed Mean ( 17 / 23 ) & 1.00660402357143 & 0.00610875292472836 & 164.780608411362 \tabularnewline
Trimmed Mean ( 18 / 23 ) & 1.00722349139394 & 0.00583113529424674 & 172.731970802960 \tabularnewline
Trimmed Mean ( 19 / 23 ) & 1.00737774816129 & 0.00567431835284878 & 177.532821656990 \tabularnewline
Trimmed Mean ( 20 / 23 ) & 1.00734859848276 & 0.00550777123696073 & 182.895867519477 \tabularnewline
Trimmed Mean ( 21 / 23 ) & 1.00729242770370 & 0.00538821295056276 & 186.943693010221 \tabularnewline
Trimmed Mean ( 22 / 23 ) & 1.00729242770370 & 0.00527216794024152 & 191.058486588642 \tabularnewline
Trimmed Mean ( 23 / 23 ) & 1.00731420291304 & 0.00510896698676115 & 197.165925229757 \tabularnewline
Median & 1.015556854 &  &  \tabularnewline
Midrange & 1.0302389705 &  &  \tabularnewline
Midmean - Weighted Average at Xnp & 1.00501230314706 &  &  \tabularnewline
Midmean - Weighted Average at X(n+1)p & 1.00660402357143 &  &  \tabularnewline
Midmean - Empirical Distribution Function & 1.00660402357143 &  &  \tabularnewline
Midmean - Empirical Distribution Function - Averaging & 1.00660402357143 &  &  \tabularnewline
Midmean - Empirical Distribution Function - Interpolation & 1.00660402357143 &  &  \tabularnewline
Midmean - Closest Observation & 1.00443278980556 &  &  \tabularnewline
Midmean - True Basic - Statistics Graphics Toolkit & 1.00660402357143 &  &  \tabularnewline
Midmean - MS Excel (old versions) & 1.00660402357143 &  &  \tabularnewline
Number of observations & 69 &  &  \tabularnewline
\hline
\end{tabular}
%Source: https://freestatistics.org/blog/index.php?pk=46955&T=1

[TABLE]
[ROW][C]Central Tendency - Ungrouped Data[/C][/ROW]
[ROW][C]Measure[/C][C]Value[/C][C]S.E.[/C][C]Value/S.E.[/C][/ROW]
[ROW][C]Arithmetic Mean[/C][C]1.00523176588406[/C][C]0.0088121316333995[/C][C]114.073621196721[/C][/ROW]
[ROW][C]Geometric Mean[/C][C]1.00261134060415[/C][C][/C][C][/C][/ROW]
[ROW][C]Harmonic Mean[/C][C]1.00000000003222[/C][C][/C][C][/C][/ROW]
[ROW][C]Quadratic Mean[/C][C]1.00785482699109[/C][C][/C][C][/C][/ROW]
[ROW][C]Winsorized Mean ( 1 / 23 )[/C][C]1.00516304853623[/C][C]0.00876036196426946[/C][C]114.739899177220[/C][/ROW]
[ROW][C]Winsorized Mean ( 2 / 23 )[/C][C]1.00456515792754[/C][C]0.00853788518262427[/C][C]117.659717417137[/C][/ROW]
[ROW][C]Winsorized Mean ( 3 / 23 )[/C][C]1.00391791210145[/C][C]0.00835416590864884[/C][C]120.169736042963[/C][/ROW]
[ROW][C]Winsorized Mean ( 4 / 23 )[/C][C]1.00295271302899[/C][C]0.00811317655520843[/C][C]123.620225223019[/C][/ROW]
[ROW][C]Winsorized Mean ( 5 / 23 )[/C][C]1.00281690469565[/C][C]0.0080302140552986[/C][C]124.880469909013[/C][/ROW]
[ROW][C]Winsorized Mean ( 6 / 23 )[/C][C]1.00277902113043[/C][C]0.00801615055877951[/C][C]125.094833708202[/C][/ROW]
[ROW][C]Winsorized Mean ( 7 / 23 )[/C][C]1.00262357395652[/C][C]0.00795163326727705[/C][C]126.090268534210[/C][/ROW]
[ROW][C]Winsorized Mean ( 8 / 23 )[/C][C]1.00230935726087[/C][C]0.00784878151921724[/C][C]127.702542720393[/C][/ROW]
[ROW][C]Winsorized Mean ( 9 / 23 )[/C][C]1.00234188013043[/C][C]0.00761760901529084[/C][C]131.582216692722[/C][/ROW]
[ROW][C]Winsorized Mean ( 10 / 23 )[/C][C]1.00256214418841[/C][C]0.00747523169522959[/C][C]134.117868858594[/C][/ROW]
[ROW][C]Winsorized Mean ( 11 / 23 )[/C][C]1.00186405246377[/C][C]0.00726959740294441[/C][C]137.815617142427[/C][/ROW]
[ROW][C]Winsorized Mean ( 12 / 23 )[/C][C]1.00156887715942[/C][C]0.00699783975501653[/C][C]143.125437595427[/C][/ROW]
[ROW][C]Winsorized Mean ( 13 / 23 )[/C][C]1.00149712318841[/C][C]0.00692270839813277[/C][C]144.668396470164[/C][/ROW]
[ROW][C]Winsorized Mean ( 14 / 23 )[/C][C]1.00196772405797[/C][C]0.00671589891153526[/C][C]149.193389783903[/C][/ROW]
[ROW][C]Winsorized Mean ( 15 / 23 )[/C][C]1.00181129405797[/C][C]0.00662428058727112[/C][C]151.233221609453[/C][/ROW]
[ROW][C]Winsorized Mean ( 16 / 23 )[/C][C]1.00111194982609[/C][C]0.00651676460856514[/C][C]153.621008270009[/C][/ROW]
[ROW][C]Winsorized Mean ( 17 / 23 )[/C][C]1.00156748084058[/C][C]0.00631233128705051[/C][C]158.668396079790[/C][/ROW]
[ROW][C]Winsorized Mean ( 18 / 23 )[/C][C]1.00597602362319[/C][C]0.00552267281831535[/C][C]182.153833246644[/C][/ROW]
[ROW][C]Winsorized Mean ( 19 / 23 )[/C][C]1.00761052313043[/C][C]0.00528109577575268[/C][C]190.795729885589[/C][/ROW]
[ROW][C]Winsorized Mean ( 20 / 23 )[/C][C]1.00778819588406[/C][C]0.00483411086189311[/C][C]208.474365747043[/C][/ROW]
[ROW][C]Winsorized Mean ( 21 / 23 )[/C][C]1.00701413375362[/C][C]0.00457369806089321[/C][C]220.175035681512[/C][/ROW]
[ROW][C]Winsorized Mean ( 22 / 23 )[/C][C]1.00743754097101[/C][C]0.00445250842305115[/C][C]226.262916372127[/C][/ROW]
[ROW][C]Winsorized Mean ( 23 / 23 )[/C][C]1.00835480697101[/C][C]0.00420201336609944[/C][C]239.969443007039[/C][/ROW]
[ROW][C]Trimmed Mean ( 1 / 23 )[/C][C]1.00448528216418[/C][C]0.00852852149145712[/C][C]117.779533436171[/C][/ROW]
[ROW][C]Trimmed Mean ( 2 / 23 )[/C][C]1.00376580709231[/C][C]0.00824980223658404[/C][C]121.671499304683[/C][/ROW]
[ROW][C]Trimmed Mean ( 3 / 23 )[/C][C]1.00332806734921[/C][C]0.00805833058903873[/C][C]124.508178991065[/C][/ROW]
[ROW][C]Trimmed Mean ( 4 / 23 )[/C][C]1.00310566686885[/C][C]0.00791043521868618[/C][C]126.807898571661[/C][/ROW]
[ROW][C]Trimmed Mean ( 5 / 23 )[/C][C]1.00315038642373[/C][C]0.00781636315738039[/C][C]128.339787472199[/C][/ROW]
[ROW][C]Trimmed Mean ( 6 / 23 )[/C][C]1.00323112410526[/C][C]0.00772264936780424[/C][C]129.907636139450[/C][/ROW]
[ROW][C]Trimmed Mean ( 7 / 23 )[/C][C]1.00332565472727[/C][C]0.0076065646102681[/C][C]131.902600731595[/C][/ROW]
[ROW][C]Trimmed Mean ( 8 / 23 )[/C][C]1.00345623039623[/C][C]0.00747530706072973[/C][C]134.236121973867[/C][/ROW]
[ROW][C]Trimmed Mean ( 9 / 23 )[/C][C]1.00365018688235[/C][C]0.0073327887894471[/C][C]136.871552652211[/C][/ROW]
[ROW][C]Trimmed Mean ( 10 / 23 )[/C][C]1.00385488793878[/C][C]0.0072045152150572[/C][C]139.336909975671[/C][/ROW]
[ROW][C]Trimmed Mean ( 11 / 23 )[/C][C]1.00385488793878[/C][C]0.00706966214467896[/C][C]141.994747046623[/C][/ROW]
[ROW][C]Trimmed Mean ( 12 / 23 )[/C][C]1.00434863911111[/C][C]0.00693784595416492[/C][C]144.763756034131[/C][/ROW]
[ROW][C]Trimmed Mean ( 13 / 23 )[/C][C]1.00472035146512[/C][C]0.00682194247208138[/C][C]147.277751985876[/C][/ROW]
[ROW][C]Trimmed Mean ( 14 / 23 )[/C][C]1.00513761741463[/C][C]0.00667884625606457[/C][C]150.495696244234[/C][/ROW]
[ROW][C]Trimmed Mean ( 15 / 23 )[/C][C]1.00553820833333[/C][C]0.00653078555521017[/C][C]153.968952101195[/C][/ROW]
[ROW][C]Trimmed Mean ( 16 / 23 )[/C][C]1.00600155443243[/C][C]0.00634500528803944[/C][C]158.550152247908[/C][/ROW]
[ROW][C]Trimmed Mean ( 17 / 23 )[/C][C]1.00660402357143[/C][C]0.00610875292472836[/C][C]164.780608411362[/C][/ROW]
[ROW][C]Trimmed Mean ( 18 / 23 )[/C][C]1.00722349139394[/C][C]0.00583113529424674[/C][C]172.731970802960[/C][/ROW]
[ROW][C]Trimmed Mean ( 19 / 23 )[/C][C]1.00737774816129[/C][C]0.00567431835284878[/C][C]177.532821656990[/C][/ROW]
[ROW][C]Trimmed Mean ( 20 / 23 )[/C][C]1.00734859848276[/C][C]0.00550777123696073[/C][C]182.895867519477[/C][/ROW]
[ROW][C]Trimmed Mean ( 21 / 23 )[/C][C]1.00729242770370[/C][C]0.00538821295056276[/C][C]186.943693010221[/C][/ROW]
[ROW][C]Trimmed Mean ( 22 / 23 )[/C][C]1.00729242770370[/C][C]0.00527216794024152[/C][C]191.058486588642[/C][/ROW]
[ROW][C]Trimmed Mean ( 23 / 23 )[/C][C]1.00731420291304[/C][C]0.00510896698676115[/C][C]197.165925229757[/C][/ROW]
[ROW][C]Median[/C][C]1.015556854[/C][C][/C][C][/C][/ROW]
[ROW][C]Midrange[/C][C]1.0302389705[/C][C][/C][C][/C][/ROW]
[ROW][C]Midmean - Weighted Average at Xnp[/C][C]1.00501230314706[/C][C][/C][C][/C][/ROW]
[ROW][C]Midmean - Weighted Average at X(n+1)p[/C][C]1.00660402357143[/C][C][/C][C][/C][/ROW]
[ROW][C]Midmean - Empirical Distribution Function[/C][C]1.00660402357143[/C][C][/C][C][/C][/ROW]
[ROW][C]Midmean - Empirical Distribution Function - Averaging[/C][C]1.00660402357143[/C][C][/C][C][/C][/ROW]
[ROW][C]Midmean - Empirical Distribution Function - Interpolation[/C][C]1.00660402357143[/C][C][/C][C][/C][/ROW]
[ROW][C]Midmean - Closest Observation[/C][C]1.00443278980556[/C][C][/C][C][/C][/ROW]
[ROW][C]Midmean - True Basic - Statistics Graphics Toolkit[/C][C]1.00660402357143[/C][C][/C][C][/C][/ROW]
[ROW][C]Midmean - MS Excel (old versions)[/C][C]1.00660402357143[/C][C][/C][C][/C][/ROW]
[ROW][C]Number of observations[/C][C]69[/C][C][/C][C][/C][/ROW]
[/TABLE]
Source: https://freestatistics.org/blog/index.php?pk=46955&T=1

Globally Unique Identifier (entire table): ba.freestatistics.org/blog/index.php?pk=46955&T=1

As an alternative you can also use a QR Code:  

The GUIDs for individual cells are displayed in the table below:

Central Tendency - Ungrouped Data
MeasureValueS.E.Value/S.E.
Arithmetic Mean1.005231765884060.0088121316333995114.073621196721
Geometric Mean1.00261134060415
Harmonic Mean1.00000000003222
Quadratic Mean1.00785482699109
Winsorized Mean ( 1 / 23 )1.005163048536230.00876036196426946114.739899177220
Winsorized Mean ( 2 / 23 )1.004565157927540.00853788518262427117.659717417137
Winsorized Mean ( 3 / 23 )1.003917912101450.00835416590864884120.169736042963
Winsorized Mean ( 4 / 23 )1.002952713028990.00811317655520843123.620225223019
Winsorized Mean ( 5 / 23 )1.002816904695650.0080302140552986124.880469909013
Winsorized Mean ( 6 / 23 )1.002779021130430.00801615055877951125.094833708202
Winsorized Mean ( 7 / 23 )1.002623573956520.00795163326727705126.090268534210
Winsorized Mean ( 8 / 23 )1.002309357260870.00784878151921724127.702542720393
Winsorized Mean ( 9 / 23 )1.002341880130430.00761760901529084131.582216692722
Winsorized Mean ( 10 / 23 )1.002562144188410.00747523169522959134.117868858594
Winsorized Mean ( 11 / 23 )1.001864052463770.00726959740294441137.815617142427
Winsorized Mean ( 12 / 23 )1.001568877159420.00699783975501653143.125437595427
Winsorized Mean ( 13 / 23 )1.001497123188410.00692270839813277144.668396470164
Winsorized Mean ( 14 / 23 )1.001967724057970.00671589891153526149.193389783903
Winsorized Mean ( 15 / 23 )1.001811294057970.00662428058727112151.233221609453
Winsorized Mean ( 16 / 23 )1.001111949826090.00651676460856514153.621008270009
Winsorized Mean ( 17 / 23 )1.001567480840580.00631233128705051158.668396079790
Winsorized Mean ( 18 / 23 )1.005976023623190.00552267281831535182.153833246644
Winsorized Mean ( 19 / 23 )1.007610523130430.00528109577575268190.795729885589
Winsorized Mean ( 20 / 23 )1.007788195884060.00483411086189311208.474365747043
Winsorized Mean ( 21 / 23 )1.007014133753620.00457369806089321220.175035681512
Winsorized Mean ( 22 / 23 )1.007437540971010.00445250842305115226.262916372127
Winsorized Mean ( 23 / 23 )1.008354806971010.00420201336609944239.969443007039
Trimmed Mean ( 1 / 23 )1.004485282164180.00852852149145712117.779533436171
Trimmed Mean ( 2 / 23 )1.003765807092310.00824980223658404121.671499304683
Trimmed Mean ( 3 / 23 )1.003328067349210.00805833058903873124.508178991065
Trimmed Mean ( 4 / 23 )1.003105666868850.00791043521868618126.807898571661
Trimmed Mean ( 5 / 23 )1.003150386423730.00781636315738039128.339787472199
Trimmed Mean ( 6 / 23 )1.003231124105260.00772264936780424129.907636139450
Trimmed Mean ( 7 / 23 )1.003325654727270.0076065646102681131.902600731595
Trimmed Mean ( 8 / 23 )1.003456230396230.00747530706072973134.236121973867
Trimmed Mean ( 9 / 23 )1.003650186882350.0073327887894471136.871552652211
Trimmed Mean ( 10 / 23 )1.003854887938780.0072045152150572139.336909975671
Trimmed Mean ( 11 / 23 )1.003854887938780.00706966214467896141.994747046623
Trimmed Mean ( 12 / 23 )1.004348639111110.00693784595416492144.763756034131
Trimmed Mean ( 13 / 23 )1.004720351465120.00682194247208138147.277751985876
Trimmed Mean ( 14 / 23 )1.005137617414630.00667884625606457150.495696244234
Trimmed Mean ( 15 / 23 )1.005538208333330.00653078555521017153.968952101195
Trimmed Mean ( 16 / 23 )1.006001554432430.00634500528803944158.550152247908
Trimmed Mean ( 17 / 23 )1.006604023571430.00610875292472836164.780608411362
Trimmed Mean ( 18 / 23 )1.007223491393940.00583113529424674172.731970802960
Trimmed Mean ( 19 / 23 )1.007377748161290.00567431835284878177.532821656990
Trimmed Mean ( 20 / 23 )1.007348598482760.00550777123696073182.895867519477
Trimmed Mean ( 21 / 23 )1.007292427703700.00538821295056276186.943693010221
Trimmed Mean ( 22 / 23 )1.007292427703700.00527216794024152191.058486588642
Trimmed Mean ( 23 / 23 )1.007314202913040.00510896698676115197.165925229757
Median1.015556854
Midrange1.0302389705
Midmean - Weighted Average at Xnp1.00501230314706
Midmean - Weighted Average at X(n+1)p1.00660402357143
Midmean - Empirical Distribution Function1.00660402357143
Midmean - Empirical Distribution Function - Averaging1.00660402357143
Midmean - Empirical Distribution Function - Interpolation1.00660402357143
Midmean - Closest Observation1.00443278980556
Midmean - True Basic - Statistics Graphics Toolkit1.00660402357143
Midmean - MS Excel (old versions)1.00660402357143
Number of observations69


Parameters (Session):
Parameters (R input):
R code (references can be found in the software module):
geomean <- function(x) {
return(exp(mean(log(x))))
}
harmean <- function(x) {
return(1/mean(1/x))
}
quamean <- function(x) {
return(sqrt(mean(x*x)))
}
winmean <- function(x) {
x <-sort(x[!is.na(x)])
n<-length(x)
denom <- 3
nodenom <- n/denom
if (nodenom>40) denom <- n/40
sqrtn = sqrt(n)
roundnodenom = floor(nodenom)
win <- array(NA,dim=c(roundnodenom,2))
for (j in 1:roundnodenom) {
win[j,1] <- (j*x[j+1]+sum(x[(j+1):(n-j)])+j*x[n-j])/n
win[j,2] <- sd(c(rep(x[j+1],j),x[(j+1):(n-j)],rep(x[n-j],j)))/sqrtn
}
return(win)
}
trimean <- function(x) {
x <-sort(x[!is.na(x)])
n<-length(x)
denom <- 3
nodenom <- n/denom
if (nodenom>40) denom <- n/40
sqrtn = sqrt(n)
roundnodenom = floor(nodenom)
tri <- array(NA,dim=c(roundnodenom,2))
for (j in 1:roundnodenom) {
tri[j,1] <- mean(x,trim=j/n)
tri[j,2] <- sd(x[(j+1):(n-j)]) / sqrt(n-j*2)
}
return(tri)
}
midrange <- function(x) {
return((max(x)+min(x))/2)
}
q1 <- function(data,n,p,i,f) {
np <- n*p;
i <<- floor(np)
f <<- np - i
qvalue <- (1-f)*data[i] + f*data[i+1]
}
q2 <- function(data,n,p,i,f) {
np <- (n+1)*p
i <<- floor(np)
f <<- np - i
qvalue <- (1-f)*data[i] + f*data[i+1]
}
q3 <- function(data,n,p,i,f) {
np <- n*p
i <<- floor(np)
f <<- np - i
if (f==0) {
qvalue <- data[i]
} else {
qvalue <- data[i+1]
}
}
q4 <- function(data,n,p,i,f) {
np <- n*p
i <<- floor(np)
f <<- np - i
if (f==0) {
qvalue <- (data[i]+data[i+1])/2
} else {
qvalue <- data[i+1]
}
}
q5 <- function(data,n,p,i,f) {
np <- (n-1)*p
i <<- floor(np)
f <<- np - i
if (f==0) {
qvalue <- data[i+1]
} else {
qvalue <- data[i+1] + f*(data[i+2]-data[i+1])
}
}
q6 <- function(data,n,p,i,f) {
np <- n*p+0.5
i <<- floor(np)
f <<- np - i
qvalue <- data[i]
}
q7 <- function(data,n,p,i,f) {
np <- (n+1)*p
i <<- floor(np)
f <<- np - i
if (f==0) {
qvalue <- data[i]
} else {
qvalue <- f*data[i] + (1-f)*data[i+1]
}
}
q8 <- function(data,n,p,i,f) {
np <- (n+1)*p
i <<- floor(np)
f <<- np - i
if (f==0) {
qvalue <- data[i]
} else {
if (f == 0.5) {
qvalue <- (data[i]+data[i+1])/2
} else {
if (f < 0.5) {
qvalue <- data[i]
} else {
qvalue <- data[i+1]
}
}
}
}
midmean <- function(x,def) {
x <-sort(x[!is.na(x)])
n<-length(x)
if (def==1) {
qvalue1 <- q1(x,n,0.25,i,f)
qvalue3 <- q1(x,n,0.75,i,f)
}
if (def==2) {
qvalue1 <- q2(x,n,0.25,i,f)
qvalue3 <- q2(x,n,0.75,i,f)
}
if (def==3) {
qvalue1 <- q3(x,n,0.25,i,f)
qvalue3 <- q3(x,n,0.75,i,f)
}
if (def==4) {
qvalue1 <- q4(x,n,0.25,i,f)
qvalue3 <- q4(x,n,0.75,i,f)
}
if (def==5) {
qvalue1 <- q5(x,n,0.25,i,f)
qvalue3 <- q5(x,n,0.75,i,f)
}
if (def==6) {
qvalue1 <- q6(x,n,0.25,i,f)
qvalue3 <- q6(x,n,0.75,i,f)
}
if (def==7) {
qvalue1 <- q7(x,n,0.25,i,f)
qvalue3 <- q7(x,n,0.75,i,f)
}
if (def==8) {
qvalue1 <- q8(x,n,0.25,i,f)
qvalue3 <- q8(x,n,0.75,i,f)
}
midm <- 0
myn <- 0
roundno4 <- round(n/4)
round3no4 <- round(3*n/4)
for (i in 1:n) {
if ((x[i]>=qvalue1) & (x[i]<=qvalue3)){
midm = midm + x[i]
myn = myn + 1
}
}
midm = midm / myn
return(midm)
}
(arm <- mean(x))
sqrtn <- sqrt(length(x))
(armse <- sd(x) / sqrtn)
(armose <- arm / armse)
(geo <- geomean(x))
(har <- harmean(x))
(qua <- quamean(x))
(win <- winmean(x))
(tri <- trimean(x))
(midr <- midrange(x))
midm <- array(NA,dim=8)
for (j in 1:8) midm[j] <- midmean(x,j)
midm
bitmap(file='test1.png')
lb <- win[,1] - 2*win[,2]
ub <- win[,1] + 2*win[,2]
if ((ylimmin == '') | (ylimmax == '')) plot(win[,1],type='b',main=main, xlab='j', pch=19, ylab='Winsorized Mean(j/n)', ylim=c(min(lb),max(ub))) else plot(win[,1],type='l',main=main, xlab='j', pch=19, ylab='Winsorized Mean(j/n)', ylim=c(ylimmin,ylimmax))
lines(ub,lty=3)
lines(lb,lty=3)
grid()
dev.off()
bitmap(file='test2.png')
lb <- tri[,1] - 2*tri[,2]
ub <- tri[,1] + 2*tri[,2]
if ((ylimmin == '') | (ylimmax == '')) plot(tri[,1],type='b',main=main, xlab='j', pch=19, ylab='Trimmed Mean(j/n)', ylim=c(min(lb),max(ub))) else plot(tri[,1],type='l',main=main, xlab='j', pch=19, ylab='Trimmed Mean(j/n)', ylim=c(ylimmin,ylimmax))
lines(ub,lty=3)
lines(lb,lty=3)
grid()
dev.off()
load(file='createtable')
a<-table.start()
a<-table.row.start(a)
a<-table.element(a,'Central Tendency - Ungrouped Data',4,TRUE)
a<-table.row.end(a)
a<-table.row.start(a)
a<-table.element(a,'Measure',header=TRUE)
a<-table.element(a,'Value',header=TRUE)
a<-table.element(a,'S.E.',header=TRUE)
a<-table.element(a,'Value/S.E.',header=TRUE)
a<-table.row.end(a)
a<-table.row.start(a)
a<-table.element(a,hyperlink('arithmetic_mean.htm', 'Arithmetic Mean', 'click to view the definition of the Arithmetic Mean'),header=TRUE)
a<-table.element(a,arm)
a<-table.element(a,hyperlink('arithmetic_mean_standard_error.htm', armse, 'click to view the definition of the Standard Error of the Arithmetic Mean'))
a<-table.element(a,armose)
a<-table.row.end(a)
a<-table.row.start(a)
a<-table.element(a,hyperlink('geometric_mean.htm', 'Geometric Mean', 'click to view the definition of the Geometric Mean'),header=TRUE)
a<-table.element(a,geo)
a<-table.element(a,'')
a<-table.row.end(a)
a<-table.row.start(a)
a<-table.element(a,hyperlink('harmonic_mean.htm', 'Harmonic Mean', 'click to view the definition of the Harmonic Mean'),header=TRUE)
a<-table.element(a,har)
a<-table.element(a,'')
a<-table.row.end(a)
a<-table.row.start(a)
a<-table.element(a,hyperlink('quadratic_mean.htm', 'Quadratic Mean', 'click to view the definition of the Quadratic Mean'),header=TRUE)
a<-table.element(a,qua)
a<-table.element(a,'')
a<-table.row.end(a)
for (j in 1:length(win[,1])) {
a<-table.row.start(a)
mylabel <- paste('Winsorized Mean (',j)
mylabel <- paste(mylabel,'/')
mylabel <- paste(mylabel,length(win[,1]))
mylabel <- paste(mylabel,')')
a<-table.element(a,hyperlink('winsorized_mean.htm', mylabel, 'click to view the definition of the Winsorized Mean'),header=TRUE)
a<-table.element(a,win[j,1])
a<-table.element(a,win[j,2])
a<-table.element(a,win[j,1]/win[j,2])
a<-table.row.end(a)
}
for (j in 1:length(tri[,1])) {
a<-table.row.start(a)
mylabel <- paste('Trimmed Mean (',j)
mylabel <- paste(mylabel,'/')
mylabel <- paste(mylabel,length(tri[,1]))
mylabel <- paste(mylabel,')')
a<-table.element(a,hyperlink('arithmetic_mean.htm', mylabel, 'click to view the definition of the Trimmed Mean'),header=TRUE)
a<-table.element(a,tri[j,1])
a<-table.element(a,tri[j,2])
a<-table.element(a,tri[j,1]/tri[j,2])
a<-table.row.end(a)
}
a<-table.row.start(a)
a<-table.element(a,hyperlink('median_1.htm', 'Median', 'click to view the definition of the Median'),header=TRUE)
a<-table.element(a,median(x))
a<-table.element(a,'')
a<-table.row.end(a)
a<-table.row.start(a)
a<-table.element(a,hyperlink('midrange.htm', 'Midrange', 'click to view the definition of the Midrange'),header=TRUE)
a<-table.element(a,midr)
a<-table.element(a,'')
a<-table.row.end(a)
a<-table.row.start(a)
mymid <- hyperlink('midmean.htm', 'Midmean', 'click to view the definition of the Midmean')
mylabel <- paste(mymid,hyperlink('method_1.htm','Weighted Average at Xnp',''),sep=' - ')
a<-table.element(a,mylabel,header=TRUE)
a<-table.element(a,midm[1])
a<-table.element(a,'')
a<-table.row.end(a)
a<-table.row.start(a)
mymid <- hyperlink('midmean.htm', 'Midmean', 'click to view the definition of the Midmean')
mylabel <- paste(mymid,hyperlink('method_2.htm','Weighted Average at X(n+1)p',''),sep=' - ')
a<-table.element(a,mylabel,header=TRUE)
a<-table.element(a,midm[2])
a<-table.element(a,'')
a<-table.row.end(a)
a<-table.row.start(a)
mymid <- hyperlink('midmean.htm', 'Midmean', 'click to view the definition of the Midmean')
mylabel <- paste(mymid,hyperlink('method_3.htm','Empirical Distribution Function',''),sep=' - ')
a<-table.element(a,mylabel,header=TRUE)
a<-table.element(a,midm[3])
a<-table.element(a,'')
a<-table.row.end(a)
a<-table.row.start(a)
mymid <- hyperlink('midmean.htm', 'Midmean', 'click to view the definition of the Midmean')
mylabel <- paste(mymid,hyperlink('method_4.htm','Empirical Distribution Function - Averaging',''),sep=' - ')
a<-table.element(a,mylabel,header=TRUE)
a<-table.element(a,midm[4])
a<-table.element(a,'')
a<-table.row.end(a)
a<-table.row.start(a)
mymid <- hyperlink('midmean.htm', 'Midmean', 'click to view the definition of the Midmean')
mylabel <- paste(mymid,hyperlink('method_5.htm','Empirical Distribution Function - Interpolation',''),sep=' - ')
a<-table.element(a,mylabel,header=TRUE)
a<-table.element(a,midm[5])
a<-table.element(a,'')
a<-table.row.end(a)
a<-table.row.start(a)
mymid <- hyperlink('midmean.htm', 'Midmean', 'click to view the definition of the Midmean')
mylabel <- paste(mymid,hyperlink('method_6.htm','Closest Observation',''),sep=' - ')
a<-table.element(a,mylabel,header=TRUE)
a<-table.element(a,midm[6])
a<-table.element(a,'')
a<-table.row.end(a)
a<-table.row.start(a)
mymid <- hyperlink('midmean.htm', 'Midmean', 'click to view the definition of the Midmean')
mylabel <- paste(mymid,hyperlink('method_7.htm','True Basic - Statistics Graphics Toolkit',''),sep=' - ')
a<-table.element(a,mylabel,header=TRUE)
a<-table.element(a,midm[7])
a<-table.element(a,'')
a<-table.row.end(a)
a<-table.row.start(a)
mymid <- hyperlink('midmean.htm', 'Midmean', 'click to view the definition of the Midmean')
mylabel <- paste(mymid,hyperlink('method_8.htm','MS Excel (old versions)',''),sep=' - ')
a<-table.element(a,mylabel,header=TRUE)
a<-table.element(a,midm[8])
a<-table.element(a,'')
a<-table.row.end(a)
a<-table.row.start(a)
a<-table.element(a,'Number of observations',header=TRUE)
a<-table.element(a,length(x))
a<-table.element(a,'')
a<-table.row.end(a)
a<-table.end(a)
table.save(a,file='mytable.tab')