Free Statistics

of Irreproducible Research!

Author's title

Author*The author of this computation has been verified*
R Software Modulerwasp_centraltendency.wasp
Title produced by softwareCentral Tendency
Date of computationMon, 19 Oct 2009 11:56:20 -0600
Cite this page as followsStatistical Computations at FreeStatistics.org, Office for Research Development and Education, URL https://freestatistics.org/blog/index.php?v=date/2009/Oct/19/t12559751064loo3hee2vs4gvl.htm/, Retrieved Mon, 29 Apr 2024 22:24:02 +0000
Statistical Computations at FreeStatistics.org, Office for Research Development and Education, URL https://freestatistics.org/blog/index.php?pk=48018, Retrieved Mon, 29 Apr 2024 22:24:02 +0000
QR Codes:

Original text written by user:
IsPrivate?No (this computation is public)
User-defined keywords
Estimated Impact134
Family? (F = Feedback message, R = changed R code, M = changed R Module, P = changed Parameters, D = changed Data)
-     [Univariate Data Series] [workshop 2] [2009-10-12 17:39:18] [1b6701091a97b7b3d9950959168c4b49]
- RMP     [Central Tendency] [] [2009-10-19 17:56:20] [cb82301097eb8d3ffcb3e8446bdec236] [Current]
Feedback Forum

Post a new message
Dataseries X:
1027387
1032760
1026564
1031480
1039048
1029781
1036585
1039113
1038981
1048472
1050976
1058369
1063014
1069895
1068642
1068381
1071410
1075303
1074652
1076742
1058112
1070165
1082079
1089077
1089392
1089298
1091254
1095112
1094153
1098756
1101085
1103418
1099897
1098269
1095835
1105013
1099386
1108399
1106298
1110539
1111430
1111951
1115406
1116142
1120071
1114196
1120541
1123962
1123389
1120435
1116495
1110012
1106820
1104494
1103760
1091570
1048367
1061626
1047607
1023650
1001154
993397
977486
971751
961207
957734
966893
974422


Summary of computational transaction
Raw Inputview raw input (R code)
Raw Outputview raw output of R engine
Computing time1 seconds
R Server'Gwilym Jenkins' @ 72.249.127.135

\begin{tabular}{lllllllll}
\hline
Summary of computational transaction \tabularnewline
Raw Input & view raw input (R code)  \tabularnewline
Raw Output & view raw output of R engine  \tabularnewline
Computing time & 1 seconds \tabularnewline
R Server & 'Gwilym Jenkins' @ 72.249.127.135 \tabularnewline
\hline
\end{tabular}
%Source: https://freestatistics.org/blog/index.php?pk=48018&T=0

[TABLE]
[ROW][C]Summary of computational transaction[/C][/ROW]
[ROW][C]Raw Input[/C][C]view raw input (R code) [/C][/ROW]
[ROW][C]Raw Output[/C][C]view raw output of R engine [/C][/ROW]
[ROW][C]Computing time[/C][C]1 seconds[/C][/ROW]
[ROW][C]R Server[/C][C]'Gwilym Jenkins' @ 72.249.127.135[/C][/ROW]
[/TABLE]
Source: https://freestatistics.org/blog/index.php?pk=48018&T=0

Globally Unique Identifier (entire table): ba.freestatistics.org/blog/index.php?pk=48018&T=0

As an alternative you can also use a QR Code:  

The GUIDs for individual cells are displayed in the table below:

Summary of computational transaction
Raw Inputview raw input (R code)
Raw Outputview raw output of R engine
Computing time1 seconds
R Server'Gwilym Jenkins' @ 72.249.127.135


Central Tendency - Ungrouped Data
MeasureValueS.E.Value/S.E.
Arithmetic Mean1069250.882352945448.08312640398196.261851653997
Geometric Mean1068294.75127949
Harmonic Mean1067311.89450500
Quadratic Mean1070180.41341913
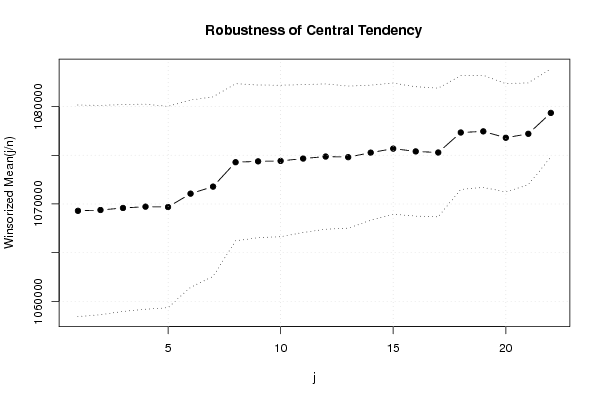
Winsorized Mean ( 1 / 22 )1069293.529411765431.43844031535196.871149542050
Winsorized Mean ( 2 / 22 )10693775370.59882088653199.11690216762
Winsorized Mean ( 3 / 22 )1069586.647058825309.93570529489201.431186067332
Winsorized Mean ( 4 / 22 )1069722.352941185264.04457148258203.213012050902
Winsorized Mean ( 5 / 22 )1069684.705882355167.04764351299207.020484362148
Winsorized Mean ( 6 / 22 )1071057.470588244805.87637931451222.864132585326
Winsorized Mean ( 7 / 22 )1071780.220588244607.47573387114232.617659320311
Winsorized Mean ( 8 / 22 )1074284.455882354032.54099979505266.403852046874
Winsorized Mean ( 9 / 22 )10743733918.04274187113274.211658928180
Winsorized Mean ( 10 / 22 )1074417.411764713885.15666434604276.544166577529
Winsorized Mean ( 11 / 22 )1074660.544117653795.57518266558283.135096104967
Winsorized Mean ( 12 / 22 )1074867.367647063729.98849701204288.169083767442
Winsorized Mean ( 13 / 22 )1074803.705882353644.77932704717294.888554131783
Winsorized Mean ( 14 / 22 )1075266.117647063466.91368970141310.150818245396
Winsorized Mean ( 15 / 22 )1075679.53364.22476419864319.740675904639
Winsorized Mean ( 16 / 22 )1075392.911764713320.99097659253323.816872537276
Winsorized Mean ( 17 / 22 )1075279.411764713301.12966459039325.730740994122
Winsorized Mean ( 18 / 22 )1077333.529411762919.73324431213368.983547216341
Winsorized Mean ( 19 / 22 )1077450.323529412874.66872927837374.808517084291
Winsorized Mean ( 20 / 22 )1076795.029411762778.94751411448387.483039511413
Winsorized Mean ( 21 / 22 )1077201.441176472614.51353643723412.008362612787
Winsorized Mean ( 22 / 22 )1079344.823529412257.18774423056478.181235162316
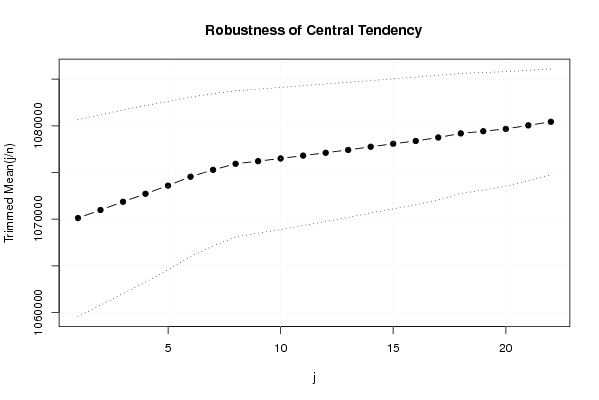
Trimmed Mean ( 1 / 22 )1070111.575757585283.37323023889202.543248247709
Trimmed Mean ( 2 / 22 )1070980.755103.20471980131209.864351677763
Trimmed Mean ( 3 / 22 )1071860.225806454923.14616264567217.718546310727
Trimmed Mean ( 4 / 22 )1072719.133333334731.19522389336226.733221219855
Trimmed Mean ( 5 / 22 )1073597.54511.55748035175237.966047130202
Trimmed Mean ( 6 / 22 )1074547.754270.20180826143251.638634015166
Trimmed Mean ( 7 / 22 )1075280.277777784087.53530576833263.063239175045
Trimmed Mean ( 8 / 22 )1075934.134615383917.08598721594274.677180467029
Trimmed Mean ( 9 / 22 )1076214.583859.23723785318278.867173399964
Trimmed Mean ( 10 / 22 )1076504.458333333809.70725639066282.568813267090
Trimmed Mean ( 11 / 22 )1076812.978260873749.82077877548287.163851764805
Trimmed Mean ( 12 / 22 )1077115.386363643689.38805224075291.949605493369
Trimmed Mean ( 13 / 22 )1077418.690476193621.49970434637297.506220746924
Trimmed Mean ( 14 / 22 )1077760.653546.90387205915303.859560020810
Trimmed Mean ( 15 / 22 )1078079.53485.5808432344309.296943174501
Trimmed Mean ( 16 / 22 )1078381.722222223421.87342650218315.143661910528
Trimmed Mean ( 17 / 22 )1078755.323529413336.78547418765323.291782427828
Trimmed Mean ( 18 / 22 )1079189.81253214.83265205528335.690821047889
Trimmed Mean ( 19 / 22 )1079423.566666673153.11566392301342.335544178447
Trimmed Mean ( 20 / 22 )1079675.785714293066.20856454063352.12079119479
Trimmed Mean ( 21 / 22 )1080052.52953.98442173383365.625658704749
Trimmed Mean ( 22 / 22 )1080437.166666672832.62479461244381.426148892584
Median1079410.5
Midrange1040848
Midmean - Weighted Average at Xnp1077620.82857143
Midmean - Weighted Average at X(n+1)p1078755.32352941
Midmean - Empirical Distribution Function1077620.82857143
Midmean - Empirical Distribution Function - Averaging1078755.32352941
Midmean - Empirical Distribution Function - Interpolation1078755.32352941
Midmean - Closest Observation1077620.82857143
Midmean - True Basic - Statistics Graphics Toolkit1078755.32352941
Midmean - MS Excel (old versions)1078381.72222222
Number of observations68

\begin{tabular}{lllllllll}
\hline
Central Tendency - Ungrouped Data \tabularnewline
Measure & Value & S.E. & Value/S.E. \tabularnewline
Arithmetic Mean & 1069250.88235294 & 5448.08312640398 & 196.261851653997 \tabularnewline
Geometric Mean & 1068294.75127949 &  &  \tabularnewline
Harmonic Mean & 1067311.89450500 &  &  \tabularnewline
Quadratic Mean & 1070180.41341913 &  &  \tabularnewline
Winsorized Mean ( 1 / 22 ) & 1069293.52941176 & 5431.43844031535 & 196.871149542050 \tabularnewline
Winsorized Mean ( 2 / 22 ) & 1069377 & 5370.59882088653 & 199.11690216762 \tabularnewline
Winsorized Mean ( 3 / 22 ) & 1069586.64705882 & 5309.93570529489 & 201.431186067332 \tabularnewline
Winsorized Mean ( 4 / 22 ) & 1069722.35294118 & 5264.04457148258 & 203.213012050902 \tabularnewline
Winsorized Mean ( 5 / 22 ) & 1069684.70588235 & 5167.04764351299 & 207.020484362148 \tabularnewline
Winsorized Mean ( 6 / 22 ) & 1071057.47058824 & 4805.87637931451 & 222.864132585326 \tabularnewline
Winsorized Mean ( 7 / 22 ) & 1071780.22058824 & 4607.47573387114 & 232.617659320311 \tabularnewline
Winsorized Mean ( 8 / 22 ) & 1074284.45588235 & 4032.54099979505 & 266.403852046874 \tabularnewline
Winsorized Mean ( 9 / 22 ) & 1074373 & 3918.04274187113 & 274.211658928180 \tabularnewline
Winsorized Mean ( 10 / 22 ) & 1074417.41176471 & 3885.15666434604 & 276.544166577529 \tabularnewline
Winsorized Mean ( 11 / 22 ) & 1074660.54411765 & 3795.57518266558 & 283.135096104967 \tabularnewline
Winsorized Mean ( 12 / 22 ) & 1074867.36764706 & 3729.98849701204 & 288.169083767442 \tabularnewline
Winsorized Mean ( 13 / 22 ) & 1074803.70588235 & 3644.77932704717 & 294.888554131783 \tabularnewline
Winsorized Mean ( 14 / 22 ) & 1075266.11764706 & 3466.91368970141 & 310.150818245396 \tabularnewline
Winsorized Mean ( 15 / 22 ) & 1075679.5 & 3364.22476419864 & 319.740675904639 \tabularnewline
Winsorized Mean ( 16 / 22 ) & 1075392.91176471 & 3320.99097659253 & 323.816872537276 \tabularnewline
Winsorized Mean ( 17 / 22 ) & 1075279.41176471 & 3301.12966459039 & 325.730740994122 \tabularnewline
Winsorized Mean ( 18 / 22 ) & 1077333.52941176 & 2919.73324431213 & 368.983547216341 \tabularnewline
Winsorized Mean ( 19 / 22 ) & 1077450.32352941 & 2874.66872927837 & 374.808517084291 \tabularnewline
Winsorized Mean ( 20 / 22 ) & 1076795.02941176 & 2778.94751411448 & 387.483039511413 \tabularnewline
Winsorized Mean ( 21 / 22 ) & 1077201.44117647 & 2614.51353643723 & 412.008362612787 \tabularnewline
Winsorized Mean ( 22 / 22 ) & 1079344.82352941 & 2257.18774423056 & 478.181235162316 \tabularnewline
Trimmed Mean ( 1 / 22 ) & 1070111.57575758 & 5283.37323023889 & 202.543248247709 \tabularnewline
Trimmed Mean ( 2 / 22 ) & 1070980.75 & 5103.20471980131 & 209.864351677763 \tabularnewline
Trimmed Mean ( 3 / 22 ) & 1071860.22580645 & 4923.14616264567 & 217.718546310727 \tabularnewline
Trimmed Mean ( 4 / 22 ) & 1072719.13333333 & 4731.19522389336 & 226.733221219855 \tabularnewline
Trimmed Mean ( 5 / 22 ) & 1073597.5 & 4511.55748035175 & 237.966047130202 \tabularnewline
Trimmed Mean ( 6 / 22 ) & 1074547.75 & 4270.20180826143 & 251.638634015166 \tabularnewline
Trimmed Mean ( 7 / 22 ) & 1075280.27777778 & 4087.53530576833 & 263.063239175045 \tabularnewline
Trimmed Mean ( 8 / 22 ) & 1075934.13461538 & 3917.08598721594 & 274.677180467029 \tabularnewline
Trimmed Mean ( 9 / 22 ) & 1076214.58 & 3859.23723785318 & 278.867173399964 \tabularnewline
Trimmed Mean ( 10 / 22 ) & 1076504.45833333 & 3809.70725639066 & 282.568813267090 \tabularnewline
Trimmed Mean ( 11 / 22 ) & 1076812.97826087 & 3749.82077877548 & 287.163851764805 \tabularnewline
Trimmed Mean ( 12 / 22 ) & 1077115.38636364 & 3689.38805224075 & 291.949605493369 \tabularnewline
Trimmed Mean ( 13 / 22 ) & 1077418.69047619 & 3621.49970434637 & 297.506220746924 \tabularnewline
Trimmed Mean ( 14 / 22 ) & 1077760.65 & 3546.90387205915 & 303.859560020810 \tabularnewline
Trimmed Mean ( 15 / 22 ) & 1078079.5 & 3485.5808432344 & 309.296943174501 \tabularnewline
Trimmed Mean ( 16 / 22 ) & 1078381.72222222 & 3421.87342650218 & 315.143661910528 \tabularnewline
Trimmed Mean ( 17 / 22 ) & 1078755.32352941 & 3336.78547418765 & 323.291782427828 \tabularnewline
Trimmed Mean ( 18 / 22 ) & 1079189.8125 & 3214.83265205528 & 335.690821047889 \tabularnewline
Trimmed Mean ( 19 / 22 ) & 1079423.56666667 & 3153.11566392301 & 342.335544178447 \tabularnewline
Trimmed Mean ( 20 / 22 ) & 1079675.78571429 & 3066.20856454063 & 352.12079119479 \tabularnewline
Trimmed Mean ( 21 / 22 ) & 1080052.5 & 2953.98442173383 & 365.625658704749 \tabularnewline
Trimmed Mean ( 22 / 22 ) & 1080437.16666667 & 2832.62479461244 & 381.426148892584 \tabularnewline
Median & 1079410.5 &  &  \tabularnewline
Midrange & 1040848 &  &  \tabularnewline
Midmean - Weighted Average at Xnp & 1077620.82857143 &  &  \tabularnewline
Midmean - Weighted Average at X(n+1)p & 1078755.32352941 &  &  \tabularnewline
Midmean - Empirical Distribution Function & 1077620.82857143 &  &  \tabularnewline
Midmean - Empirical Distribution Function - Averaging & 1078755.32352941 &  &  \tabularnewline
Midmean - Empirical Distribution Function - Interpolation & 1078755.32352941 &  &  \tabularnewline
Midmean - Closest Observation & 1077620.82857143 &  &  \tabularnewline
Midmean - True Basic - Statistics Graphics Toolkit & 1078755.32352941 &  &  \tabularnewline
Midmean - MS Excel (old versions) & 1078381.72222222 &  &  \tabularnewline
Number of observations & 68 &  &  \tabularnewline
\hline
\end{tabular}
%Source: https://freestatistics.org/blog/index.php?pk=48018&T=1

[TABLE]
[ROW][C]Central Tendency - Ungrouped Data[/C][/ROW]
[ROW][C]Measure[/C][C]Value[/C][C]S.E.[/C][C]Value/S.E.[/C][/ROW]
[ROW][C]Arithmetic Mean[/C][C]1069250.88235294[/C][C]5448.08312640398[/C][C]196.261851653997[/C][/ROW]
[ROW][C]Geometric Mean[/C][C]1068294.75127949[/C][C][/C][C][/C][/ROW]
[ROW][C]Harmonic Mean[/C][C]1067311.89450500[/C][C][/C][C][/C][/ROW]
[ROW][C]Quadratic Mean[/C][C]1070180.41341913[/C][C][/C][C][/C][/ROW]
[ROW][C]Winsorized Mean ( 1 / 22 )[/C][C]1069293.52941176[/C][C]5431.43844031535[/C][C]196.871149542050[/C][/ROW]
[ROW][C]Winsorized Mean ( 2 / 22 )[/C][C]1069377[/C][C]5370.59882088653[/C][C]199.11690216762[/C][/ROW]
[ROW][C]Winsorized Mean ( 3 / 22 )[/C][C]1069586.64705882[/C][C]5309.93570529489[/C][C]201.431186067332[/C][/ROW]
[ROW][C]Winsorized Mean ( 4 / 22 )[/C][C]1069722.35294118[/C][C]5264.04457148258[/C][C]203.213012050902[/C][/ROW]
[ROW][C]Winsorized Mean ( 5 / 22 )[/C][C]1069684.70588235[/C][C]5167.04764351299[/C][C]207.020484362148[/C][/ROW]
[ROW][C]Winsorized Mean ( 6 / 22 )[/C][C]1071057.47058824[/C][C]4805.87637931451[/C][C]222.864132585326[/C][/ROW]
[ROW][C]Winsorized Mean ( 7 / 22 )[/C][C]1071780.22058824[/C][C]4607.47573387114[/C][C]232.617659320311[/C][/ROW]
[ROW][C]Winsorized Mean ( 8 / 22 )[/C][C]1074284.45588235[/C][C]4032.54099979505[/C][C]266.403852046874[/C][/ROW]
[ROW][C]Winsorized Mean ( 9 / 22 )[/C][C]1074373[/C][C]3918.04274187113[/C][C]274.211658928180[/C][/ROW]
[ROW][C]Winsorized Mean ( 10 / 22 )[/C][C]1074417.41176471[/C][C]3885.15666434604[/C][C]276.544166577529[/C][/ROW]
[ROW][C]Winsorized Mean ( 11 / 22 )[/C][C]1074660.54411765[/C][C]3795.57518266558[/C][C]283.135096104967[/C][/ROW]
[ROW][C]Winsorized Mean ( 12 / 22 )[/C][C]1074867.36764706[/C][C]3729.98849701204[/C][C]288.169083767442[/C][/ROW]
[ROW][C]Winsorized Mean ( 13 / 22 )[/C][C]1074803.70588235[/C][C]3644.77932704717[/C][C]294.888554131783[/C][/ROW]
[ROW][C]Winsorized Mean ( 14 / 22 )[/C][C]1075266.11764706[/C][C]3466.91368970141[/C][C]310.150818245396[/C][/ROW]
[ROW][C]Winsorized Mean ( 15 / 22 )[/C][C]1075679.5[/C][C]3364.22476419864[/C][C]319.740675904639[/C][/ROW]
[ROW][C]Winsorized Mean ( 16 / 22 )[/C][C]1075392.91176471[/C][C]3320.99097659253[/C][C]323.816872537276[/C][/ROW]
[ROW][C]Winsorized Mean ( 17 / 22 )[/C][C]1075279.41176471[/C][C]3301.12966459039[/C][C]325.730740994122[/C][/ROW]
[ROW][C]Winsorized Mean ( 18 / 22 )[/C][C]1077333.52941176[/C][C]2919.73324431213[/C][C]368.983547216341[/C][/ROW]
[ROW][C]Winsorized Mean ( 19 / 22 )[/C][C]1077450.32352941[/C][C]2874.66872927837[/C][C]374.808517084291[/C][/ROW]
[ROW][C]Winsorized Mean ( 20 / 22 )[/C][C]1076795.02941176[/C][C]2778.94751411448[/C][C]387.483039511413[/C][/ROW]
[ROW][C]Winsorized Mean ( 21 / 22 )[/C][C]1077201.44117647[/C][C]2614.51353643723[/C][C]412.008362612787[/C][/ROW]
[ROW][C]Winsorized Mean ( 22 / 22 )[/C][C]1079344.82352941[/C][C]2257.18774423056[/C][C]478.181235162316[/C][/ROW]
[ROW][C]Trimmed Mean ( 1 / 22 )[/C][C]1070111.57575758[/C][C]5283.37323023889[/C][C]202.543248247709[/C][/ROW]
[ROW][C]Trimmed Mean ( 2 / 22 )[/C][C]1070980.75[/C][C]5103.20471980131[/C][C]209.864351677763[/C][/ROW]
[ROW][C]Trimmed Mean ( 3 / 22 )[/C][C]1071860.22580645[/C][C]4923.14616264567[/C][C]217.718546310727[/C][/ROW]
[ROW][C]Trimmed Mean ( 4 / 22 )[/C][C]1072719.13333333[/C][C]4731.19522389336[/C][C]226.733221219855[/C][/ROW]
[ROW][C]Trimmed Mean ( 5 / 22 )[/C][C]1073597.5[/C][C]4511.55748035175[/C][C]237.966047130202[/C][/ROW]
[ROW][C]Trimmed Mean ( 6 / 22 )[/C][C]1074547.75[/C][C]4270.20180826143[/C][C]251.638634015166[/C][/ROW]
[ROW][C]Trimmed Mean ( 7 / 22 )[/C][C]1075280.27777778[/C][C]4087.53530576833[/C][C]263.063239175045[/C][/ROW]
[ROW][C]Trimmed Mean ( 8 / 22 )[/C][C]1075934.13461538[/C][C]3917.08598721594[/C][C]274.677180467029[/C][/ROW]
[ROW][C]Trimmed Mean ( 9 / 22 )[/C][C]1076214.58[/C][C]3859.23723785318[/C][C]278.867173399964[/C][/ROW]
[ROW][C]Trimmed Mean ( 10 / 22 )[/C][C]1076504.45833333[/C][C]3809.70725639066[/C][C]282.568813267090[/C][/ROW]
[ROW][C]Trimmed Mean ( 11 / 22 )[/C][C]1076812.97826087[/C][C]3749.82077877548[/C][C]287.163851764805[/C][/ROW]
[ROW][C]Trimmed Mean ( 12 / 22 )[/C][C]1077115.38636364[/C][C]3689.38805224075[/C][C]291.949605493369[/C][/ROW]
[ROW][C]Trimmed Mean ( 13 / 22 )[/C][C]1077418.69047619[/C][C]3621.49970434637[/C][C]297.506220746924[/C][/ROW]
[ROW][C]Trimmed Mean ( 14 / 22 )[/C][C]1077760.65[/C][C]3546.90387205915[/C][C]303.859560020810[/C][/ROW]
[ROW][C]Trimmed Mean ( 15 / 22 )[/C][C]1078079.5[/C][C]3485.5808432344[/C][C]309.296943174501[/C][/ROW]
[ROW][C]Trimmed Mean ( 16 / 22 )[/C][C]1078381.72222222[/C][C]3421.87342650218[/C][C]315.143661910528[/C][/ROW]
[ROW][C]Trimmed Mean ( 17 / 22 )[/C][C]1078755.32352941[/C][C]3336.78547418765[/C][C]323.291782427828[/C][/ROW]
[ROW][C]Trimmed Mean ( 18 / 22 )[/C][C]1079189.8125[/C][C]3214.83265205528[/C][C]335.690821047889[/C][/ROW]
[ROW][C]Trimmed Mean ( 19 / 22 )[/C][C]1079423.56666667[/C][C]3153.11566392301[/C][C]342.335544178447[/C][/ROW]
[ROW][C]Trimmed Mean ( 20 / 22 )[/C][C]1079675.78571429[/C][C]3066.20856454063[/C][C]352.12079119479[/C][/ROW]
[ROW][C]Trimmed Mean ( 21 / 22 )[/C][C]1080052.5[/C][C]2953.98442173383[/C][C]365.625658704749[/C][/ROW]
[ROW][C]Trimmed Mean ( 22 / 22 )[/C][C]1080437.16666667[/C][C]2832.62479461244[/C][C]381.426148892584[/C][/ROW]
[ROW][C]Median[/C][C]1079410.5[/C][C][/C][C][/C][/ROW]
[ROW][C]Midrange[/C][C]1040848[/C][C][/C][C][/C][/ROW]
[ROW][C]Midmean - Weighted Average at Xnp[/C][C]1077620.82857143[/C][C][/C][C][/C][/ROW]
[ROW][C]Midmean - Weighted Average at X(n+1)p[/C][C]1078755.32352941[/C][C][/C][C][/C][/ROW]
[ROW][C]Midmean - Empirical Distribution Function[/C][C]1077620.82857143[/C][C][/C][C][/C][/ROW]
[ROW][C]Midmean - Empirical Distribution Function - Averaging[/C][C]1078755.32352941[/C][C][/C][C][/C][/ROW]
[ROW][C]Midmean - Empirical Distribution Function - Interpolation[/C][C]1078755.32352941[/C][C][/C][C][/C][/ROW]
[ROW][C]Midmean - Closest Observation[/C][C]1077620.82857143[/C][C][/C][C][/C][/ROW]
[ROW][C]Midmean - True Basic - Statistics Graphics Toolkit[/C][C]1078755.32352941[/C][C][/C][C][/C][/ROW]
[ROW][C]Midmean - MS Excel (old versions)[/C][C]1078381.72222222[/C][C][/C][C][/C][/ROW]
[ROW][C]Number of observations[/C][C]68[/C][C][/C][C][/C][/ROW]
[/TABLE]
Source: https://freestatistics.org/blog/index.php?pk=48018&T=1

Globally Unique Identifier (entire table): ba.freestatistics.org/blog/index.php?pk=48018&T=1

As an alternative you can also use a QR Code:  

The GUIDs for individual cells are displayed in the table below:

Central Tendency - Ungrouped Data
MeasureValueS.E.Value/S.E.
Arithmetic Mean1069250.882352945448.08312640398196.261851653997
Geometric Mean1068294.75127949
Harmonic Mean1067311.89450500
Quadratic Mean1070180.41341913
Winsorized Mean ( 1 / 22 )1069293.529411765431.43844031535196.871149542050
Winsorized Mean ( 2 / 22 )10693775370.59882088653199.11690216762
Winsorized Mean ( 3 / 22 )1069586.647058825309.93570529489201.431186067332
Winsorized Mean ( 4 / 22 )1069722.352941185264.04457148258203.213012050902
Winsorized Mean ( 5 / 22 )1069684.705882355167.04764351299207.020484362148
Winsorized Mean ( 6 / 22 )1071057.470588244805.87637931451222.864132585326
Winsorized Mean ( 7 / 22 )1071780.220588244607.47573387114232.617659320311
Winsorized Mean ( 8 / 22 )1074284.455882354032.54099979505266.403852046874
Winsorized Mean ( 9 / 22 )10743733918.04274187113274.211658928180
Winsorized Mean ( 10 / 22 )1074417.411764713885.15666434604276.544166577529
Winsorized Mean ( 11 / 22 )1074660.544117653795.57518266558283.135096104967
Winsorized Mean ( 12 / 22 )1074867.367647063729.98849701204288.169083767442
Winsorized Mean ( 13 / 22 )1074803.705882353644.77932704717294.888554131783
Winsorized Mean ( 14 / 22 )1075266.117647063466.91368970141310.150818245396
Winsorized Mean ( 15 / 22 )1075679.53364.22476419864319.740675904639
Winsorized Mean ( 16 / 22 )1075392.911764713320.99097659253323.816872537276
Winsorized Mean ( 17 / 22 )1075279.411764713301.12966459039325.730740994122
Winsorized Mean ( 18 / 22 )1077333.529411762919.73324431213368.983547216341
Winsorized Mean ( 19 / 22 )1077450.323529412874.66872927837374.808517084291
Winsorized Mean ( 20 / 22 )1076795.029411762778.94751411448387.483039511413
Winsorized Mean ( 21 / 22 )1077201.441176472614.51353643723412.008362612787
Winsorized Mean ( 22 / 22 )1079344.823529412257.18774423056478.181235162316
Trimmed Mean ( 1 / 22 )1070111.575757585283.37323023889202.543248247709
Trimmed Mean ( 2 / 22 )1070980.755103.20471980131209.864351677763
Trimmed Mean ( 3 / 22 )1071860.225806454923.14616264567217.718546310727
Trimmed Mean ( 4 / 22 )1072719.133333334731.19522389336226.733221219855
Trimmed Mean ( 5 / 22 )1073597.54511.55748035175237.966047130202
Trimmed Mean ( 6 / 22 )1074547.754270.20180826143251.638634015166
Trimmed Mean ( 7 / 22 )1075280.277777784087.53530576833263.063239175045
Trimmed Mean ( 8 / 22 )1075934.134615383917.08598721594274.677180467029
Trimmed Mean ( 9 / 22 )1076214.583859.23723785318278.867173399964
Trimmed Mean ( 10 / 22 )1076504.458333333809.70725639066282.568813267090
Trimmed Mean ( 11 / 22 )1076812.978260873749.82077877548287.163851764805
Trimmed Mean ( 12 / 22 )1077115.386363643689.38805224075291.949605493369
Trimmed Mean ( 13 / 22 )1077418.690476193621.49970434637297.506220746924
Trimmed Mean ( 14 / 22 )1077760.653546.90387205915303.859560020810
Trimmed Mean ( 15 / 22 )1078079.53485.5808432344309.296943174501
Trimmed Mean ( 16 / 22 )1078381.722222223421.87342650218315.143661910528
Trimmed Mean ( 17 / 22 )1078755.323529413336.78547418765323.291782427828
Trimmed Mean ( 18 / 22 )1079189.81253214.83265205528335.690821047889
Trimmed Mean ( 19 / 22 )1079423.566666673153.11566392301342.335544178447
Trimmed Mean ( 20 / 22 )1079675.785714293066.20856454063352.12079119479
Trimmed Mean ( 21 / 22 )1080052.52953.98442173383365.625658704749
Trimmed Mean ( 22 / 22 )1080437.166666672832.62479461244381.426148892584
Median1079410.5
Midrange1040848
Midmean - Weighted Average at Xnp1077620.82857143
Midmean - Weighted Average at X(n+1)p1078755.32352941
Midmean - Empirical Distribution Function1077620.82857143
Midmean - Empirical Distribution Function - Averaging1078755.32352941
Midmean - Empirical Distribution Function - Interpolation1078755.32352941
Midmean - Closest Observation1077620.82857143
Midmean - True Basic - Statistics Graphics Toolkit1078755.32352941
Midmean - MS Excel (old versions)1078381.72222222
Number of observations68


Parameters (Session):
Parameters (R input):
R code (references can be found in the software module):
geomean <- function(x) {
return(exp(mean(log(x))))
}
harmean <- function(x) {
return(1/mean(1/x))
}
quamean <- function(x) {
return(sqrt(mean(x*x)))
}
winmean <- function(x) {
x <-sort(x[!is.na(x)])
n<-length(x)
denom <- 3
nodenom <- n/denom
if (nodenom>40) denom <- n/40
sqrtn = sqrt(n)
roundnodenom = floor(nodenom)
win <- array(NA,dim=c(roundnodenom,2))
for (j in 1:roundnodenom) {
win[j,1] <- (j*x[j+1]+sum(x[(j+1):(n-j)])+j*x[n-j])/n
win[j,2] <- sd(c(rep(x[j+1],j),x[(j+1):(n-j)],rep(x[n-j],j)))/sqrtn
}
return(win)
}
trimean <- function(x) {
x <-sort(x[!is.na(x)])
n<-length(x)
denom <- 3
nodenom <- n/denom
if (nodenom>40) denom <- n/40
sqrtn = sqrt(n)
roundnodenom = floor(nodenom)
tri <- array(NA,dim=c(roundnodenom,2))
for (j in 1:roundnodenom) {
tri[j,1] <- mean(x,trim=j/n)
tri[j,2] <- sd(x[(j+1):(n-j)]) / sqrt(n-j*2)
}
return(tri)
}
midrange <- function(x) {
return((max(x)+min(x))/2)
}
q1 <- function(data,n,p,i,f) {
np <- n*p;
i <<- floor(np)
f <<- np - i
qvalue <- (1-f)*data[i] + f*data[i+1]
}
q2 <- function(data,n,p,i,f) {
np <- (n+1)*p
i <<- floor(np)
f <<- np - i
qvalue <- (1-f)*data[i] + f*data[i+1]
}
q3 <- function(data,n,p,i,f) {
np <- n*p
i <<- floor(np)
f <<- np - i
if (f==0) {
qvalue <- data[i]
} else {
qvalue <- data[i+1]
}
}
q4 <- function(data,n,p,i,f) {
np <- n*p
i <<- floor(np)
f <<- np - i
if (f==0) {
qvalue <- (data[i]+data[i+1])/2
} else {
qvalue <- data[i+1]
}
}
q5 <- function(data,n,p,i,f) {
np <- (n-1)*p
i <<- floor(np)
f <<- np - i
if (f==0) {
qvalue <- data[i+1]
} else {
qvalue <- data[i+1] + f*(data[i+2]-data[i+1])
}
}
q6 <- function(data,n,p,i,f) {
np <- n*p+0.5
i <<- floor(np)
f <<- np - i
qvalue <- data[i]
}
q7 <- function(data,n,p,i,f) {
np <- (n+1)*p
i <<- floor(np)
f <<- np - i
if (f==0) {
qvalue <- data[i]
} else {
qvalue <- f*data[i] + (1-f)*data[i+1]
}
}
q8 <- function(data,n,p,i,f) {
np <- (n+1)*p
i <<- floor(np)
f <<- np - i
if (f==0) {
qvalue <- data[i]
} else {
if (f == 0.5) {
qvalue <- (data[i]+data[i+1])/2
} else {
if (f < 0.5) {
qvalue <- data[i]
} else {
qvalue <- data[i+1]
}
}
}
}
midmean <- function(x,def) {
x <-sort(x[!is.na(x)])
n<-length(x)
if (def==1) {
qvalue1 <- q1(x,n,0.25,i,f)
qvalue3 <- q1(x,n,0.75,i,f)
}
if (def==2) {
qvalue1 <- q2(x,n,0.25,i,f)
qvalue3 <- q2(x,n,0.75,i,f)
}
if (def==3) {
qvalue1 <- q3(x,n,0.25,i,f)
qvalue3 <- q3(x,n,0.75,i,f)
}
if (def==4) {
qvalue1 <- q4(x,n,0.25,i,f)
qvalue3 <- q4(x,n,0.75,i,f)
}
if (def==5) {
qvalue1 <- q5(x,n,0.25,i,f)
qvalue3 <- q5(x,n,0.75,i,f)
}
if (def==6) {
qvalue1 <- q6(x,n,0.25,i,f)
qvalue3 <- q6(x,n,0.75,i,f)
}
if (def==7) {
qvalue1 <- q7(x,n,0.25,i,f)
qvalue3 <- q7(x,n,0.75,i,f)
}
if (def==8) {
qvalue1 <- q8(x,n,0.25,i,f)
qvalue3 <- q8(x,n,0.75,i,f)
}
midm <- 0
myn <- 0
roundno4 <- round(n/4)
round3no4 <- round(3*n/4)
for (i in 1:n) {
if ((x[i]>=qvalue1) & (x[i]<=qvalue3)){
midm = midm + x[i]
myn = myn + 1
}
}
midm = midm / myn
return(midm)
}
(arm <- mean(x))
sqrtn <- sqrt(length(x))
(armse <- sd(x) / sqrtn)
(armose <- arm / armse)
(geo <- geomean(x))
(har <- harmean(x))
(qua <- quamean(x))
(win <- winmean(x))
(tri <- trimean(x))
(midr <- midrange(x))
midm <- array(NA,dim=8)
for (j in 1:8) midm[j] <- midmean(x,j)
midm
bitmap(file='test1.png')
lb <- win[,1] - 2*win[,2]
ub <- win[,1] + 2*win[,2]
if ((ylimmin == '') | (ylimmax == '')) plot(win[,1],type='b',main=main, xlab='j', pch=19, ylab='Winsorized Mean(j/n)', ylim=c(min(lb),max(ub))) else plot(win[,1],type='l',main=main, xlab='j', pch=19, ylab='Winsorized Mean(j/n)', ylim=c(ylimmin,ylimmax))
lines(ub,lty=3)
lines(lb,lty=3)
grid()
dev.off()
bitmap(file='test2.png')
lb <- tri[,1] - 2*tri[,2]
ub <- tri[,1] + 2*tri[,2]
if ((ylimmin == '') | (ylimmax == '')) plot(tri[,1],type='b',main=main, xlab='j', pch=19, ylab='Trimmed Mean(j/n)', ylim=c(min(lb),max(ub))) else plot(tri[,1],type='l',main=main, xlab='j', pch=19, ylab='Trimmed Mean(j/n)', ylim=c(ylimmin,ylimmax))
lines(ub,lty=3)
lines(lb,lty=3)
grid()
dev.off()
load(file='createtable')
a<-table.start()
a<-table.row.start(a)
a<-table.element(a,'Central Tendency - Ungrouped Data',4,TRUE)
a<-table.row.end(a)
a<-table.row.start(a)
a<-table.element(a,'Measure',header=TRUE)
a<-table.element(a,'Value',header=TRUE)
a<-table.element(a,'S.E.',header=TRUE)
a<-table.element(a,'Value/S.E.',header=TRUE)
a<-table.row.end(a)
a<-table.row.start(a)
a<-table.element(a,hyperlink('arithmetic_mean.htm', 'Arithmetic Mean', 'click to view the definition of the Arithmetic Mean'),header=TRUE)
a<-table.element(a,arm)
a<-table.element(a,hyperlink('arithmetic_mean_standard_error.htm', armse, 'click to view the definition of the Standard Error of the Arithmetic Mean'))
a<-table.element(a,armose)
a<-table.row.end(a)
a<-table.row.start(a)
a<-table.element(a,hyperlink('geometric_mean.htm', 'Geometric Mean', 'click to view the definition of the Geometric Mean'),header=TRUE)
a<-table.element(a,geo)
a<-table.element(a,'')
a<-table.row.end(a)
a<-table.row.start(a)
a<-table.element(a,hyperlink('harmonic_mean.htm', 'Harmonic Mean', 'click to view the definition of the Harmonic Mean'),header=TRUE)
a<-table.element(a,har)
a<-table.element(a,'')
a<-table.row.end(a)
a<-table.row.start(a)
a<-table.element(a,hyperlink('quadratic_mean.htm', 'Quadratic Mean', 'click to view the definition of the Quadratic Mean'),header=TRUE)
a<-table.element(a,qua)
a<-table.element(a,'')
a<-table.row.end(a)
for (j in 1:length(win[,1])) {
a<-table.row.start(a)
mylabel <- paste('Winsorized Mean (',j)
mylabel <- paste(mylabel,'/')
mylabel <- paste(mylabel,length(win[,1]))
mylabel <- paste(mylabel,')')
a<-table.element(a,hyperlink('winsorized_mean.htm', mylabel, 'click to view the definition of the Winsorized Mean'),header=TRUE)
a<-table.element(a,win[j,1])
a<-table.element(a,win[j,2])
a<-table.element(a,win[j,1]/win[j,2])
a<-table.row.end(a)
}
for (j in 1:length(tri[,1])) {
a<-table.row.start(a)
mylabel <- paste('Trimmed Mean (',j)
mylabel <- paste(mylabel,'/')
mylabel <- paste(mylabel,length(tri[,1]))
mylabel <- paste(mylabel,')')
a<-table.element(a,hyperlink('arithmetic_mean.htm', mylabel, 'click to view the definition of the Trimmed Mean'),header=TRUE)
a<-table.element(a,tri[j,1])
a<-table.element(a,tri[j,2])
a<-table.element(a,tri[j,1]/tri[j,2])
a<-table.row.end(a)
}
a<-table.row.start(a)
a<-table.element(a,hyperlink('median_1.htm', 'Median', 'click to view the definition of the Median'),header=TRUE)
a<-table.element(a,median(x))
a<-table.element(a,'')
a<-table.row.end(a)
a<-table.row.start(a)
a<-table.element(a,hyperlink('midrange.htm', 'Midrange', 'click to view the definition of the Midrange'),header=TRUE)
a<-table.element(a,midr)
a<-table.element(a,'')
a<-table.row.end(a)
a<-table.row.start(a)
mymid <- hyperlink('midmean.htm', 'Midmean', 'click to view the definition of the Midmean')
mylabel <- paste(mymid,hyperlink('method_1.htm','Weighted Average at Xnp',''),sep=' - ')
a<-table.element(a,mylabel,header=TRUE)
a<-table.element(a,midm[1])
a<-table.element(a,'')
a<-table.row.end(a)
a<-table.row.start(a)
mymid <- hyperlink('midmean.htm', 'Midmean', 'click to view the definition of the Midmean')
mylabel <- paste(mymid,hyperlink('method_2.htm','Weighted Average at X(n+1)p',''),sep=' - ')
a<-table.element(a,mylabel,header=TRUE)
a<-table.element(a,midm[2])
a<-table.element(a,'')
a<-table.row.end(a)
a<-table.row.start(a)
mymid <- hyperlink('midmean.htm', 'Midmean', 'click to view the definition of the Midmean')
mylabel <- paste(mymid,hyperlink('method_3.htm','Empirical Distribution Function',''),sep=' - ')
a<-table.element(a,mylabel,header=TRUE)
a<-table.element(a,midm[3])
a<-table.element(a,'')
a<-table.row.end(a)
a<-table.row.start(a)
mymid <- hyperlink('midmean.htm', 'Midmean', 'click to view the definition of the Midmean')
mylabel <- paste(mymid,hyperlink('method_4.htm','Empirical Distribution Function - Averaging',''),sep=' - ')
a<-table.element(a,mylabel,header=TRUE)
a<-table.element(a,midm[4])
a<-table.element(a,'')
a<-table.row.end(a)
a<-table.row.start(a)
mymid <- hyperlink('midmean.htm', 'Midmean', 'click to view the definition of the Midmean')
mylabel <- paste(mymid,hyperlink('method_5.htm','Empirical Distribution Function - Interpolation',''),sep=' - ')
a<-table.element(a,mylabel,header=TRUE)
a<-table.element(a,midm[5])
a<-table.element(a,'')
a<-table.row.end(a)
a<-table.row.start(a)
mymid <- hyperlink('midmean.htm', 'Midmean', 'click to view the definition of the Midmean')
mylabel <- paste(mymid,hyperlink('method_6.htm','Closest Observation',''),sep=' - ')
a<-table.element(a,mylabel,header=TRUE)
a<-table.element(a,midm[6])
a<-table.element(a,'')
a<-table.row.end(a)
a<-table.row.start(a)
mymid <- hyperlink('midmean.htm', 'Midmean', 'click to view the definition of the Midmean')
mylabel <- paste(mymid,hyperlink('method_7.htm','True Basic - Statistics Graphics Toolkit',''),sep=' - ')
a<-table.element(a,mylabel,header=TRUE)
a<-table.element(a,midm[7])
a<-table.element(a,'')
a<-table.row.end(a)
a<-table.row.start(a)
mymid <- hyperlink('midmean.htm', 'Midmean', 'click to view the definition of the Midmean')
mylabel <- paste(mymid,hyperlink('method_8.htm','MS Excel (old versions)',''),sep=' - ')
a<-table.element(a,mylabel,header=TRUE)
a<-table.element(a,midm[8])
a<-table.element(a,'')
a<-table.row.end(a)
a<-table.row.start(a)
a<-table.element(a,'Number of observations',header=TRUE)
a<-table.element(a,length(x))
a<-table.element(a,'')
a<-table.row.end(a)
a<-table.end(a)
table.save(a,file='mytable.tab')