Free Statistics

of Irreproducible Research!

Author's title

Author*The author of this computation has been verified*
R Software Modulerwasp_centraltendency.wasp
Title produced by softwareCentral Tendency
Date of computationMon, 19 Oct 2009 12:16:03 -0600
Cite this page as followsStatistical Computations at FreeStatistics.org, Office for Research Development and Education, URL https://freestatistics.org/blog/index.php?v=date/2009/Oct/19/t1255976215zx7uke3qzjtlhnc.htm/, Retrieved Mon, 29 Apr 2024 19:41:57 +0000
Statistical Computations at FreeStatistics.org, Office for Research Development and Education, URL https://freestatistics.org/blog/index.php?pk=48051, Retrieved Mon, 29 Apr 2024 19:41:57 +0000
QR Codes:

Original text written by user:
IsPrivate?No (this computation is public)
User-defined keywords
Estimated Impact96
Family? (F = Feedback message, R = changed R code, M = changed R Module, P = changed Parameters, D = changed Data)
-     [Bivariate Data Series] [Bivariate dataset] [2008-01-05 23:51:08] [74be16979710d4c4e7c6647856088456]
F RMPD  [Univariate Explorative Data Analysis] [Colombia Coffee] [2008-01-07 14:21:11] [74be16979710d4c4e7c6647856088456]
F RMPD    [Univariate Data Series] [] [2009-10-14 08:30:28] [74be16979710d4c4e7c6647856088456]
F RMPD        [Central Tendency] [WS3_Part2 Y(t)] [2009-10-19 18:16:03] [7a6d96edf94be87996de99db5f42363b] [Current]
- RM D          [Variability] [WS3_Part 2 Variab...] [2009-10-19 19:00:25] [2c75a4273e8c314249ceca659377406c]
- RMPD          [Histogram] [WS3_Part 2 Histogram] [2009-10-19 19:21:59] [2c75a4273e8c314249ceca659377406c]
- RMPD          [Harrell-Davis Quantiles] [WS3-Part 2 Harell...] [2009-10-19 19:33:03] [2c75a4273e8c314249ceca659377406c]
-   PD          [Central Tendency] [WS3_Part 2 Centra...] [2009-10-19 19:44:46] [2c75a4273e8c314249ceca659377406c]
- RMPD          [Variability] [WS3_ Part 3 Varib...] [2009-10-19 19:51:42] [2c75a4273e8c314249ceca659377406c]
- RMPD          [Histogram] [WS3_Part 2 Histog...] [2009-10-19 19:54:04] [2c75a4273e8c314249ceca659377406c]
- RMPD          [Harrell-Davis Quantiles] [WS3_Part 2 Harell...] [2009-10-19 19:57:43] [2c75a4273e8c314249ceca659377406c]
Feedback Forum
2009-10-23 12:09:59 [Mathias Danneel] [reply
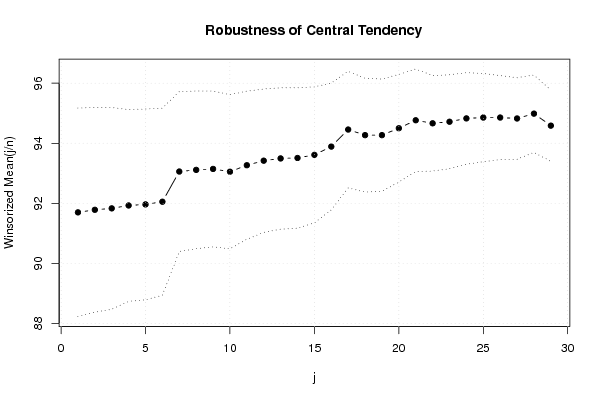
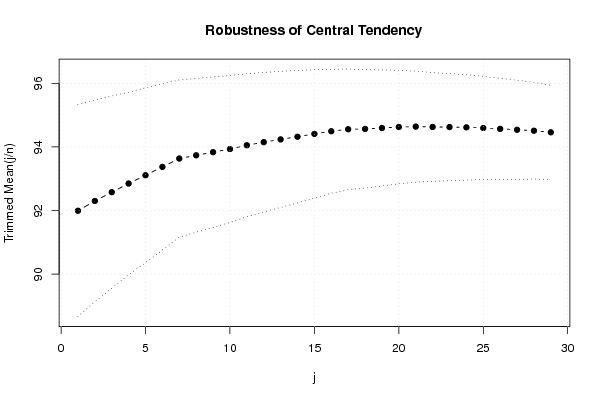
In uw analyse vermeldt u dat de crisis geen effect, of een verwaarloosbaar effect heeft op de bouwindex. Ik ben hiermee echter niet akkoord. Als we weten dat het gemiddelde 91,70 is en het wisoresed en getrimd gemiddelde ligt tegen 94, kan ik daar uit afleiden dat er toch een negatief effect geweest is op de bouwindex. Het gewoon gemiddelde is een niet robuste waarde en dus bijzonder gevoelig aan outliers, in dit geval de zeer lage waarden van rond de 80. Het winsoresed is een meer robuste waarde. Als we deze waarden met elkaar gaan vergelijken nl. 91.70 en 94 kan je onlosmakend besluiten dat er lage waarden een invloed hebben op het gemiddelde.

Post a new message
Dataseries X:
104,6
103
106,9
56,3
93,4
109,1
113,8
97,4
72,5
82,7
88,9
105,9
100,8
94
105
58,5
87,6
113,1
112,5
89,6
74,5
82,7
90,1
109,4
96
89,2
109,1
49,1
92,9
107,7
103,5
91,1
79,8
71,9
82,9
90,1
100,7
90,7
108,8
44,1
93,6
107,4
96,5
93,6
76,5
76,7
84
103,3
88,5
99
105,9
44,7
94
107,1
104,8
102,5
77,7
85,2
91,3
106,5
92,4
97,5
107
51,1
98,6
102,2
114,3
99,4
72,5
92,3
99,4
85,9
109,4
97,6
104,7
56,9
86,7
108,5
103,4
86,2
71
75,9
87,1
102
88,5
87,8
100,8


Summary of computational transaction
Raw Inputview raw input (R code)
Raw Outputview raw output of R engine
Computing time1 seconds
R Server'Gwilym Jenkins' @ 72.249.127.135

\begin{tabular}{lllllllll}
\hline
Summary of computational transaction \tabularnewline
Raw Input & view raw input (R code)  \tabularnewline
Raw Output & view raw output of R engine  \tabularnewline
Computing time & 1 seconds \tabularnewline
R Server & 'Gwilym Jenkins' @ 72.249.127.135 \tabularnewline
\hline
\end{tabular}
%Source: https://freestatistics.org/blog/index.php?pk=48051&T=0

[TABLE]
[ROW][C]Summary of computational transaction[/C][/ROW]
[ROW][C]Raw Input[/C][C]view raw input (R code) [/C][/ROW]
[ROW][C]Raw Output[/C][C]view raw output of R engine [/C][/ROW]
[ROW][C]Computing time[/C][C]1 seconds[/C][/ROW]
[ROW][C]R Server[/C][C]'Gwilym Jenkins' @ 72.249.127.135[/C][/ROW]
[/TABLE]
Source: https://freestatistics.org/blog/index.php?pk=48051&T=0

Globally Unique Identifier (entire table): ba.freestatistics.org/blog/index.php?pk=48051&T=0

As an alternative you can also use a QR Code:  

The GUIDs for individual cells are displayed in the table below:

Summary of computational transaction
Raw Inputview raw input (R code)
Raw Outputview raw output of R engine
Computing time1 seconds
R Server'Gwilym Jenkins' @ 72.249.127.135


Central Tendency - Ungrouped Data
MeasureValueS.E.Value/S.E.
Arithmetic Mean91.69885057471271.739533941224752.7146084371041
Geometric Mean89.9751089483086
Harmonic Mean87.8502737741544
Quadratic Mean93.1069993788509
Winsorized Mean ( 1 / 29 )91.71.7364921456582152.807610002314
Winsorized Mean ( 2 / 29 )91.78505747126441.7034663849047653.8813435267149
Winsorized Mean ( 3 / 29 )91.83333333333331.6807149185513254.6394467733341
Winsorized Mean ( 4 / 29 )91.92988505747131.5966552473832157.5765402131343
Winsorized Mean ( 5 / 29 )91.9643678160921.5877538373730257.9210490010527
Winsorized Mean ( 6 / 29 )92.05402298850571.5571203902215459.118115443475
Winsorized Mean ( 7 / 29 )93.05977011494251.3320042758910469.8644680045718
Winsorized Mean ( 8 / 29 )93.11494252873561.3124081706760270.9496821257765
Winsorized Mean ( 9 / 29 )93.14597701149431.2965345670083371.8422627376782
Winsorized Mean ( 10 / 29 )93.05402298850571.2841047070562672.4660710899713
Winsorized Mean ( 11 / 29 )93.26896551724141.2331291980995575.636004451913
Winsorized Mean ( 12 / 29 )93.42068965517241.1940444501665978.2388709583959
Winsorized Mean ( 13 / 29 )93.49540229885061.1768754567953379.443752318059
Winsorized Mean ( 14 / 29 )93.51149425287361.1693383225153379.9695797634717
Winsorized Mean ( 15 / 29 )93.61494252873561.1316679534879982.7229773894351
Winsorized Mean ( 16 / 29 )93.89080459770111.0554534139753488.9577913667112
Winsorized Mean ( 17 / 29 )94.45747126436780.9714236008593997.2361297180798
Winsorized Mean ( 18 / 29 )94.2712643678160.94639244974166699.6111754627259
Winsorized Mean ( 19 / 29 )94.2712643678160.934457128903064100.883455700615
Winsorized Mean ( 20 / 29 )94.50114942528740.896301310480094105.434576877578
Winsorized Mean ( 21 / 29 )94.76666666666670.854484321333095110.905097145398
Winsorized Mean ( 22 / 29 )94.66551724137930.795003824828618119.075549431208
Winsorized Mean ( 23 / 29 )94.71839080459770.781477515363385121.204243170776
Winsorized Mean ( 24 / 29 )94.82873563218390.76059549126049124.676962619157
Winsorized Mean ( 25 / 29 )94.85747126436780.735268095211646129.010726675232
Winsorized Mean ( 26 / 29 )94.85747126436780.697928412462555135.912895320703
Winsorized Mean ( 27 / 29 )94.82643678160920.678629883292827139.732185564089
Winsorized Mean ( 28 / 29 )94.9873563218390.643715750038507147.561025679668
Winsorized Mean ( 29 / 29 )94.5873563218390.594017678524494159.233234534010
Trimmed Mean ( 1 / 29 )91.99294117647061.6676421136282555.1634792769319
Trimmed Mean ( 2 / 29 )92.31.5867768309177058.1682302145909
Trimmed Mean ( 3 / 29 )92.57654320987651.5128811851107761.1922100168749
Trimmed Mean ( 4 / 29 )92.84936708860761.4360972951538064.6539530447786
Trimmed Mean ( 5 / 29 )93.1090909090911.3768285322826267.6257709118845
Trimmed Mean ( 6 / 29 )93.37466666666671.3091226596992971.326140430657
Trimmed Mean ( 7 / 29 )93.63698630136991.2370370570653775.6945685390424
Trimmed Mean ( 8 / 29 )93.73802816901411.2111809196438877.3939108920043
Trimmed Mean ( 9 / 29 )93.8362318840581.1847963609589579.2003039308028
Trimmed Mean ( 10 / 29 )93.93582089552241.1566019989805781.2170660074231
Trimmed Mean ( 11 / 29 )94.05384615384621.1250621284619883.5988020345352
Trimmed Mean ( 12 / 29 )94.1523809523811.0974645105815385.790820609307
Trimmed Mean ( 13 / 29 )94.2393442622951.0716472145236687.9387759190736
Trimmed Mean ( 14 / 29 )94.32372881355931.0433764229291090.4023962404306
Trimmed Mean ( 15 / 29 )94.41228070175441.0099910362621193.4783352644058
Trimmed Mean ( 16 / 29 )94.49636363636360.97619809367258696.8003976332876
Trimmed Mean ( 17 / 29 )94.55849056603770.949384622178699.5997705851288
Trimmed Mean ( 18 / 29 )94.56862745098040.93196183628031101.472639511106
Trimmed Mean ( 19 / 29 )94.59795918367350.914055448104867103.492582840358
Trimmed Mean ( 20 / 29 )94.62978723404260.893008691225989105.967375417285
Trimmed Mean ( 21 / 29 )94.64222222222220.873200827843373108.385401392677
Trimmed Mean ( 22 / 29 )94.63023255813950.85537538716979110.630062517050
Trimmed Mean ( 23 / 29 )94.62682926829270.84337464109782112.200230665125
Trimmed Mean ( 24 / 29 )94.61794871794870.829010692739082114.133568537370
Trimmed Mean ( 25 / 29 )94.59729729729730.813008782595782116.354582290324
Trimmed Mean ( 26 / 29 )94.57142857142860.795782701522983118.840769459346
Trimmed Mean ( 27 / 29 )94.54242424242420.779775490987804121.243133870058
Trimmed Mean ( 28 / 29 )94.51290322580650.760570554587166124.265793167746
Trimmed Mean ( 29 / 29 )94.46206896551720.740862461609611127.502841431981
Median93.6
Midrange79.2
Midmean - Weighted Average at Xnp94.415909090909
Midmean - Weighted Average at X(n+1)p94.6422222222222
Midmean - Empirical Distribution Function94.6422222222222
Midmean - Empirical Distribution Function - Averaging94.6422222222222
Midmean - Empirical Distribution Function - Interpolation94.6302325581395
Midmean - Closest Observation94.415909090909
Midmean - True Basic - Statistics Graphics Toolkit94.6422222222222
Midmean - MS Excel (old versions)94.6422222222222
Number of observations87

\begin{tabular}{lllllllll}
\hline
Central Tendency - Ungrouped Data \tabularnewline
Measure & Value & S.E. & Value/S.E. \tabularnewline
Arithmetic Mean & 91.6988505747127 & 1.7395339412247 & 52.7146084371041 \tabularnewline
Geometric Mean & 89.9751089483086 &  &  \tabularnewline
Harmonic Mean & 87.8502737741544 &  &  \tabularnewline
Quadratic Mean & 93.1069993788509 &  &  \tabularnewline
Winsorized Mean ( 1 / 29 ) & 91.7 & 1.73649214565821 & 52.807610002314 \tabularnewline
Winsorized Mean ( 2 / 29 ) & 91.7850574712644 & 1.70346638490476 & 53.8813435267149 \tabularnewline
Winsorized Mean ( 3 / 29 ) & 91.8333333333333 & 1.68071491855132 & 54.6394467733341 \tabularnewline
Winsorized Mean ( 4 / 29 ) & 91.9298850574713 & 1.59665524738321 & 57.5765402131343 \tabularnewline
Winsorized Mean ( 5 / 29 ) & 91.964367816092 & 1.58775383737302 & 57.9210490010527 \tabularnewline
Winsorized Mean ( 6 / 29 ) & 92.0540229885057 & 1.55712039022154 & 59.118115443475 \tabularnewline
Winsorized Mean ( 7 / 29 ) & 93.0597701149425 & 1.33200427589104 & 69.8644680045718 \tabularnewline
Winsorized Mean ( 8 / 29 ) & 93.1149425287356 & 1.31240817067602 & 70.9496821257765 \tabularnewline
Winsorized Mean ( 9 / 29 ) & 93.1459770114943 & 1.29653456700833 & 71.8422627376782 \tabularnewline
Winsorized Mean ( 10 / 29 ) & 93.0540229885057 & 1.28410470705626 & 72.4660710899713 \tabularnewline
Winsorized Mean ( 11 / 29 ) & 93.2689655172414 & 1.23312919809955 & 75.636004451913 \tabularnewline
Winsorized Mean ( 12 / 29 ) & 93.4206896551724 & 1.19404445016659 & 78.2388709583959 \tabularnewline
Winsorized Mean ( 13 / 29 ) & 93.4954022988506 & 1.17687545679533 & 79.443752318059 \tabularnewline
Winsorized Mean ( 14 / 29 ) & 93.5114942528736 & 1.16933832251533 & 79.9695797634717 \tabularnewline
Winsorized Mean ( 15 / 29 ) & 93.6149425287356 & 1.13166795348799 & 82.7229773894351 \tabularnewline
Winsorized Mean ( 16 / 29 ) & 93.8908045977011 & 1.05545341397534 & 88.9577913667112 \tabularnewline
Winsorized Mean ( 17 / 29 ) & 94.4574712643678 & 0.97142360085939 & 97.2361297180798 \tabularnewline
Winsorized Mean ( 18 / 29 ) & 94.271264367816 & 0.946392449741666 & 99.6111754627259 \tabularnewline
Winsorized Mean ( 19 / 29 ) & 94.271264367816 & 0.934457128903064 & 100.883455700615 \tabularnewline
Winsorized Mean ( 20 / 29 ) & 94.5011494252874 & 0.896301310480094 & 105.434576877578 \tabularnewline
Winsorized Mean ( 21 / 29 ) & 94.7666666666667 & 0.854484321333095 & 110.905097145398 \tabularnewline
Winsorized Mean ( 22 / 29 ) & 94.6655172413793 & 0.795003824828618 & 119.075549431208 \tabularnewline
Winsorized Mean ( 23 / 29 ) & 94.7183908045977 & 0.781477515363385 & 121.204243170776 \tabularnewline
Winsorized Mean ( 24 / 29 ) & 94.8287356321839 & 0.76059549126049 & 124.676962619157 \tabularnewline
Winsorized Mean ( 25 / 29 ) & 94.8574712643678 & 0.735268095211646 & 129.010726675232 \tabularnewline
Winsorized Mean ( 26 / 29 ) & 94.8574712643678 & 0.697928412462555 & 135.912895320703 \tabularnewline
Winsorized Mean ( 27 / 29 ) & 94.8264367816092 & 0.678629883292827 & 139.732185564089 \tabularnewline
Winsorized Mean ( 28 / 29 ) & 94.987356321839 & 0.643715750038507 & 147.561025679668 \tabularnewline
Winsorized Mean ( 29 / 29 ) & 94.587356321839 & 0.594017678524494 & 159.233234534010 \tabularnewline
Trimmed Mean ( 1 / 29 ) & 91.9929411764706 & 1.66764211362825 & 55.1634792769319 \tabularnewline
Trimmed Mean ( 2 / 29 ) & 92.3 & 1.58677683091770 & 58.1682302145909 \tabularnewline
Trimmed Mean ( 3 / 29 ) & 92.5765432098765 & 1.51288118511077 & 61.1922100168749 \tabularnewline
Trimmed Mean ( 4 / 29 ) & 92.8493670886076 & 1.43609729515380 & 64.6539530447786 \tabularnewline
Trimmed Mean ( 5 / 29 ) & 93.109090909091 & 1.37682853228262 & 67.6257709118845 \tabularnewline
Trimmed Mean ( 6 / 29 ) & 93.3746666666667 & 1.30912265969929 & 71.326140430657 \tabularnewline
Trimmed Mean ( 7 / 29 ) & 93.6369863013699 & 1.23703705706537 & 75.6945685390424 \tabularnewline
Trimmed Mean ( 8 / 29 ) & 93.7380281690141 & 1.21118091964388 & 77.3939108920043 \tabularnewline
Trimmed Mean ( 9 / 29 ) & 93.836231884058 & 1.18479636095895 & 79.2003039308028 \tabularnewline
Trimmed Mean ( 10 / 29 ) & 93.9358208955224 & 1.15660199898057 & 81.2170660074231 \tabularnewline
Trimmed Mean ( 11 / 29 ) & 94.0538461538462 & 1.12506212846198 & 83.5988020345352 \tabularnewline
Trimmed Mean ( 12 / 29 ) & 94.152380952381 & 1.09746451058153 & 85.790820609307 \tabularnewline
Trimmed Mean ( 13 / 29 ) & 94.239344262295 & 1.07164721452366 & 87.9387759190736 \tabularnewline
Trimmed Mean ( 14 / 29 ) & 94.3237288135593 & 1.04337642292910 & 90.4023962404306 \tabularnewline
Trimmed Mean ( 15 / 29 ) & 94.4122807017544 & 1.00999103626211 & 93.4783352644058 \tabularnewline
Trimmed Mean ( 16 / 29 ) & 94.4963636363636 & 0.976198093672586 & 96.8003976332876 \tabularnewline
Trimmed Mean ( 17 / 29 ) & 94.5584905660377 & 0.9493846221786 & 99.5997705851288 \tabularnewline
Trimmed Mean ( 18 / 29 ) & 94.5686274509804 & 0.93196183628031 & 101.472639511106 \tabularnewline
Trimmed Mean ( 19 / 29 ) & 94.5979591836735 & 0.914055448104867 & 103.492582840358 \tabularnewline
Trimmed Mean ( 20 / 29 ) & 94.6297872340426 & 0.893008691225989 & 105.967375417285 \tabularnewline
Trimmed Mean ( 21 / 29 ) & 94.6422222222222 & 0.873200827843373 & 108.385401392677 \tabularnewline
Trimmed Mean ( 22 / 29 ) & 94.6302325581395 & 0.85537538716979 & 110.630062517050 \tabularnewline
Trimmed Mean ( 23 / 29 ) & 94.6268292682927 & 0.84337464109782 & 112.200230665125 \tabularnewline
Trimmed Mean ( 24 / 29 ) & 94.6179487179487 & 0.829010692739082 & 114.133568537370 \tabularnewline
Trimmed Mean ( 25 / 29 ) & 94.5972972972973 & 0.813008782595782 & 116.354582290324 \tabularnewline
Trimmed Mean ( 26 / 29 ) & 94.5714285714286 & 0.795782701522983 & 118.840769459346 \tabularnewline
Trimmed Mean ( 27 / 29 ) & 94.5424242424242 & 0.779775490987804 & 121.243133870058 \tabularnewline
Trimmed Mean ( 28 / 29 ) & 94.5129032258065 & 0.760570554587166 & 124.265793167746 \tabularnewline
Trimmed Mean ( 29 / 29 ) & 94.4620689655172 & 0.740862461609611 & 127.502841431981 \tabularnewline
Median & 93.6 &  &  \tabularnewline
Midrange & 79.2 &  &  \tabularnewline
Midmean - Weighted Average at Xnp & 94.415909090909 &  &  \tabularnewline
Midmean - Weighted Average at X(n+1)p & 94.6422222222222 &  &  \tabularnewline
Midmean - Empirical Distribution Function & 94.6422222222222 &  &  \tabularnewline
Midmean - Empirical Distribution Function - Averaging & 94.6422222222222 &  &  \tabularnewline
Midmean - Empirical Distribution Function - Interpolation & 94.6302325581395 &  &  \tabularnewline
Midmean - Closest Observation & 94.415909090909 &  &  \tabularnewline
Midmean - True Basic - Statistics Graphics Toolkit & 94.6422222222222 &  &  \tabularnewline
Midmean - MS Excel (old versions) & 94.6422222222222 &  &  \tabularnewline
Number of observations & 87 &  &  \tabularnewline
\hline
\end{tabular}
%Source: https://freestatistics.org/blog/index.php?pk=48051&T=1

[TABLE]
[ROW][C]Central Tendency - Ungrouped Data[/C][/ROW]
[ROW][C]Measure[/C][C]Value[/C][C]S.E.[/C][C]Value/S.E.[/C][/ROW]
[ROW][C]Arithmetic Mean[/C][C]91.6988505747127[/C][C]1.7395339412247[/C][C]52.7146084371041[/C][/ROW]
[ROW][C]Geometric Mean[/C][C]89.9751089483086[/C][C][/C][C][/C][/ROW]
[ROW][C]Harmonic Mean[/C][C]87.8502737741544[/C][C][/C][C][/C][/ROW]
[ROW][C]Quadratic Mean[/C][C]93.1069993788509[/C][C][/C][C][/C][/ROW]
[ROW][C]Winsorized Mean ( 1 / 29 )[/C][C]91.7[/C][C]1.73649214565821[/C][C]52.807610002314[/C][/ROW]
[ROW][C]Winsorized Mean ( 2 / 29 )[/C][C]91.7850574712644[/C][C]1.70346638490476[/C][C]53.8813435267149[/C][/ROW]
[ROW][C]Winsorized Mean ( 3 / 29 )[/C][C]91.8333333333333[/C][C]1.68071491855132[/C][C]54.6394467733341[/C][/ROW]
[ROW][C]Winsorized Mean ( 4 / 29 )[/C][C]91.9298850574713[/C][C]1.59665524738321[/C][C]57.5765402131343[/C][/ROW]
[ROW][C]Winsorized Mean ( 5 / 29 )[/C][C]91.964367816092[/C][C]1.58775383737302[/C][C]57.9210490010527[/C][/ROW]
[ROW][C]Winsorized Mean ( 6 / 29 )[/C][C]92.0540229885057[/C][C]1.55712039022154[/C][C]59.118115443475[/C][/ROW]
[ROW][C]Winsorized Mean ( 7 / 29 )[/C][C]93.0597701149425[/C][C]1.33200427589104[/C][C]69.8644680045718[/C][/ROW]
[ROW][C]Winsorized Mean ( 8 / 29 )[/C][C]93.1149425287356[/C][C]1.31240817067602[/C][C]70.9496821257765[/C][/ROW]
[ROW][C]Winsorized Mean ( 9 / 29 )[/C][C]93.1459770114943[/C][C]1.29653456700833[/C][C]71.8422627376782[/C][/ROW]
[ROW][C]Winsorized Mean ( 10 / 29 )[/C][C]93.0540229885057[/C][C]1.28410470705626[/C][C]72.4660710899713[/C][/ROW]
[ROW][C]Winsorized Mean ( 11 / 29 )[/C][C]93.2689655172414[/C][C]1.23312919809955[/C][C]75.636004451913[/C][/ROW]
[ROW][C]Winsorized Mean ( 12 / 29 )[/C][C]93.4206896551724[/C][C]1.19404445016659[/C][C]78.2388709583959[/C][/ROW]
[ROW][C]Winsorized Mean ( 13 / 29 )[/C][C]93.4954022988506[/C][C]1.17687545679533[/C][C]79.443752318059[/C][/ROW]
[ROW][C]Winsorized Mean ( 14 / 29 )[/C][C]93.5114942528736[/C][C]1.16933832251533[/C][C]79.9695797634717[/C][/ROW]
[ROW][C]Winsorized Mean ( 15 / 29 )[/C][C]93.6149425287356[/C][C]1.13166795348799[/C][C]82.7229773894351[/C][/ROW]
[ROW][C]Winsorized Mean ( 16 / 29 )[/C][C]93.8908045977011[/C][C]1.05545341397534[/C][C]88.9577913667112[/C][/ROW]
[ROW][C]Winsorized Mean ( 17 / 29 )[/C][C]94.4574712643678[/C][C]0.97142360085939[/C][C]97.2361297180798[/C][/ROW]
[ROW][C]Winsorized Mean ( 18 / 29 )[/C][C]94.271264367816[/C][C]0.946392449741666[/C][C]99.6111754627259[/C][/ROW]
[ROW][C]Winsorized Mean ( 19 / 29 )[/C][C]94.271264367816[/C][C]0.934457128903064[/C][C]100.883455700615[/C][/ROW]
[ROW][C]Winsorized Mean ( 20 / 29 )[/C][C]94.5011494252874[/C][C]0.896301310480094[/C][C]105.434576877578[/C][/ROW]
[ROW][C]Winsorized Mean ( 21 / 29 )[/C][C]94.7666666666667[/C][C]0.854484321333095[/C][C]110.905097145398[/C][/ROW]
[ROW][C]Winsorized Mean ( 22 / 29 )[/C][C]94.6655172413793[/C][C]0.795003824828618[/C][C]119.075549431208[/C][/ROW]
[ROW][C]Winsorized Mean ( 23 / 29 )[/C][C]94.7183908045977[/C][C]0.781477515363385[/C][C]121.204243170776[/C][/ROW]
[ROW][C]Winsorized Mean ( 24 / 29 )[/C][C]94.8287356321839[/C][C]0.76059549126049[/C][C]124.676962619157[/C][/ROW]
[ROW][C]Winsorized Mean ( 25 / 29 )[/C][C]94.8574712643678[/C][C]0.735268095211646[/C][C]129.010726675232[/C][/ROW]
[ROW][C]Winsorized Mean ( 26 / 29 )[/C][C]94.8574712643678[/C][C]0.697928412462555[/C][C]135.912895320703[/C][/ROW]
[ROW][C]Winsorized Mean ( 27 / 29 )[/C][C]94.8264367816092[/C][C]0.678629883292827[/C][C]139.732185564089[/C][/ROW]
[ROW][C]Winsorized Mean ( 28 / 29 )[/C][C]94.987356321839[/C][C]0.643715750038507[/C][C]147.561025679668[/C][/ROW]
[ROW][C]Winsorized Mean ( 29 / 29 )[/C][C]94.587356321839[/C][C]0.594017678524494[/C][C]159.233234534010[/C][/ROW]
[ROW][C]Trimmed Mean ( 1 / 29 )[/C][C]91.9929411764706[/C][C]1.66764211362825[/C][C]55.1634792769319[/C][/ROW]
[ROW][C]Trimmed Mean ( 2 / 29 )[/C][C]92.3[/C][C]1.58677683091770[/C][C]58.1682302145909[/C][/ROW]
[ROW][C]Trimmed Mean ( 3 / 29 )[/C][C]92.5765432098765[/C][C]1.51288118511077[/C][C]61.1922100168749[/C][/ROW]
[ROW][C]Trimmed Mean ( 4 / 29 )[/C][C]92.8493670886076[/C][C]1.43609729515380[/C][C]64.6539530447786[/C][/ROW]
[ROW][C]Trimmed Mean ( 5 / 29 )[/C][C]93.109090909091[/C][C]1.37682853228262[/C][C]67.6257709118845[/C][/ROW]
[ROW][C]Trimmed Mean ( 6 / 29 )[/C][C]93.3746666666667[/C][C]1.30912265969929[/C][C]71.326140430657[/C][/ROW]
[ROW][C]Trimmed Mean ( 7 / 29 )[/C][C]93.6369863013699[/C][C]1.23703705706537[/C][C]75.6945685390424[/C][/ROW]
[ROW][C]Trimmed Mean ( 8 / 29 )[/C][C]93.7380281690141[/C][C]1.21118091964388[/C][C]77.3939108920043[/C][/ROW]
[ROW][C]Trimmed Mean ( 9 / 29 )[/C][C]93.836231884058[/C][C]1.18479636095895[/C][C]79.2003039308028[/C][/ROW]
[ROW][C]Trimmed Mean ( 10 / 29 )[/C][C]93.9358208955224[/C][C]1.15660199898057[/C][C]81.2170660074231[/C][/ROW]
[ROW][C]Trimmed Mean ( 11 / 29 )[/C][C]94.0538461538462[/C][C]1.12506212846198[/C][C]83.5988020345352[/C][/ROW]
[ROW][C]Trimmed Mean ( 12 / 29 )[/C][C]94.152380952381[/C][C]1.09746451058153[/C][C]85.790820609307[/C][/ROW]
[ROW][C]Trimmed Mean ( 13 / 29 )[/C][C]94.239344262295[/C][C]1.07164721452366[/C][C]87.9387759190736[/C][/ROW]
[ROW][C]Trimmed Mean ( 14 / 29 )[/C][C]94.3237288135593[/C][C]1.04337642292910[/C][C]90.4023962404306[/C][/ROW]
[ROW][C]Trimmed Mean ( 15 / 29 )[/C][C]94.4122807017544[/C][C]1.00999103626211[/C][C]93.4783352644058[/C][/ROW]
[ROW][C]Trimmed Mean ( 16 / 29 )[/C][C]94.4963636363636[/C][C]0.976198093672586[/C][C]96.8003976332876[/C][/ROW]
[ROW][C]Trimmed Mean ( 17 / 29 )[/C][C]94.5584905660377[/C][C]0.9493846221786[/C][C]99.5997705851288[/C][/ROW]
[ROW][C]Trimmed Mean ( 18 / 29 )[/C][C]94.5686274509804[/C][C]0.93196183628031[/C][C]101.472639511106[/C][/ROW]
[ROW][C]Trimmed Mean ( 19 / 29 )[/C][C]94.5979591836735[/C][C]0.914055448104867[/C][C]103.492582840358[/C][/ROW]
[ROW][C]Trimmed Mean ( 20 / 29 )[/C][C]94.6297872340426[/C][C]0.893008691225989[/C][C]105.967375417285[/C][/ROW]
[ROW][C]Trimmed Mean ( 21 / 29 )[/C][C]94.6422222222222[/C][C]0.873200827843373[/C][C]108.385401392677[/C][/ROW]
[ROW][C]Trimmed Mean ( 22 / 29 )[/C][C]94.6302325581395[/C][C]0.85537538716979[/C][C]110.630062517050[/C][/ROW]
[ROW][C]Trimmed Mean ( 23 / 29 )[/C][C]94.6268292682927[/C][C]0.84337464109782[/C][C]112.200230665125[/C][/ROW]
[ROW][C]Trimmed Mean ( 24 / 29 )[/C][C]94.6179487179487[/C][C]0.829010692739082[/C][C]114.133568537370[/C][/ROW]
[ROW][C]Trimmed Mean ( 25 / 29 )[/C][C]94.5972972972973[/C][C]0.813008782595782[/C][C]116.354582290324[/C][/ROW]
[ROW][C]Trimmed Mean ( 26 / 29 )[/C][C]94.5714285714286[/C][C]0.795782701522983[/C][C]118.840769459346[/C][/ROW]
[ROW][C]Trimmed Mean ( 27 / 29 )[/C][C]94.5424242424242[/C][C]0.779775490987804[/C][C]121.243133870058[/C][/ROW]
[ROW][C]Trimmed Mean ( 28 / 29 )[/C][C]94.5129032258065[/C][C]0.760570554587166[/C][C]124.265793167746[/C][/ROW]
[ROW][C]Trimmed Mean ( 29 / 29 )[/C][C]94.4620689655172[/C][C]0.740862461609611[/C][C]127.502841431981[/C][/ROW]
[ROW][C]Median[/C][C]93.6[/C][C][/C][C][/C][/ROW]
[ROW][C]Midrange[/C][C]79.2[/C][C][/C][C][/C][/ROW]
[ROW][C]Midmean - Weighted Average at Xnp[/C][C]94.415909090909[/C][C][/C][C][/C][/ROW]
[ROW][C]Midmean - Weighted Average at X(n+1)p[/C][C]94.6422222222222[/C][C][/C][C][/C][/ROW]
[ROW][C]Midmean - Empirical Distribution Function[/C][C]94.6422222222222[/C][C][/C][C][/C][/ROW]
[ROW][C]Midmean - Empirical Distribution Function - Averaging[/C][C]94.6422222222222[/C][C][/C][C][/C][/ROW]
[ROW][C]Midmean - Empirical Distribution Function - Interpolation[/C][C]94.6302325581395[/C][C][/C][C][/C][/ROW]
[ROW][C]Midmean - Closest Observation[/C][C]94.415909090909[/C][C][/C][C][/C][/ROW]
[ROW][C]Midmean - True Basic - Statistics Graphics Toolkit[/C][C]94.6422222222222[/C][C][/C][C][/C][/ROW]
[ROW][C]Midmean - MS Excel (old versions)[/C][C]94.6422222222222[/C][C][/C][C][/C][/ROW]
[ROW][C]Number of observations[/C][C]87[/C][C][/C][C][/C][/ROW]
[/TABLE]
Source: https://freestatistics.org/blog/index.php?pk=48051&T=1

Globally Unique Identifier (entire table): ba.freestatistics.org/blog/index.php?pk=48051&T=1

As an alternative you can also use a QR Code:  

The GUIDs for individual cells are displayed in the table below:

Central Tendency - Ungrouped Data
MeasureValueS.E.Value/S.E.
Arithmetic Mean91.69885057471271.739533941224752.7146084371041
Geometric Mean89.9751089483086
Harmonic Mean87.8502737741544
Quadratic Mean93.1069993788509
Winsorized Mean ( 1 / 29 )91.71.7364921456582152.807610002314
Winsorized Mean ( 2 / 29 )91.78505747126441.7034663849047653.8813435267149
Winsorized Mean ( 3 / 29 )91.83333333333331.6807149185513254.6394467733341
Winsorized Mean ( 4 / 29 )91.92988505747131.5966552473832157.5765402131343
Winsorized Mean ( 5 / 29 )91.9643678160921.5877538373730257.9210490010527
Winsorized Mean ( 6 / 29 )92.05402298850571.5571203902215459.118115443475
Winsorized Mean ( 7 / 29 )93.05977011494251.3320042758910469.8644680045718
Winsorized Mean ( 8 / 29 )93.11494252873561.3124081706760270.9496821257765
Winsorized Mean ( 9 / 29 )93.14597701149431.2965345670083371.8422627376782
Winsorized Mean ( 10 / 29 )93.05402298850571.2841047070562672.4660710899713
Winsorized Mean ( 11 / 29 )93.26896551724141.2331291980995575.636004451913
Winsorized Mean ( 12 / 29 )93.42068965517241.1940444501665978.2388709583959
Winsorized Mean ( 13 / 29 )93.49540229885061.1768754567953379.443752318059
Winsorized Mean ( 14 / 29 )93.51149425287361.1693383225153379.9695797634717
Winsorized Mean ( 15 / 29 )93.61494252873561.1316679534879982.7229773894351
Winsorized Mean ( 16 / 29 )93.89080459770111.0554534139753488.9577913667112
Winsorized Mean ( 17 / 29 )94.45747126436780.9714236008593997.2361297180798
Winsorized Mean ( 18 / 29 )94.2712643678160.94639244974166699.6111754627259
Winsorized Mean ( 19 / 29 )94.2712643678160.934457128903064100.883455700615
Winsorized Mean ( 20 / 29 )94.50114942528740.896301310480094105.434576877578
Winsorized Mean ( 21 / 29 )94.76666666666670.854484321333095110.905097145398
Winsorized Mean ( 22 / 29 )94.66551724137930.795003824828618119.075549431208
Winsorized Mean ( 23 / 29 )94.71839080459770.781477515363385121.204243170776
Winsorized Mean ( 24 / 29 )94.82873563218390.76059549126049124.676962619157
Winsorized Mean ( 25 / 29 )94.85747126436780.735268095211646129.010726675232
Winsorized Mean ( 26 / 29 )94.85747126436780.697928412462555135.912895320703
Winsorized Mean ( 27 / 29 )94.82643678160920.678629883292827139.732185564089
Winsorized Mean ( 28 / 29 )94.9873563218390.643715750038507147.561025679668
Winsorized Mean ( 29 / 29 )94.5873563218390.594017678524494159.233234534010
Trimmed Mean ( 1 / 29 )91.99294117647061.6676421136282555.1634792769319
Trimmed Mean ( 2 / 29 )92.31.5867768309177058.1682302145909
Trimmed Mean ( 3 / 29 )92.57654320987651.5128811851107761.1922100168749
Trimmed Mean ( 4 / 29 )92.84936708860761.4360972951538064.6539530447786
Trimmed Mean ( 5 / 29 )93.1090909090911.3768285322826267.6257709118845
Trimmed Mean ( 6 / 29 )93.37466666666671.3091226596992971.326140430657
Trimmed Mean ( 7 / 29 )93.63698630136991.2370370570653775.6945685390424
Trimmed Mean ( 8 / 29 )93.73802816901411.2111809196438877.3939108920043
Trimmed Mean ( 9 / 29 )93.8362318840581.1847963609589579.2003039308028
Trimmed Mean ( 10 / 29 )93.93582089552241.1566019989805781.2170660074231
Trimmed Mean ( 11 / 29 )94.05384615384621.1250621284619883.5988020345352
Trimmed Mean ( 12 / 29 )94.1523809523811.0974645105815385.790820609307
Trimmed Mean ( 13 / 29 )94.2393442622951.0716472145236687.9387759190736
Trimmed Mean ( 14 / 29 )94.32372881355931.0433764229291090.4023962404306
Trimmed Mean ( 15 / 29 )94.41228070175441.0099910362621193.4783352644058
Trimmed Mean ( 16 / 29 )94.49636363636360.97619809367258696.8003976332876
Trimmed Mean ( 17 / 29 )94.55849056603770.949384622178699.5997705851288
Trimmed Mean ( 18 / 29 )94.56862745098040.93196183628031101.472639511106
Trimmed Mean ( 19 / 29 )94.59795918367350.914055448104867103.492582840358
Trimmed Mean ( 20 / 29 )94.62978723404260.893008691225989105.967375417285
Trimmed Mean ( 21 / 29 )94.64222222222220.873200827843373108.385401392677
Trimmed Mean ( 22 / 29 )94.63023255813950.85537538716979110.630062517050
Trimmed Mean ( 23 / 29 )94.62682926829270.84337464109782112.200230665125
Trimmed Mean ( 24 / 29 )94.61794871794870.829010692739082114.133568537370
Trimmed Mean ( 25 / 29 )94.59729729729730.813008782595782116.354582290324
Trimmed Mean ( 26 / 29 )94.57142857142860.795782701522983118.840769459346
Trimmed Mean ( 27 / 29 )94.54242424242420.779775490987804121.243133870058
Trimmed Mean ( 28 / 29 )94.51290322580650.760570554587166124.265793167746
Trimmed Mean ( 29 / 29 )94.46206896551720.740862461609611127.502841431981
Median93.6
Midrange79.2
Midmean - Weighted Average at Xnp94.415909090909
Midmean - Weighted Average at X(n+1)p94.6422222222222
Midmean - Empirical Distribution Function94.6422222222222
Midmean - Empirical Distribution Function - Averaging94.6422222222222
Midmean - Empirical Distribution Function - Interpolation94.6302325581395
Midmean - Closest Observation94.415909090909
Midmean - True Basic - Statistics Graphics Toolkit94.6422222222222
Midmean - MS Excel (old versions)94.6422222222222
Number of observations87


Parameters (Session):
Parameters (R input):
R code (references can be found in the software module):
geomean <- function(x) {
return(exp(mean(log(x))))
}
harmean <- function(x) {
return(1/mean(1/x))
}
quamean <- function(x) {
return(sqrt(mean(x*x)))
}
winmean <- function(x) {
x <-sort(x[!is.na(x)])
n<-length(x)
denom <- 3
nodenom <- n/denom
if (nodenom>40) denom <- n/40
sqrtn = sqrt(n)
roundnodenom = floor(nodenom)
win <- array(NA,dim=c(roundnodenom,2))
for (j in 1:roundnodenom) {
win[j,1] <- (j*x[j+1]+sum(x[(j+1):(n-j)])+j*x[n-j])/n
win[j,2] <- sd(c(rep(x[j+1],j),x[(j+1):(n-j)],rep(x[n-j],j)))/sqrtn
}
return(win)
}
trimean <- function(x) {
x <-sort(x[!is.na(x)])
n<-length(x)
denom <- 3
nodenom <- n/denom
if (nodenom>40) denom <- n/40
sqrtn = sqrt(n)
roundnodenom = floor(nodenom)
tri <- array(NA,dim=c(roundnodenom,2))
for (j in 1:roundnodenom) {
tri[j,1] <- mean(x,trim=j/n)
tri[j,2] <- sd(x[(j+1):(n-j)]) / sqrt(n-j*2)
}
return(tri)
}
midrange <- function(x) {
return((max(x)+min(x))/2)
}
q1 <- function(data,n,p,i,f) {
np <- n*p;
i <<- floor(np)
f <<- np - i
qvalue <- (1-f)*data[i] + f*data[i+1]
}
q2 <- function(data,n,p,i,f) {
np <- (n+1)*p
i <<- floor(np)
f <<- np - i
qvalue <- (1-f)*data[i] + f*data[i+1]
}
q3 <- function(data,n,p,i,f) {
np <- n*p
i <<- floor(np)
f <<- np - i
if (f==0) {
qvalue <- data[i]
} else {
qvalue <- data[i+1]
}
}
q4 <- function(data,n,p,i,f) {
np <- n*p
i <<- floor(np)
f <<- np - i
if (f==0) {
qvalue <- (data[i]+data[i+1])/2
} else {
qvalue <- data[i+1]
}
}
q5 <- function(data,n,p,i,f) {
np <- (n-1)*p
i <<- floor(np)
f <<- np - i
if (f==0) {
qvalue <- data[i+1]
} else {
qvalue <- data[i+1] + f*(data[i+2]-data[i+1])
}
}
q6 <- function(data,n,p,i,f) {
np <- n*p+0.5
i <<- floor(np)
f <<- np - i
qvalue <- data[i]
}
q7 <- function(data,n,p,i,f) {
np <- (n+1)*p
i <<- floor(np)
f <<- np - i
if (f==0) {
qvalue <- data[i]
} else {
qvalue <- f*data[i] + (1-f)*data[i+1]
}
}
q8 <- function(data,n,p,i,f) {
np <- (n+1)*p
i <<- floor(np)
f <<- np - i
if (f==0) {
qvalue <- data[i]
} else {
if (f == 0.5) {
qvalue <- (data[i]+data[i+1])/2
} else {
if (f < 0.5) {
qvalue <- data[i]
} else {
qvalue <- data[i+1]
}
}
}
}
midmean <- function(x,def) {
x <-sort(x[!is.na(x)])
n<-length(x)
if (def==1) {
qvalue1 <- q1(x,n,0.25,i,f)
qvalue3 <- q1(x,n,0.75,i,f)
}
if (def==2) {
qvalue1 <- q2(x,n,0.25,i,f)
qvalue3 <- q2(x,n,0.75,i,f)
}
if (def==3) {
qvalue1 <- q3(x,n,0.25,i,f)
qvalue3 <- q3(x,n,0.75,i,f)
}
if (def==4) {
qvalue1 <- q4(x,n,0.25,i,f)
qvalue3 <- q4(x,n,0.75,i,f)
}
if (def==5) {
qvalue1 <- q5(x,n,0.25,i,f)
qvalue3 <- q5(x,n,0.75,i,f)
}
if (def==6) {
qvalue1 <- q6(x,n,0.25,i,f)
qvalue3 <- q6(x,n,0.75,i,f)
}
if (def==7) {
qvalue1 <- q7(x,n,0.25,i,f)
qvalue3 <- q7(x,n,0.75,i,f)
}
if (def==8) {
qvalue1 <- q8(x,n,0.25,i,f)
qvalue3 <- q8(x,n,0.75,i,f)
}
midm <- 0
myn <- 0
roundno4 <- round(n/4)
round3no4 <- round(3*n/4)
for (i in 1:n) {
if ((x[i]>=qvalue1) & (x[i]<=qvalue3)){
midm = midm + x[i]
myn = myn + 1
}
}
midm = midm / myn
return(midm)
}
(arm <- mean(x))
sqrtn <- sqrt(length(x))
(armse <- sd(x) / sqrtn)
(armose <- arm / armse)
(geo <- geomean(x))
(har <- harmean(x))
(qua <- quamean(x))
(win <- winmean(x))
(tri <- trimean(x))
(midr <- midrange(x))
midm <- array(NA,dim=8)
for (j in 1:8) midm[j] <- midmean(x,j)
midm
bitmap(file='test1.png')
lb <- win[,1] - 2*win[,2]
ub <- win[,1] + 2*win[,2]
if ((ylimmin == '') | (ylimmax == '')) plot(win[,1],type='b',main=main, xlab='j', pch=19, ylab='Winsorized Mean(j/n)', ylim=c(min(lb),max(ub))) else plot(win[,1],type='l',main=main, xlab='j', pch=19, ylab='Winsorized Mean(j/n)', ylim=c(ylimmin,ylimmax))
lines(ub,lty=3)
lines(lb,lty=3)
grid()
dev.off()
bitmap(file='test2.png')
lb <- tri[,1] - 2*tri[,2]
ub <- tri[,1] + 2*tri[,2]
if ((ylimmin == '') | (ylimmax == '')) plot(tri[,1],type='b',main=main, xlab='j', pch=19, ylab='Trimmed Mean(j/n)', ylim=c(min(lb),max(ub))) else plot(tri[,1],type='l',main=main, xlab='j', pch=19, ylab='Trimmed Mean(j/n)', ylim=c(ylimmin,ylimmax))
lines(ub,lty=3)
lines(lb,lty=3)
grid()
dev.off()
load(file='createtable')
a<-table.start()
a<-table.row.start(a)
a<-table.element(a,'Central Tendency - Ungrouped Data',4,TRUE)
a<-table.row.end(a)
a<-table.row.start(a)
a<-table.element(a,'Measure',header=TRUE)
a<-table.element(a,'Value',header=TRUE)
a<-table.element(a,'S.E.',header=TRUE)
a<-table.element(a,'Value/S.E.',header=TRUE)
a<-table.row.end(a)
a<-table.row.start(a)
a<-table.element(a,hyperlink('arithmetic_mean.htm', 'Arithmetic Mean', 'click to view the definition of the Arithmetic Mean'),header=TRUE)
a<-table.element(a,arm)
a<-table.element(a,hyperlink('arithmetic_mean_standard_error.htm', armse, 'click to view the definition of the Standard Error of the Arithmetic Mean'))
a<-table.element(a,armose)
a<-table.row.end(a)
a<-table.row.start(a)
a<-table.element(a,hyperlink('geometric_mean.htm', 'Geometric Mean', 'click to view the definition of the Geometric Mean'),header=TRUE)
a<-table.element(a,geo)
a<-table.element(a,'')
a<-table.row.end(a)
a<-table.row.start(a)
a<-table.element(a,hyperlink('harmonic_mean.htm', 'Harmonic Mean', 'click to view the definition of the Harmonic Mean'),header=TRUE)
a<-table.element(a,har)
a<-table.element(a,'')
a<-table.row.end(a)
a<-table.row.start(a)
a<-table.element(a,hyperlink('quadratic_mean.htm', 'Quadratic Mean', 'click to view the definition of the Quadratic Mean'),header=TRUE)
a<-table.element(a,qua)
a<-table.element(a,'')
a<-table.row.end(a)
for (j in 1:length(win[,1])) {
a<-table.row.start(a)
mylabel <- paste('Winsorized Mean (',j)
mylabel <- paste(mylabel,'/')
mylabel <- paste(mylabel,length(win[,1]))
mylabel <- paste(mylabel,')')
a<-table.element(a,hyperlink('winsorized_mean.htm', mylabel, 'click to view the definition of the Winsorized Mean'),header=TRUE)
a<-table.element(a,win[j,1])
a<-table.element(a,win[j,2])
a<-table.element(a,win[j,1]/win[j,2])
a<-table.row.end(a)
}
for (j in 1:length(tri[,1])) {
a<-table.row.start(a)
mylabel <- paste('Trimmed Mean (',j)
mylabel <- paste(mylabel,'/')
mylabel <- paste(mylabel,length(tri[,1]))
mylabel <- paste(mylabel,')')
a<-table.element(a,hyperlink('arithmetic_mean.htm', mylabel, 'click to view the definition of the Trimmed Mean'),header=TRUE)
a<-table.element(a,tri[j,1])
a<-table.element(a,tri[j,2])
a<-table.element(a,tri[j,1]/tri[j,2])
a<-table.row.end(a)
}
a<-table.row.start(a)
a<-table.element(a,hyperlink('median_1.htm', 'Median', 'click to view the definition of the Median'),header=TRUE)
a<-table.element(a,median(x))
a<-table.element(a,'')
a<-table.row.end(a)
a<-table.row.start(a)
a<-table.element(a,hyperlink('midrange.htm', 'Midrange', 'click to view the definition of the Midrange'),header=TRUE)
a<-table.element(a,midr)
a<-table.element(a,'')
a<-table.row.end(a)
a<-table.row.start(a)
mymid <- hyperlink('midmean.htm', 'Midmean', 'click to view the definition of the Midmean')
mylabel <- paste(mymid,hyperlink('method_1.htm','Weighted Average at Xnp',''),sep=' - ')
a<-table.element(a,mylabel,header=TRUE)
a<-table.element(a,midm[1])
a<-table.element(a,'')
a<-table.row.end(a)
a<-table.row.start(a)
mymid <- hyperlink('midmean.htm', 'Midmean', 'click to view the definition of the Midmean')
mylabel <- paste(mymid,hyperlink('method_2.htm','Weighted Average at X(n+1)p',''),sep=' - ')
a<-table.element(a,mylabel,header=TRUE)
a<-table.element(a,midm[2])
a<-table.element(a,'')
a<-table.row.end(a)
a<-table.row.start(a)
mymid <- hyperlink('midmean.htm', 'Midmean', 'click to view the definition of the Midmean')
mylabel <- paste(mymid,hyperlink('method_3.htm','Empirical Distribution Function',''),sep=' - ')
a<-table.element(a,mylabel,header=TRUE)
a<-table.element(a,midm[3])
a<-table.element(a,'')
a<-table.row.end(a)
a<-table.row.start(a)
mymid <- hyperlink('midmean.htm', 'Midmean', 'click to view the definition of the Midmean')
mylabel <- paste(mymid,hyperlink('method_4.htm','Empirical Distribution Function - Averaging',''),sep=' - ')
a<-table.element(a,mylabel,header=TRUE)
a<-table.element(a,midm[4])
a<-table.element(a,'')
a<-table.row.end(a)
a<-table.row.start(a)
mymid <- hyperlink('midmean.htm', 'Midmean', 'click to view the definition of the Midmean')
mylabel <- paste(mymid,hyperlink('method_5.htm','Empirical Distribution Function - Interpolation',''),sep=' - ')
a<-table.element(a,mylabel,header=TRUE)
a<-table.element(a,midm[5])
a<-table.element(a,'')
a<-table.row.end(a)
a<-table.row.start(a)
mymid <- hyperlink('midmean.htm', 'Midmean', 'click to view the definition of the Midmean')
mylabel <- paste(mymid,hyperlink('method_6.htm','Closest Observation',''),sep=' - ')
a<-table.element(a,mylabel,header=TRUE)
a<-table.element(a,midm[6])
a<-table.element(a,'')
a<-table.row.end(a)
a<-table.row.start(a)
mymid <- hyperlink('midmean.htm', 'Midmean', 'click to view the definition of the Midmean')
mylabel <- paste(mymid,hyperlink('method_7.htm','True Basic - Statistics Graphics Toolkit',''),sep=' - ')
a<-table.element(a,mylabel,header=TRUE)
a<-table.element(a,midm[7])
a<-table.element(a,'')
a<-table.row.end(a)
a<-table.row.start(a)
mymid <- hyperlink('midmean.htm', 'Midmean', 'click to view the definition of the Midmean')
mylabel <- paste(mymid,hyperlink('method_8.htm','MS Excel (old versions)',''),sep=' - ')
a<-table.element(a,mylabel,header=TRUE)
a<-table.element(a,midm[8])
a<-table.element(a,'')
a<-table.row.end(a)
a<-table.row.start(a)
a<-table.element(a,'Number of observations',header=TRUE)
a<-table.element(a,length(x))
a<-table.element(a,'')
a<-table.row.end(a)
a<-table.end(a)
table.save(a,file='mytable.tab')