Free Statistics
of Irreproducible Research!
Description of Statistical Computation | |||||||||||||||||||||||||||||||||
|---|---|---|---|---|---|---|---|---|---|---|---|---|---|---|---|---|---|---|---|---|---|---|---|---|---|---|---|---|---|---|---|---|---|
| Author's title | |||||||||||||||||||||||||||||||||
| Author | *The author of this computation has been verified* | ||||||||||||||||||||||||||||||||
| R Software Module | rwasp_meanversusmedian.wasp | ||||||||||||||||||||||||||||||||
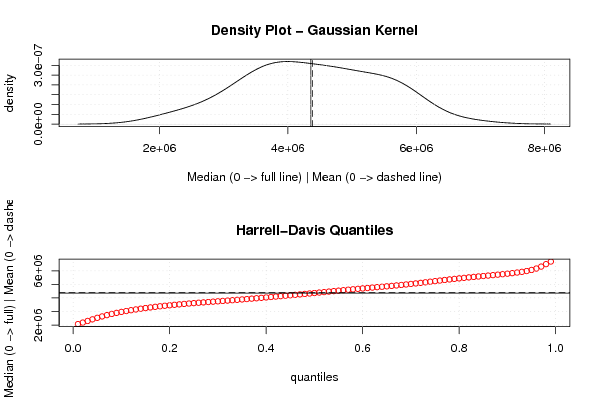
| Title produced by software | Mean versus Median | ||||||||||||||||||||||||||||||||
| Date of computation | Mon, 19 Oct 2009 13:14:12 -0600 | ||||||||||||||||||||||||||||||||
| Cite this page as follows | Statistical Computations at FreeStatistics.org, Office for Research Development and Education, URL https://freestatistics.org/blog/index.php?v=date/2009/Oct/19/t1255979744lxbc51hpbbdyw38.htm/, Retrieved Mon, 29 Apr 2024 21:37:14 +0000 | ||||||||||||||||||||||||||||||||
| Statistical Computations at FreeStatistics.org, Office for Research Development and Education, URL https://freestatistics.org/blog/index.php?pk=48129, Retrieved Mon, 29 Apr 2024 21:37:14 +0000 | |||||||||||||||||||||||||||||||||
| QR Codes: | |||||||||||||||||||||||||||||||||
|
| |||||||||||||||||||||||||||||||||
| Original text written by user: | |||||||||||||||||||||||||||||||||
| IsPrivate? | No (this computation is public) | ||||||||||||||||||||||||||||||||
| User-defined keywords | ShwWs3V2 | ||||||||||||||||||||||||||||||||
| Estimated Impact | 131 | ||||||||||||||||||||||||||||||||
Tree of Dependent Computations | |||||||||||||||||||||||||||||||||
| Family? (F = Feedback message, R = changed R code, M = changed R Module, P = changed Parameters, D = changed Data) | |||||||||||||||||||||||||||||||||
| - [Bivariate Data Series] [Bivariate dataset] [2008-01-05 23:51:08] [74be16979710d4c4e7c6647856088456] F RMPD [Univariate Explorative Data Analysis] [Colombia Coffee] [2008-01-07 14:21:11] [74be16979710d4c4e7c6647856088456] F RMPD [Univariate Data Series] [] [2009-10-14 08:30:28] [74be16979710d4c4e7c6647856088456] - RMP [Mean versus Median] [Ws3 part 1 mean v...] [2009-10-18 14:09:14] [e0fc65a5811681d807296d590d5b45de] - D [Mean versus Median] [WS3 Part 2 Yt mea...] [2009-10-18 16:50:27] [e0fc65a5811681d807296d590d5b45de] - R D [Mean versus Median] [WS3Part2Yt/Xt] [2009-10-18 19:21:00] [e0fc65a5811681d807296d590d5b45de] - R D [Mean versus Median] [WS3Part2Yt*Xt] [2009-10-19 19:14:12] [51108381f3361ca8af49c4f74052c840] [Current] | |||||||||||||||||||||||||||||||||
| Feedback Forum | |||||||||||||||||||||||||||||||||
Post a new message | |||||||||||||||||||||||||||||||||
Dataset | |||||||||||||||||||||||||||||||||
| Dataseries X: | |||||||||||||||||||||||||||||||||
6165561,60 4930198,00 5425516,80 4882416,00 5013277,20 4824106,60 4386552,80 3612685,50 3354824,00 4573662,50 3607962,50 2313181,20 6068078,55 5733506,24 5801696,32 5679979,04 4473715,68 4134416,13 3817990,84 2860636,20 3467462,88 4132339,80 3002307,36 2004734,61 5512120,68 4808915,54 5330777,00 4821427,17 4115383,80 4432005,74 3902015,55 3196453,24 3798522,75 4694299,60 3333356,94 2913313,14 5227244,40 5552024,24 6820771,05 5963048,74 4331811,21 4820109,95 3463539,62 3293941,28 3729726,82 4312980,00 3719352,72 2773137,94 5691542,88 5058654,30 5838951,24 5399831,16 4662499,05 5538644,50 3662097,01 3730770,83 3982615,85 4148178,34 3991276,66 2349702,88 | |||||||||||||||||||||||||||||||||
Tables (Output of Computation) | |||||||||||||||||||||||||||||||||
| |||||||||||||||||||||||||||||||||
Figures (Output of Computation) | |||||||||||||||||||||||||||||||||
Input Parameters & R Code | |||||||||||||||||||||||||||||||||
| Parameters (Session): | |||||||||||||||||||||||||||||||||
| Parameters (R input): | |||||||||||||||||||||||||||||||||
| R code (references can be found in the software module): | |||||||||||||||||||||||||||||||||
library(Hmisc) | |||||||||||||||||||||||||||||||||