Free Statistics
of Irreproducible Research!
Description of Statistical Computation | |||||||||||||||||||||||||||||||||||||||||
|---|---|---|---|---|---|---|---|---|---|---|---|---|---|---|---|---|---|---|---|---|---|---|---|---|---|---|---|---|---|---|---|---|---|---|---|---|---|---|---|---|---|
| Author's title | |||||||||||||||||||||||||||||||||||||||||
| Author | *Unverified author* | ||||||||||||||||||||||||||||||||||||||||
| R Software Module | rwasp_univariatedataseries.wasp | ||||||||||||||||||||||||||||||||||||||||
| Title produced by software | Univariate Data Series | ||||||||||||||||||||||||||||||||||||||||
| Date of computation | Mon, 19 Oct 2009 13:56:11 -0600 | ||||||||||||||||||||||||||||||||||||||||
| Cite this page as follows | Statistical Computations at FreeStatistics.org, Office for Research Development and Education, URL https://freestatistics.org/blog/index.php?v=date/2009/Oct/19/t1255982234qg3gto8qq0wgucb.htm/, Retrieved Mon, 29 Apr 2024 20:01:05 +0000 | ||||||||||||||||||||||||||||||||||||||||
| Statistical Computations at FreeStatistics.org, Office for Research Development and Education, URL https://freestatistics.org/blog/index.php?pk=48199, Retrieved Mon, 29 Apr 2024 20:01:05 +0000 | |||||||||||||||||||||||||||||||||||||||||
| QR Codes: | |||||||||||||||||||||||||||||||||||||||||
|
| |||||||||||||||||||||||||||||||||||||||||
| Original text written by user: | |||||||||||||||||||||||||||||||||||||||||
| IsPrivate? | No (this computation is public) | ||||||||||||||||||||||||||||||||||||||||
| User-defined keywords | |||||||||||||||||||||||||||||||||||||||||
| Estimated Impact | 113 | ||||||||||||||||||||||||||||||||||||||||
Tree of Dependent Computations | |||||||||||||||||||||||||||||||||||||||||
| Family? (F = Feedback message, R = changed R code, M = changed R Module, P = changed Parameters, D = changed Data) | |||||||||||||||||||||||||||||||||||||||||
| - [Bivariate Data Series] [Bivariate dataset] [2008-01-05 23:51:08] [74be16979710d4c4e7c6647856088456] F RMPD [Univariate Explorative Data Analysis] [Colombia Coffee] [2008-01-07 14:21:11] [74be16979710d4c4e7c6647856088456] F RMPD [Univariate Data Series] [] [2009-10-14 08:30:28] [74be16979710d4c4e7c6647856088456] - PD [Univariate Data Series] [JJ Workshop 3, De...] [2009-10-19 19:56:11] [e31f2fa83f4a5291b9a51009566cf69b] [Current] - RMPD [Central Tendency] [JJ Workshop 3, de...] [2009-10-20 15:38:48] [96e597a9107bfe8c07649cce3d4f6fec] | |||||||||||||||||||||||||||||||||||||||||
| Feedback Forum | |||||||||||||||||||||||||||||||||||||||||
Post a new message | |||||||||||||||||||||||||||||||||||||||||
Dataset | |||||||||||||||||||||||||||||||||||||||||
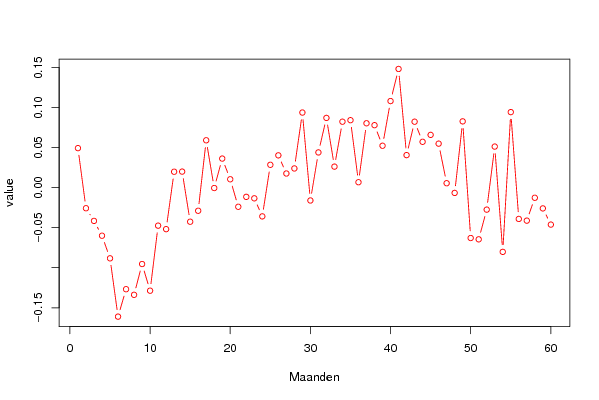
| Dataseries X: | |||||||||||||||||||||||||||||||||||||||||
0,049411765 -0,02566077 -0,041514085 -0,06 -0,088237585 -0,161123596 -0,126827697 -0,13385399 -0,095361842 -0,12870229 -0,047432675 -0,051803279 0,019913607 0,020076263 -0,042543641 -0,02883593 0,059226638 -0,000435281 0,036351731 0,010519099 -0,023867188 -0,011456311 -0,013280318 -0,035845411 0,028580576 0,040389864 0,017705828 0,024041549 0,093846154 -0,01599022 0,044046243 0,087181628 0,026299892 0,082433234 0,084318182 0,006810345 0,080468227 0,078075314 0,052394958 0,108214654 0,148333333 0,040680272 0,082427282 0,057312073 0,065958379 0,055015974 0,005555556 -0,006547884 0,082857143 -0,062879079 -0,064512635 -0,027420814 0,051366246 -0,080179372 0,094404145 -0,039035639 -0,041188119 -0,01260223 -0,025884861 -0,046140725 | |||||||||||||||||||||||||||||||||||||||||
Tables (Output of Computation) | |||||||||||||||||||||||||||||||||||||||||
| |||||||||||||||||||||||||||||||||||||||||
Figures (Output of Computation) | |||||||||||||||||||||||||||||||||||||||||
Input Parameters & R Code | |||||||||||||||||||||||||||||||||||||||||
| Parameters (Session): | |||||||||||||||||||||||||||||||||||||||||
| par1 = e2(t) ; par3 = reeks van foute op de constante c bij methode 3 ; | |||||||||||||||||||||||||||||||||||||||||
| Parameters (R input): | |||||||||||||||||||||||||||||||||||||||||
| par1 = e2(t) ; par2 = ; par3 = reeks van foute op de constante c bij methode 3 ; | |||||||||||||||||||||||||||||||||||||||||
| R code (references can be found in the software module): | |||||||||||||||||||||||||||||||||||||||||
bitmap(file='test1.png') | |||||||||||||||||||||||||||||||||||||||||