Free Statistics
of Irreproducible Research!
Description of Statistical Computation | |||||||||||||||||||||||||||||||||||||||||
|---|---|---|---|---|---|---|---|---|---|---|---|---|---|---|---|---|---|---|---|---|---|---|---|---|---|---|---|---|---|---|---|---|---|---|---|---|---|---|---|---|---|
| Author's title | |||||||||||||||||||||||||||||||||||||||||
| Author | *The author of this computation has been verified* | ||||||||||||||||||||||||||||||||||||||||
| R Software Module | rwasp_univariatedataseries.wasp | ||||||||||||||||||||||||||||||||||||||||
| Title produced by software | Univariate Data Series | ||||||||||||||||||||||||||||||||||||||||
| Date of computation | Mon, 19 Oct 2009 15:14:21 -0600 | ||||||||||||||||||||||||||||||||||||||||
| Cite this page as follows | Statistical Computations at FreeStatistics.org, Office for Research Development and Education, URL https://freestatistics.org/blog/index.php?v=date/2009/Oct/19/t1255987056bn7a82v7kd2hjcv.htm/, Retrieved Mon, 29 Apr 2024 18:49:09 +0000 | ||||||||||||||||||||||||||||||||||||||||
| Statistical Computations at FreeStatistics.org, Office for Research Development and Education, URL https://freestatistics.org/blog/index.php?pk=48253, Retrieved Mon, 29 Apr 2024 18:49:09 +0000 | |||||||||||||||||||||||||||||||||||||||||
| QR Codes: | |||||||||||||||||||||||||||||||||||||||||
|
| |||||||||||||||||||||||||||||||||||||||||
| Original text written by user: | |||||||||||||||||||||||||||||||||||||||||
| IsPrivate? | No (this computation is public) | ||||||||||||||||||||||||||||||||||||||||
| User-defined keywords | workshop 2 | ||||||||||||||||||||||||||||||||||||||||
| Estimated Impact | 148 | ||||||||||||||||||||||||||||||||||||||||
Tree of Dependent Computations | |||||||||||||||||||||||||||||||||||||||||
| Family? (F = Feedback message, R = changed R code, M = changed R Module, P = changed Parameters, D = changed Data) | |||||||||||||||||||||||||||||||||||||||||
| - [Univariate Data Series] [Populatiecijfers ...] [2009-10-19 21:14:21] [85defb7a20869746625978e6577e6e44] [Current] | |||||||||||||||||||||||||||||||||||||||||
| Feedback Forum | |||||||||||||||||||||||||||||||||||||||||
Post a new message | |||||||||||||||||||||||||||||||||||||||||
Dataset | |||||||||||||||||||||||||||||||||||||||||
| Dataseries X: | |||||||||||||||||||||||||||||||||||||||||
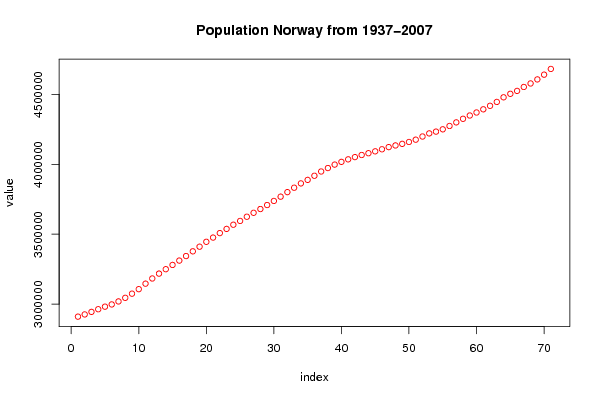
2910798 2926686 2944920 2963909 2982224 2998244 3019521 3045337 3075084 3107269 3146497 3183525 3218499 3249954 3280296 3311446 3344010 3377766 3410726 3445673 3475890 3507986 3538001 3567707 3594771 3624829 3653006 3680068 3708609 3737726 3768298 3800780 3832192 3863221 3888305 3917773 3948235 3972990 3997525 4017101 4035202 4051208 4066134 4078900 4092340 4107063 4122511 4134353 4145845 4159187 4175521 4198289 4220686 4233116 4249830 4273634 4299167 4324815 4348410 4369957 4392714 4417599 4445329 4478497 4503436 4524066 4552252 4577457 4606363 4640219 4681134 | |||||||||||||||||||||||||||||||||||||||||
Tables (Output of Computation) | |||||||||||||||||||||||||||||||||||||||||
| |||||||||||||||||||||||||||||||||||||||||
Figures (Output of Computation) | |||||||||||||||||||||||||||||||||||||||||
Input Parameters & R Code | |||||||||||||||||||||||||||||||||||||||||
| Parameters (Session): | |||||||||||||||||||||||||||||||||||||||||
| par1 = Jaarlijkse Populatiecijfers Noorwegen ; par2 = http://statbank.ssb.no/statistikkbanken/Default_FR.asp?PXSid=0&nvl=true&PLanguage=1&tilside=selecttable/hovedtabellHjem.asp&KortnavnWeb=dode ; par3 = Jaarlijkse aantal inwoners van Noorwegen van 1937 tot 2007 ; | |||||||||||||||||||||||||||||||||||||||||
| Parameters (R input): | |||||||||||||||||||||||||||||||||||||||||
| par1 = Jaarlijkse Populatiecijfers Noorwegen ; par2 = http://statbank.ssb.no/statistikkbanken/Default_FR.asp?PXSid=0&nvl=true&PLanguage=1&tilside=selecttable/hovedtabellHjem.asp&KortnavnWeb=dode ; par3 = Jaarlijkse aantal inwoners van Noorwegen van 1937 tot 2007 ; | |||||||||||||||||||||||||||||||||||||||||
| R code (references can be found in the software module): | |||||||||||||||||||||||||||||||||||||||||
bitmap(file='test1.png') | |||||||||||||||||||||||||||||||||||||||||