Free Statistics
of Irreproducible Research!
Description of Statistical Computation | |||||||||||||||||||||||||||||||||||||||||
|---|---|---|---|---|---|---|---|---|---|---|---|---|---|---|---|---|---|---|---|---|---|---|---|---|---|---|---|---|---|---|---|---|---|---|---|---|---|---|---|---|---|
| Author's title | |||||||||||||||||||||||||||||||||||||||||
| Author | *The author of this computation has been verified* | ||||||||||||||||||||||||||||||||||||||||
| R Software Module | rwasp_univariatedataseries.wasp | ||||||||||||||||||||||||||||||||||||||||
| Title produced by software | Univariate Data Series | ||||||||||||||||||||||||||||||||||||||||
| Date of computation | Mon, 19 Oct 2009 15:35:49 -0600 | ||||||||||||||||||||||||||||||||||||||||
| Cite this page as follows | Statistical Computations at FreeStatistics.org, Office for Research Development and Education, URL https://freestatistics.org/blog/index.php?v=date/2009/Oct/19/t1255988195p7ckufnygu6laa1.htm/, Retrieved Mon, 29 Apr 2024 22:33:26 +0000 | ||||||||||||||||||||||||||||||||||||||||
| Statistical Computations at FreeStatistics.org, Office for Research Development and Education, URL https://freestatistics.org/blog/index.php?pk=48264, Retrieved Mon, 29 Apr 2024 22:33:26 +0000 | |||||||||||||||||||||||||||||||||||||||||
| QR Codes: | |||||||||||||||||||||||||||||||||||||||||
|
| |||||||||||||||||||||||||||||||||||||||||
| Original text written by user: | |||||||||||||||||||||||||||||||||||||||||
| IsPrivate? | No (this computation is public) | ||||||||||||||||||||||||||||||||||||||||
| User-defined keywords | workshop 2 tijdreeksen | ||||||||||||||||||||||||||||||||||||||||
| Estimated Impact | 110 | ||||||||||||||||||||||||||||||||||||||||
Tree of Dependent Computations | |||||||||||||||||||||||||||||||||||||||||
| Family? (F = Feedback message, R = changed R code, M = changed R Module, P = changed Parameters, D = changed Data) | |||||||||||||||||||||||||||||||||||||||||
| - [Univariate Data Series] [Populatieaangroei...] [2009-10-19 21:35:49] [85defb7a20869746625978e6577e6e44] [Current] - RMPD [(Partial) Autocorrelation Function] [WS8 ACF originele...] [2009-11-28 14:04:19] [9319fa3e1cb204243a6af248e59767c6] - RMPD [(Partial) Autocorrelation Function] [WS8 ACF reeks met...] [2009-11-28 14:13:10] [9319fa3e1cb204243a6af248e59767c6] - RMP [ARIMA Backward Selection] [ARIMA backward se...] [2009-12-11 14:15:55] [9319fa3e1cb204243a6af248e59767c6] | |||||||||||||||||||||||||||||||||||||||||
| Feedback Forum | |||||||||||||||||||||||||||||||||||||||||
Post a new message | |||||||||||||||||||||||||||||||||||||||||
Dataset | |||||||||||||||||||||||||||||||||||||||||
| Dataseries X: | |||||||||||||||||||||||||||||||||||||||||
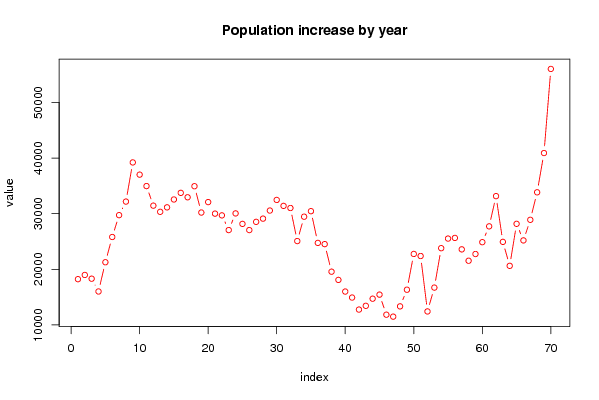
18234 18989 18315 16020 21277 25816 29747 32185 39228 37028 34974 31455 30342 31150 32564 33756 32960 34947 30217 32096 30015 29706 27064 30058 28177 27062 28541 29117 30572 32482 31412 31029 25084 29468 30462 24755 24535 19576 18101 16006 14926 12766 13440 14723 15448 11842 11492 13342 16334 22768 22397 12430 16714 23804 25533 25648 23595 21547 22757 24885 27730 33168 24939 20630 28186 25205 28906 33856 40915 56037 | |||||||||||||||||||||||||||||||||||||||||
Tables (Output of Computation) | |||||||||||||||||||||||||||||||||||||||||
| |||||||||||||||||||||||||||||||||||||||||
Figures (Output of Computation) | |||||||||||||||||||||||||||||||||||||||||
Input Parameters & R Code | |||||||||||||||||||||||||||||||||||||||||
| Parameters (Session): | |||||||||||||||||||||||||||||||||||||||||
| par1 = Populatieaangroei Noorwegen ; par2 = http://statbank.ssb.no/statistikkbanken/Default_FR.asp?PXSid=0&nvl=true&PLanguage=1&tilside=selecttable/hovedtabellHjem.asp&KortnavnWeb=dode ; par3 = Jaarlijkse populatiegroei van 1937 tot 2007 ; | |||||||||||||||||||||||||||||||||||||||||
| Parameters (R input): | |||||||||||||||||||||||||||||||||||||||||
| par1 = Populatieaangroei Noorwegen ; par2 = http://statbank.ssb.no/statistikkbanken/Default_FR.asp?PXSid=0&nvl=true&PLanguage=1&tilside=selecttable/hovedtabellHjem.asp&KortnavnWeb=dode ; par3 = Jaarlijkse populatiegroei van 1937 tot 2007 ; | |||||||||||||||||||||||||||||||||||||||||
| R code (references can be found in the software module): | |||||||||||||||||||||||||||||||||||||||||
bitmap(file='test1.png') | |||||||||||||||||||||||||||||||||||||||||
