Free Statistics
of Irreproducible Research!
Description of Statistical Computation | |||||||||||||||||||||||||||||||||||||||||
|---|---|---|---|---|---|---|---|---|---|---|---|---|---|---|---|---|---|---|---|---|---|---|---|---|---|---|---|---|---|---|---|---|---|---|---|---|---|---|---|---|---|
| Author's title | |||||||||||||||||||||||||||||||||||||||||
| Author | *The author of this computation has been verified* | ||||||||||||||||||||||||||||||||||||||||
| R Software Module | rwasp_univariatedataseries.wasp | ||||||||||||||||||||||||||||||||||||||||
| Title produced by software | Univariate Data Series | ||||||||||||||||||||||||||||||||||||||||
| Date of computation | Wed, 21 Oct 2009 10:48:55 -0600 | ||||||||||||||||||||||||||||||||||||||||
| Cite this page as follows | Statistical Computations at FreeStatistics.org, Office for Research Development and Education, URL https://freestatistics.org/blog/index.php?v=date/2009/Oct/21/t12561438076m1biyz7tgfs2wr.htm/, Retrieved Thu, 02 May 2024 00:02:47 +0000 | ||||||||||||||||||||||||||||||||||||||||
| Statistical Computations at FreeStatistics.org, Office for Research Development and Education, URL https://freestatistics.org/blog/index.php?pk=49503, Retrieved Thu, 02 May 2024 00:02:47 +0000 | |||||||||||||||||||||||||||||||||||||||||
| QR Codes: | |||||||||||||||||||||||||||||||||||||||||
|
| |||||||||||||||||||||||||||||||||||||||||
| Original text written by user: | |||||||||||||||||||||||||||||||||||||||||
| IsPrivate? | No (this computation is public) | ||||||||||||||||||||||||||||||||||||||||
| User-defined keywords | WS3, Part 2, Grafiek 3 | ||||||||||||||||||||||||||||||||||||||||
| Estimated Impact | 87 | ||||||||||||||||||||||||||||||||||||||||
Tree of Dependent Computations | |||||||||||||||||||||||||||||||||||||||||
| Family? (F = Feedback message, R = changed R code, M = changed R Module, P = changed Parameters, D = changed Data) | |||||||||||||||||||||||||||||||||||||||||
| - [Bivariate Data Series] [Bivariate dataset] [2008-01-05 23:51:08] [74be16979710d4c4e7c6647856088456] F RMPD [Univariate Explorative Data Analysis] [Colombia Coffee] [2008-01-07 14:21:11] [74be16979710d4c4e7c6647856088456] F RMPD [Univariate Data Series] [] [2009-10-14 08:30:28] [74be16979710d4c4e7c6647856088456] - PD [Univariate Data Series] [Workshop 3, Part ...] [2009-10-21 16:48:55] [a53416c107f5e7e1e12bb9940270d09d] [Current] - RM D [Central Tendency] [Workshop 3, Part 3] [2009-10-21 17:31:55] [aba88da643e3763d32ff92bd8f92a385] | |||||||||||||||||||||||||||||||||||||||||
| Feedback Forum | |||||||||||||||||||||||||||||||||||||||||
Post a new message | |||||||||||||||||||||||||||||||||||||||||
Dataset | |||||||||||||||||||||||||||||||||||||||||
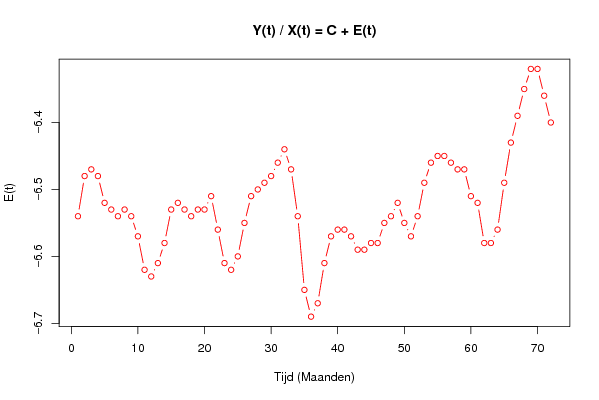
| Dataseries X: | |||||||||||||||||||||||||||||||||||||||||
-6,54 -6,48 -6,47 -6,48 -6,52 -6,53 -6,54 -6,53 -6,54 -6,57 -6,62 -6,63 -6,61 -6,58 -6,53 -6,52 -6,53 -6,54 -6,53 -6,53 -6,51 -6,56 -6,61 -6,62 -6,60 -6,55 -6,51 -6,50 -6,49 -6,48 -6,46 -6,44 -6,47 -6,54 -6,65 -6,69 -6,67 -6,61 -6,57 -6,56 -6,56 -6,57 -6,59 -6,59 -6,58 -6,58 -6,55 -6,54 -6,52 -6,55 -6,57 -6,54 -6,49 -6,46 -6,45 -6,45 -6,46 -6,47 -6,47 -6,51 -6,52 -6,58 -6,58 -6,56 -6,49 -6,43 -6,39 -6,35 -6,32 -6,32 -6,36 -6,40 | |||||||||||||||||||||||||||||||||||||||||
Tables (Output of Computation) | |||||||||||||||||||||||||||||||||||||||||
| |||||||||||||||||||||||||||||||||||||||||
Figures (Output of Computation) | |||||||||||||||||||||||||||||||||||||||||
Input Parameters & R Code | |||||||||||||||||||||||||||||||||||||||||
| Parameters (Session): | |||||||||||||||||||||||||||||||||||||||||
| par1 = Werkloosheid ; par2 = Belgostat ; par3 = Werkloosheid Mannen E(t) ; | |||||||||||||||||||||||||||||||||||||||||
| Parameters (R input): | |||||||||||||||||||||||||||||||||||||||||
| par1 = Werkloosheid ; par2 = Belgostat ; par3 = Werkloosheid Mannen E(t) ; | |||||||||||||||||||||||||||||||||||||||||
| R code (references can be found in the software module): | |||||||||||||||||||||||||||||||||||||||||
bitmap(file='test1.png') | |||||||||||||||||||||||||||||||||||||||||