Free Statistics

of Irreproducible Research!

Author's title

Author*The author of this computation has been verified*
R Software Modulerwasp_summary1.wasp
Title produced by softwareUnivariate Summary Statistics
Date of computationSun, 25 Oct 2009 05:47:40 -0600
Cite this page as followsStatistical Computations at FreeStatistics.org, Office for Research Development and Education, URL https://freestatistics.org/blog/index.php?v=date/2009/Oct/25/t1256471652i1yb1sz4jwcc6xw.htm/, Retrieved Mon, 29 Apr 2024 15:07:06 +0000
Statistical Computations at FreeStatistics.org, Office for Research Development and Education, URL https://freestatistics.org/blog/index.php?pk=50297, Retrieved Mon, 29 Apr 2024 15:07:06 +0000
QR Codes:

Original text written by user:
IsPrivate?No (this computation is public)
User-defined keywords
Estimated Impact204
Family? (F = Feedback message, R = changed R code, M = changed R Module, P = changed Parameters, D = changed Data)
-     [Bivariate Data Series] [Bivariate dataset] [2008-01-05 23:51:08] [74be16979710d4c4e7c6647856088456]
- RMPD  [Bivariate Explorative Data Analysis] [ws 4] [2009-10-23 17:39:06] [b5908418e3090fddbd22f5f0f774653d]
- RM D      [Univariate Summary Statistics] [ws 4] [2009-10-25 11:47:40] [f7d3e79b917995ba1c8c80042fc22ef9] [Current]
- RM          [Univariate Explorative Data Analysis] [ws 4] [2009-10-25 12:11:47] [b5908418e3090fddbd22f5f0f774653d]
Feedback Forum

Post a new message
Dataseries X:
0.148646309
0.193804029
0.131910607
0.048982359
0.035920892
0.052430242
0.062010996
0.076835147
0.038935146
0.028633045
0.030047843
0.028588494
0.070373946
0.125599266
0.093117457
0.082838021
0.069228352
0.089461571
0.090135825
0.119156645
0.084594868
0.077924504
0.050993737
-0.012468929
0.014611083
0.064006082
0.060022728
0.027923409
0.015205745
0.021403349
0.021403349
0.047156409
0.036829054
0.005311826
-0.046777916
-0.085262281
-0.076011397
-0.078430257
-0.067808537
-0.084313313
-0.08589517
-0.055971412
-0.075210786
-0.11300426
-0.169796642
-0.220749887
-0.146468921
-0.052085939
0.003958635
-0.012954959
-0.100487052
-0.175181637
-0.163935918
-0.060773277
-0.019995189
0.019465346
-0.05531767
-0.094184475
-0.065037375
-0.049343114


Summary of computational transaction
Raw Inputview raw input (R code)
Raw Outputview raw output of R engine
Computing time4 seconds
R Server'RServer@AstonUniversity' @ vre.aston.ac.uk

\begin{tabular}{lllllllll}
\hline
Summary of computational transaction \tabularnewline
Raw Input & view raw input (R code)  \tabularnewline
Raw Output & view raw output of R engine  \tabularnewline
Computing time & 4 seconds \tabularnewline
R Server & 'RServer@AstonUniversity' @ vre.aston.ac.uk \tabularnewline
\hline
\end{tabular}
%Source: https://freestatistics.org/blog/index.php?pk=50297&T=0

[TABLE]
[ROW][C]Summary of computational transaction[/C][/ROW]
[ROW][C]Raw Input[/C][C]view raw input (R code) [/C][/ROW]
[ROW][C]Raw Output[/C][C]view raw output of R engine [/C][/ROW]
[ROW][C]Computing time[/C][C]4 seconds[/C][/ROW]
[ROW][C]R Server[/C][C]'RServer@AstonUniversity' @ vre.aston.ac.uk[/C][/ROW]
[/TABLE]
Source: https://freestatistics.org/blog/index.php?pk=50297&T=0

Globally Unique Identifier (entire table): ba.freestatistics.org/blog/index.php?pk=50297&T=0

As an alternative you can also use a QR Code:  

The GUIDs for individual cells are displayed in the table below:

Summary of computational transaction
Raw Inputview raw input (R code)
Raw Outputview raw output of R engine
Computing time4 seconds
R Server'RServer@AstonUniversity' @ vre.aston.ac.uk


Central Tendency - Ungrouped Data
MeasureValueS.E.Value/S.E.
Arithmetic Mean5.00000004755775e-110.01130949445088574.42106415036630e-09
Geometric MeanNaN
Harmonic Mean0.0819855173246095
Quadratic Mean0.0868698752119644
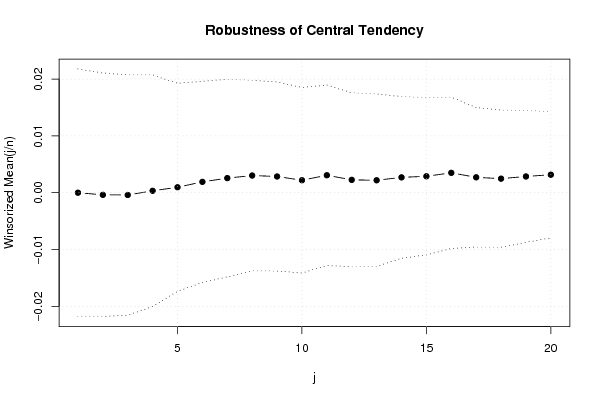
Winsorized Mean ( 1 / 20 )6.84221666666744e-060.01088299776962230.000628706980512861
Winsorized Mean ( 2 / 20 )-0.0003715146833333320.0107114438265894-0.0346839034352313
Winsorized Mean ( 3 / 20 )-0.0003940455333333340.0105688157389198-0.0372837925333731
Winsorized Mean ( 4 / 20 )0.0003409128666666680.01018785458971160.0334626749591562
Winsorized Mean ( 5 / 20 )0.0009597022833333360.009149165692796030.104895059894805
Winsorized Mean ( 6 / 20 )0.001913259883333330.00884337950572090.216349403765339
Winsorized Mean ( 7 / 20 )0.002569897566666670.008688491052520030.295781805049024
Winsorized Mean ( 8 / 20 )0.00302624450.008376089322262410.361295633746012
Winsorized Mean ( 9 / 20 )0.00285765080.008315794457295890.343641345956168
Winsorized Mean ( 10 / 20 )0.002196892633333330.008156168272131730.269353519941435
Winsorized Mean ( 11 / 20 )0.003075737450.007933827283925660.387673860285767
Winsorized Mean ( 12 / 20 )0.002267269250.007650375976458190.296360500056058
Winsorized Mean ( 13 / 20 )0.002192522933333340.007583006671625580.289136358212292
Winsorized Mean ( 14 / 20 )0.00270118470.007107833252082980.380029272522454
Winsorized Mean ( 15 / 20 )0.00289520370.006919369032083830.41842018926516
Winsorized Mean ( 16 / 20 )0.00350209170.006655109806601630.52622598300723
Winsorized Mean ( 17 / 20 )0.002711415750.006130374210459010.442292045626524
Winsorized Mean ( 18 / 20 )0.002476586850.006039599632593910.410058116540474
Winsorized Mean ( 19 / 20 )0.002863031966666670.005787877913787420.494660048002495
Winsorized Mean ( 20 / 20 )0.003168656966666670.005559203653561560.569983969671022
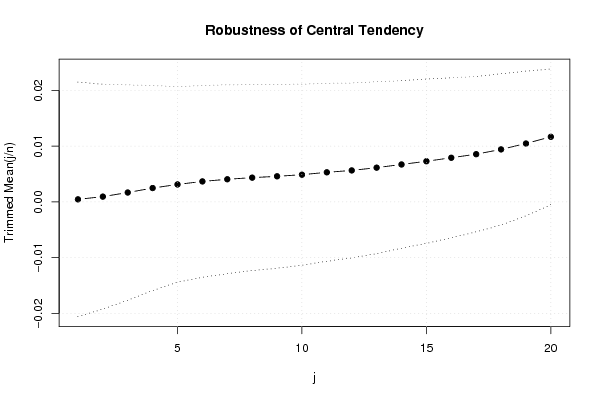
Trimmed Mean ( 1 / 20 )0.0004645838103448280.01052866740623250.0441256041642853
Trimmed Mean ( 2 / 20 )0.0009550212321428580.0100914100044030.0946370459357187
Trimmed Mean ( 3 / 20 )0.001691985629629630.009664565807068250.175071044411761
Trimmed Mean ( 4 / 20 )0.002494305307692310.00920076637083420.271097559394518
Trimmed Mean ( 5 / 20 )0.003140323040.00877570083861910.357842991431570
Trimmed Mean ( 6 / 20 )0.003685478229166670.008605878759203570.428251237588634
Trimmed Mean ( 7 / 20 )0.004070743086956520.008477009156924510.480209825375888
Trimmed Mean ( 8 / 20 )0.004363115590909090.008346363788513220.522756460353894
Trimmed Mean ( 9 / 20 )0.004601842571428570.008250365775407140.557774369852285
Trimmed Mean ( 10 / 20 )0.00489254120.00812617555436490.602071806998069
Trimmed Mean ( 11 / 20 )0.005318169921052630.007988075277403440.665763620943408
Trimmed Mean ( 12 / 20 )0.005657932416666670.007846913687199370.721039206267353
Trimmed Mean ( 13 / 20 )0.006156559352941180.007711186713817550.79839324107006
Trimmed Mean ( 14 / 20 )0.0067282953750.007520647469703280.894643101156483
Trimmed Mean ( 15 / 20 )0.00730359690.00737043206520190.990931988164242
Trimmed Mean ( 16 / 20 )0.007933367357142860.00718464182142331.10421195020286
Trimmed Mean ( 17 / 20 )0.008572493653846150.006970211124847861.22987575272812
Trimmed Mean ( 18 / 20 )0.0094344168750.00679303915688811.38883593294668
Trimmed Mean ( 19 / 20 )0.01048863354545450.006501380183067661.61329337004031
Trimmed Mean ( 20 / 20 )0.01169267590.006091722570125621.91943670536508
Median0.0204343475
Midrange-0.013472929
Midmean - Weighted Average at Xnp0.00488062483870968
Midmean - Weighted Average at X(n+1)p0.0073035969
Midmean - Empirical Distribution Function0.00488062483870968
Midmean - Empirical Distribution Function - Averaging0.0073035969
Midmean - Empirical Distribution Function - Interpolation0.0073035969
Midmean - Closest Observation0.00488062483870968
Midmean - True Basic - Statistics Graphics Toolkit0.0073035969
Midmean - MS Excel (old versions)0.006728295375
Number of observations60

\begin{tabular}{lllllllll}
\hline
Central Tendency - Ungrouped Data \tabularnewline
Measure & Value & S.E. & Value/S.E. \tabularnewline
Arithmetic Mean & 5.00000004755775e-11 & 0.0113094944508857 & 4.42106415036630e-09 \tabularnewline
Geometric Mean & NaN &  &  \tabularnewline
Harmonic Mean & 0.0819855173246095 &  &  \tabularnewline
Quadratic Mean & 0.0868698752119644 &  &  \tabularnewline
Winsorized Mean ( 1 / 20 ) & 6.84221666666744e-06 & 0.0108829977696223 & 0.000628706980512861 \tabularnewline
Winsorized Mean ( 2 / 20 ) & -0.000371514683333332 & 0.0107114438265894 & -0.0346839034352313 \tabularnewline
Winsorized Mean ( 3 / 20 ) & -0.000394045533333334 & 0.0105688157389198 & -0.0372837925333731 \tabularnewline
Winsorized Mean ( 4 / 20 ) & 0.000340912866666668 & 0.0101878545897116 & 0.0334626749591562 \tabularnewline
Winsorized Mean ( 5 / 20 ) & 0.000959702283333336 & 0.00914916569279603 & 0.104895059894805 \tabularnewline
Winsorized Mean ( 6 / 20 ) & 0.00191325988333333 & 0.0088433795057209 & 0.216349403765339 \tabularnewline
Winsorized Mean ( 7 / 20 ) & 0.00256989756666667 & 0.00868849105252003 & 0.295781805049024 \tabularnewline
Winsorized Mean ( 8 / 20 ) & 0.0030262445 & 0.00837608932226241 & 0.361295633746012 \tabularnewline
Winsorized Mean ( 9 / 20 ) & 0.0028576508 & 0.00831579445729589 & 0.343641345956168 \tabularnewline
Winsorized Mean ( 10 / 20 ) & 0.00219689263333333 & 0.00815616827213173 & 0.269353519941435 \tabularnewline
Winsorized Mean ( 11 / 20 ) & 0.00307573745 & 0.00793382728392566 & 0.387673860285767 \tabularnewline
Winsorized Mean ( 12 / 20 ) & 0.00226726925 & 0.00765037597645819 & 0.296360500056058 \tabularnewline
Winsorized Mean ( 13 / 20 ) & 0.00219252293333334 & 0.00758300667162558 & 0.289136358212292 \tabularnewline
Winsorized Mean ( 14 / 20 ) & 0.0027011847 & 0.00710783325208298 & 0.380029272522454 \tabularnewline
Winsorized Mean ( 15 / 20 ) & 0.0028952037 & 0.00691936903208383 & 0.41842018926516 \tabularnewline
Winsorized Mean ( 16 / 20 ) & 0.0035020917 & 0.00665510980660163 & 0.52622598300723 \tabularnewline
Winsorized Mean ( 17 / 20 ) & 0.00271141575 & 0.00613037421045901 & 0.442292045626524 \tabularnewline
Winsorized Mean ( 18 / 20 ) & 0.00247658685 & 0.00603959963259391 & 0.410058116540474 \tabularnewline
Winsorized Mean ( 19 / 20 ) & 0.00286303196666667 & 0.00578787791378742 & 0.494660048002495 \tabularnewline
Winsorized Mean ( 20 / 20 ) & 0.00316865696666667 & 0.00555920365356156 & 0.569983969671022 \tabularnewline
Trimmed Mean ( 1 / 20 ) & 0.000464583810344828 & 0.0105286674062325 & 0.0441256041642853 \tabularnewline
Trimmed Mean ( 2 / 20 ) & 0.000955021232142858 & 0.010091410004403 & 0.0946370459357187 \tabularnewline
Trimmed Mean ( 3 / 20 ) & 0.00169198562962963 & 0.00966456580706825 & 0.175071044411761 \tabularnewline
Trimmed Mean ( 4 / 20 ) & 0.00249430530769231 & 0.0092007663708342 & 0.271097559394518 \tabularnewline
Trimmed Mean ( 5 / 20 ) & 0.00314032304 & 0.0087757008386191 & 0.357842991431570 \tabularnewline
Trimmed Mean ( 6 / 20 ) & 0.00368547822916667 & 0.00860587875920357 & 0.428251237588634 \tabularnewline
Trimmed Mean ( 7 / 20 ) & 0.00407074308695652 & 0.00847700915692451 & 0.480209825375888 \tabularnewline
Trimmed Mean ( 8 / 20 ) & 0.00436311559090909 & 0.00834636378851322 & 0.522756460353894 \tabularnewline
Trimmed Mean ( 9 / 20 ) & 0.00460184257142857 & 0.00825036577540714 & 0.557774369852285 \tabularnewline
Trimmed Mean ( 10 / 20 ) & 0.0048925412 & 0.0081261755543649 & 0.602071806998069 \tabularnewline
Trimmed Mean ( 11 / 20 ) & 0.00531816992105263 & 0.00798807527740344 & 0.665763620943408 \tabularnewline
Trimmed Mean ( 12 / 20 ) & 0.00565793241666667 & 0.00784691368719937 & 0.721039206267353 \tabularnewline
Trimmed Mean ( 13 / 20 ) & 0.00615655935294118 & 0.00771118671381755 & 0.79839324107006 \tabularnewline
Trimmed Mean ( 14 / 20 ) & 0.006728295375 & 0.00752064746970328 & 0.894643101156483 \tabularnewline
Trimmed Mean ( 15 / 20 ) & 0.0073035969 & 0.0073704320652019 & 0.990931988164242 \tabularnewline
Trimmed Mean ( 16 / 20 ) & 0.00793336735714286 & 0.0071846418214233 & 1.10421195020286 \tabularnewline
Trimmed Mean ( 17 / 20 ) & 0.00857249365384615 & 0.00697021112484786 & 1.22987575272812 \tabularnewline
Trimmed Mean ( 18 / 20 ) & 0.009434416875 & 0.0067930391568881 & 1.38883593294668 \tabularnewline
Trimmed Mean ( 19 / 20 ) & 0.0104886335454545 & 0.00650138018306766 & 1.61329337004031 \tabularnewline
Trimmed Mean ( 20 / 20 ) & 0.0116926759 & 0.00609172257012562 & 1.91943670536508 \tabularnewline
Median & 0.0204343475 &  &  \tabularnewline
Midrange & -0.013472929 &  &  \tabularnewline
Midmean - Weighted Average at Xnp & 0.00488062483870968 &  &  \tabularnewline
Midmean - Weighted Average at X(n+1)p & 0.0073035969 &  &  \tabularnewline
Midmean - Empirical Distribution Function & 0.00488062483870968 &  &  \tabularnewline
Midmean - Empirical Distribution Function - Averaging & 0.0073035969 &  &  \tabularnewline
Midmean - Empirical Distribution Function - Interpolation & 0.0073035969 &  &  \tabularnewline
Midmean - Closest Observation & 0.00488062483870968 &  &  \tabularnewline
Midmean - True Basic - Statistics Graphics Toolkit & 0.0073035969 &  &  \tabularnewline
Midmean - MS Excel (old versions) & 0.006728295375 &  &  \tabularnewline
Number of observations & 60 &  &  \tabularnewline
\hline
\end{tabular}
%Source: https://freestatistics.org/blog/index.php?pk=50297&T=1

[TABLE]
[ROW][C]Central Tendency - Ungrouped Data[/C][/ROW]
[ROW][C]Measure[/C][C]Value[/C][C]S.E.[/C][C]Value/S.E.[/C][/ROW]
[ROW][C]Arithmetic Mean[/C][C]5.00000004755775e-11[/C][C]0.0113094944508857[/C][C]4.42106415036630e-09[/C][/ROW]
[ROW][C]Geometric Mean[/C][C]NaN[/C][C][/C][C][/C][/ROW]
[ROW][C]Harmonic Mean[/C][C]0.0819855173246095[/C][C][/C][C][/C][/ROW]
[ROW][C]Quadratic Mean[/C][C]0.0868698752119644[/C][C][/C][C][/C][/ROW]
[ROW][C]Winsorized Mean ( 1 / 20 )[/C][C]6.84221666666744e-06[/C][C]0.0108829977696223[/C][C]0.000628706980512861[/C][/ROW]
[ROW][C]Winsorized Mean ( 2 / 20 )[/C][C]-0.000371514683333332[/C][C]0.0107114438265894[/C][C]-0.0346839034352313[/C][/ROW]
[ROW][C]Winsorized Mean ( 3 / 20 )[/C][C]-0.000394045533333334[/C][C]0.0105688157389198[/C][C]-0.0372837925333731[/C][/ROW]
[ROW][C]Winsorized Mean ( 4 / 20 )[/C][C]0.000340912866666668[/C][C]0.0101878545897116[/C][C]0.0334626749591562[/C][/ROW]
[ROW][C]Winsorized Mean ( 5 / 20 )[/C][C]0.000959702283333336[/C][C]0.00914916569279603[/C][C]0.104895059894805[/C][/ROW]
[ROW][C]Winsorized Mean ( 6 / 20 )[/C][C]0.00191325988333333[/C][C]0.0088433795057209[/C][C]0.216349403765339[/C][/ROW]
[ROW][C]Winsorized Mean ( 7 / 20 )[/C][C]0.00256989756666667[/C][C]0.00868849105252003[/C][C]0.295781805049024[/C][/ROW]
[ROW][C]Winsorized Mean ( 8 / 20 )[/C][C]0.0030262445[/C][C]0.00837608932226241[/C][C]0.361295633746012[/C][/ROW]
[ROW][C]Winsorized Mean ( 9 / 20 )[/C][C]0.0028576508[/C][C]0.00831579445729589[/C][C]0.343641345956168[/C][/ROW]
[ROW][C]Winsorized Mean ( 10 / 20 )[/C][C]0.00219689263333333[/C][C]0.00815616827213173[/C][C]0.269353519941435[/C][/ROW]
[ROW][C]Winsorized Mean ( 11 / 20 )[/C][C]0.00307573745[/C][C]0.00793382728392566[/C][C]0.387673860285767[/C][/ROW]
[ROW][C]Winsorized Mean ( 12 / 20 )[/C][C]0.00226726925[/C][C]0.00765037597645819[/C][C]0.296360500056058[/C][/ROW]
[ROW][C]Winsorized Mean ( 13 / 20 )[/C][C]0.00219252293333334[/C][C]0.00758300667162558[/C][C]0.289136358212292[/C][/ROW]
[ROW][C]Winsorized Mean ( 14 / 20 )[/C][C]0.0027011847[/C][C]0.00710783325208298[/C][C]0.380029272522454[/C][/ROW]
[ROW][C]Winsorized Mean ( 15 / 20 )[/C][C]0.0028952037[/C][C]0.00691936903208383[/C][C]0.41842018926516[/C][/ROW]
[ROW][C]Winsorized Mean ( 16 / 20 )[/C][C]0.0035020917[/C][C]0.00665510980660163[/C][C]0.52622598300723[/C][/ROW]
[ROW][C]Winsorized Mean ( 17 / 20 )[/C][C]0.00271141575[/C][C]0.00613037421045901[/C][C]0.442292045626524[/C][/ROW]
[ROW][C]Winsorized Mean ( 18 / 20 )[/C][C]0.00247658685[/C][C]0.00603959963259391[/C][C]0.410058116540474[/C][/ROW]
[ROW][C]Winsorized Mean ( 19 / 20 )[/C][C]0.00286303196666667[/C][C]0.00578787791378742[/C][C]0.494660048002495[/C][/ROW]
[ROW][C]Winsorized Mean ( 20 / 20 )[/C][C]0.00316865696666667[/C][C]0.00555920365356156[/C][C]0.569983969671022[/C][/ROW]
[ROW][C]Trimmed Mean ( 1 / 20 )[/C][C]0.000464583810344828[/C][C]0.0105286674062325[/C][C]0.0441256041642853[/C][/ROW]
[ROW][C]Trimmed Mean ( 2 / 20 )[/C][C]0.000955021232142858[/C][C]0.010091410004403[/C][C]0.0946370459357187[/C][/ROW]
[ROW][C]Trimmed Mean ( 3 / 20 )[/C][C]0.00169198562962963[/C][C]0.00966456580706825[/C][C]0.175071044411761[/C][/ROW]
[ROW][C]Trimmed Mean ( 4 / 20 )[/C][C]0.00249430530769231[/C][C]0.0092007663708342[/C][C]0.271097559394518[/C][/ROW]
[ROW][C]Trimmed Mean ( 5 / 20 )[/C][C]0.00314032304[/C][C]0.0087757008386191[/C][C]0.357842991431570[/C][/ROW]
[ROW][C]Trimmed Mean ( 6 / 20 )[/C][C]0.00368547822916667[/C][C]0.00860587875920357[/C][C]0.428251237588634[/C][/ROW]
[ROW][C]Trimmed Mean ( 7 / 20 )[/C][C]0.00407074308695652[/C][C]0.00847700915692451[/C][C]0.480209825375888[/C][/ROW]
[ROW][C]Trimmed Mean ( 8 / 20 )[/C][C]0.00436311559090909[/C][C]0.00834636378851322[/C][C]0.522756460353894[/C][/ROW]
[ROW][C]Trimmed Mean ( 9 / 20 )[/C][C]0.00460184257142857[/C][C]0.00825036577540714[/C][C]0.557774369852285[/C][/ROW]
[ROW][C]Trimmed Mean ( 10 / 20 )[/C][C]0.0048925412[/C][C]0.0081261755543649[/C][C]0.602071806998069[/C][/ROW]
[ROW][C]Trimmed Mean ( 11 / 20 )[/C][C]0.00531816992105263[/C][C]0.00798807527740344[/C][C]0.665763620943408[/C][/ROW]
[ROW][C]Trimmed Mean ( 12 / 20 )[/C][C]0.00565793241666667[/C][C]0.00784691368719937[/C][C]0.721039206267353[/C][/ROW]
[ROW][C]Trimmed Mean ( 13 / 20 )[/C][C]0.00615655935294118[/C][C]0.00771118671381755[/C][C]0.79839324107006[/C][/ROW]
[ROW][C]Trimmed Mean ( 14 / 20 )[/C][C]0.006728295375[/C][C]0.00752064746970328[/C][C]0.894643101156483[/C][/ROW]
[ROW][C]Trimmed Mean ( 15 / 20 )[/C][C]0.0073035969[/C][C]0.0073704320652019[/C][C]0.990931988164242[/C][/ROW]
[ROW][C]Trimmed Mean ( 16 / 20 )[/C][C]0.00793336735714286[/C][C]0.0071846418214233[/C][C]1.10421195020286[/C][/ROW]
[ROW][C]Trimmed Mean ( 17 / 20 )[/C][C]0.00857249365384615[/C][C]0.00697021112484786[/C][C]1.22987575272812[/C][/ROW]
[ROW][C]Trimmed Mean ( 18 / 20 )[/C][C]0.009434416875[/C][C]0.0067930391568881[/C][C]1.38883593294668[/C][/ROW]
[ROW][C]Trimmed Mean ( 19 / 20 )[/C][C]0.0104886335454545[/C][C]0.00650138018306766[/C][C]1.61329337004031[/C][/ROW]
[ROW][C]Trimmed Mean ( 20 / 20 )[/C][C]0.0116926759[/C][C]0.00609172257012562[/C][C]1.91943670536508[/C][/ROW]
[ROW][C]Median[/C][C]0.0204343475[/C][C][/C][C][/C][/ROW]
[ROW][C]Midrange[/C][C]-0.013472929[/C][C][/C][C][/C][/ROW]
[ROW][C]Midmean - Weighted Average at Xnp[/C][C]0.00488062483870968[/C][C][/C][C][/C][/ROW]
[ROW][C]Midmean - Weighted Average at X(n+1)p[/C][C]0.0073035969[/C][C][/C][C][/C][/ROW]
[ROW][C]Midmean - Empirical Distribution Function[/C][C]0.00488062483870968[/C][C][/C][C][/C][/ROW]
[ROW][C]Midmean - Empirical Distribution Function - Averaging[/C][C]0.0073035969[/C][C][/C][C][/C][/ROW]
[ROW][C]Midmean - Empirical Distribution Function - Interpolation[/C][C]0.0073035969[/C][C][/C][C][/C][/ROW]
[ROW][C]Midmean - Closest Observation[/C][C]0.00488062483870968[/C][C][/C][C][/C][/ROW]
[ROW][C]Midmean - True Basic - Statistics Graphics Toolkit[/C][C]0.0073035969[/C][C][/C][C][/C][/ROW]
[ROW][C]Midmean - MS Excel (old versions)[/C][C]0.006728295375[/C][C][/C][C][/C][/ROW]
[ROW][C]Number of observations[/C][C]60[/C][C][/C][C][/C][/ROW]
[/TABLE]
Source: https://freestatistics.org/blog/index.php?pk=50297&T=1

Globally Unique Identifier (entire table): ba.freestatistics.org/blog/index.php?pk=50297&T=1

As an alternative you can also use a QR Code:  

The GUIDs for individual cells are displayed in the table below:

Central Tendency - Ungrouped Data
MeasureValueS.E.Value/S.E.
Arithmetic Mean5.00000004755775e-110.01130949445088574.42106415036630e-09
Geometric MeanNaN
Harmonic Mean0.0819855173246095
Quadratic Mean0.0868698752119644
Winsorized Mean ( 1 / 20 )6.84221666666744e-060.01088299776962230.000628706980512861
Winsorized Mean ( 2 / 20 )-0.0003715146833333320.0107114438265894-0.0346839034352313
Winsorized Mean ( 3 / 20 )-0.0003940455333333340.0105688157389198-0.0372837925333731
Winsorized Mean ( 4 / 20 )0.0003409128666666680.01018785458971160.0334626749591562
Winsorized Mean ( 5 / 20 )0.0009597022833333360.009149165692796030.104895059894805
Winsorized Mean ( 6 / 20 )0.001913259883333330.00884337950572090.216349403765339
Winsorized Mean ( 7 / 20 )0.002569897566666670.008688491052520030.295781805049024
Winsorized Mean ( 8 / 20 )0.00302624450.008376089322262410.361295633746012
Winsorized Mean ( 9 / 20 )0.00285765080.008315794457295890.343641345956168
Winsorized Mean ( 10 / 20 )0.002196892633333330.008156168272131730.269353519941435
Winsorized Mean ( 11 / 20 )0.003075737450.007933827283925660.387673860285767
Winsorized Mean ( 12 / 20 )0.002267269250.007650375976458190.296360500056058
Winsorized Mean ( 13 / 20 )0.002192522933333340.007583006671625580.289136358212292
Winsorized Mean ( 14 / 20 )0.00270118470.007107833252082980.380029272522454
Winsorized Mean ( 15 / 20 )0.00289520370.006919369032083830.41842018926516
Winsorized Mean ( 16 / 20 )0.00350209170.006655109806601630.52622598300723
Winsorized Mean ( 17 / 20 )0.002711415750.006130374210459010.442292045626524
Winsorized Mean ( 18 / 20 )0.002476586850.006039599632593910.410058116540474
Winsorized Mean ( 19 / 20 )0.002863031966666670.005787877913787420.494660048002495
Winsorized Mean ( 20 / 20 )0.003168656966666670.005559203653561560.569983969671022
Trimmed Mean ( 1 / 20 )0.0004645838103448280.01052866740623250.0441256041642853
Trimmed Mean ( 2 / 20 )0.0009550212321428580.0100914100044030.0946370459357187
Trimmed Mean ( 3 / 20 )0.001691985629629630.009664565807068250.175071044411761
Trimmed Mean ( 4 / 20 )0.002494305307692310.00920076637083420.271097559394518
Trimmed Mean ( 5 / 20 )0.003140323040.00877570083861910.357842991431570
Trimmed Mean ( 6 / 20 )0.003685478229166670.008605878759203570.428251237588634
Trimmed Mean ( 7 / 20 )0.004070743086956520.008477009156924510.480209825375888
Trimmed Mean ( 8 / 20 )0.004363115590909090.008346363788513220.522756460353894
Trimmed Mean ( 9 / 20 )0.004601842571428570.008250365775407140.557774369852285
Trimmed Mean ( 10 / 20 )0.00489254120.00812617555436490.602071806998069
Trimmed Mean ( 11 / 20 )0.005318169921052630.007988075277403440.665763620943408
Trimmed Mean ( 12 / 20 )0.005657932416666670.007846913687199370.721039206267353
Trimmed Mean ( 13 / 20 )0.006156559352941180.007711186713817550.79839324107006
Trimmed Mean ( 14 / 20 )0.0067282953750.007520647469703280.894643101156483
Trimmed Mean ( 15 / 20 )0.00730359690.00737043206520190.990931988164242
Trimmed Mean ( 16 / 20 )0.007933367357142860.00718464182142331.10421195020286
Trimmed Mean ( 17 / 20 )0.008572493653846150.006970211124847861.22987575272812
Trimmed Mean ( 18 / 20 )0.0094344168750.00679303915688811.38883593294668
Trimmed Mean ( 19 / 20 )0.01048863354545450.006501380183067661.61329337004031
Trimmed Mean ( 20 / 20 )0.01169267590.006091722570125621.91943670536508
Median0.0204343475
Midrange-0.013472929
Midmean - Weighted Average at Xnp0.00488062483870968
Midmean - Weighted Average at X(n+1)p0.0073035969
Midmean - Empirical Distribution Function0.00488062483870968
Midmean - Empirical Distribution Function - Averaging0.0073035969
Midmean - Empirical Distribution Function - Interpolation0.0073035969
Midmean - Closest Observation0.00488062483870968
Midmean - True Basic - Statistics Graphics Toolkit0.0073035969
Midmean - MS Excel (old versions)0.006728295375
Number of observations60


Variability - Ungrouped Data
Absolute range0.414553916
Relative range (unbiased)4.7321903430951
Relative range (biased)4.7721251468185
Variance (unbiased)0.00767427988407688
Variance (biased)0.00754637521934227
Standard Deviation (unbiased)0.0876029673246111
Standard Deviation (biased)0.0868698752119644
Coefficient of Variation (unbiased)1752059329.82742
Coefficient of Variation (biased)1737397487.71395
Mean Squared Error (MSE versus 0)0.00754637521934227
Mean Squared Error (MSE versus Mean)0.00754637521934227
Mean Absolute Deviation from Mean (MAD Mean)0.0722488771416667
Mean Absolute Deviation from Median (MAD Median)0.07029712265
Median Absolute Deviation from Mean0.0645217285
Median Absolute Deviation from Median0.065686392
Mean Squared Deviation from Mean0.00754637521934227
Mean Squared Deviation from Median0.00796393777504959
Interquartile Difference (Weighted Average at Xnp)0.129819533
Interquartile Difference (Weighted Average at X(n+1)p)0.130623057
Interquartile Difference (Empirical Distribution Function)0.129819533
Interquartile Difference (Empirical Distribution Function - Averaging)0.129431495
Interquartile Difference (Empirical Distribution Function - Interpolation)0.128239933
Interquartile Difference (Closest Observation)0.129819533
Interquartile Difference (True Basic - Statistics Graphics Toolkit)0.128239933
Interquartile Difference (MS Excel (old versions))0.131814619
Semi Interquartile Difference (Weighted Average at Xnp)0.0649097665
Semi Interquartile Difference (Weighted Average at X(n+1)p)0.0653115285
Semi Interquartile Difference (Empirical Distribution Function)0.0649097665
Semi Interquartile Difference (Empirical Distribution Function - Averaging)0.0647157475
Semi Interquartile Difference (Empirical Distribution Function - Interpolation)0.0641199665
Semi Interquartile Difference (Closest Observation)0.0649097665
Semi Interquartile Difference (True Basic - Statistics Graphics Toolkit)0.0641199665
Semi Interquartile Difference (MS Excel (old versions))0.0659073095
Coefficient of Quartile Variation (Weighted Average at Xnp)-22.3921716120679
Coefficient of Quartile Variation (Weighted Average at X(n+1)p)-36.1993553439772
Coefficient of Quartile Variation (Empirical Distribution Function)-22.3921716120679
Coefficient of Quartile Variation (Empirical Distribution Function - Averaging)-37.9073484580237
Coefficient of Quartile Variation (Empirical Distribution Function - Interpolation)-39.8211441567162
Coefficient of Quartile Variation (Closest Observation)-22.3921716120679
Coefficient of Quartile Variation (True Basic - Statistics Graphics Toolkit)-39.8211441567162
Coefficient of Quartile Variation (MS Excel (old versions))-34.6656617895544
Number of all Pairs of Observations1770
Squared Differences between all Pairs of Observations0.0153485597681537
Mean Absolute Differences between all Pairs of Observations0.0994008712661017
Gini Mean Difference0.0994008712661018
Leik Measure of Dispersion-994008702.413015
Index of Diversity-50309167192821240
Index of Qualitative Variation-51161864941852104
Coefficient of Dispersion3.53565863268532
Observations60

\begin{tabular}{lllllllll}
\hline
Variability - Ungrouped Data \tabularnewline
Absolute range & 0.414553916 \tabularnewline
Relative range (unbiased) & 4.7321903430951 \tabularnewline
Relative range (biased) & 4.7721251468185 \tabularnewline
Variance (unbiased) & 0.00767427988407688 \tabularnewline
Variance (biased) & 0.00754637521934227 \tabularnewline
Standard Deviation (unbiased) & 0.0876029673246111 \tabularnewline
Standard Deviation (biased) & 0.0868698752119644 \tabularnewline
Coefficient of Variation (unbiased) & 1752059329.82742 \tabularnewline
Coefficient of Variation (biased) & 1737397487.71395 \tabularnewline
Mean Squared Error (MSE versus 0) & 0.00754637521934227 \tabularnewline
Mean Squared Error (MSE versus Mean) & 0.00754637521934227 \tabularnewline
Mean Absolute Deviation from Mean (MAD Mean) & 0.0722488771416667 \tabularnewline
Mean Absolute Deviation from Median (MAD Median) & 0.07029712265 \tabularnewline
Median Absolute Deviation from Mean & 0.0645217285 \tabularnewline
Median Absolute Deviation from Median & 0.065686392 \tabularnewline
Mean Squared Deviation from Mean & 0.00754637521934227 \tabularnewline
Mean Squared Deviation from Median & 0.00796393777504959 \tabularnewline
Interquartile Difference (Weighted Average at Xnp) & 0.129819533 \tabularnewline
Interquartile Difference (Weighted Average at X(n+1)p) & 0.130623057 \tabularnewline
Interquartile Difference (Empirical Distribution Function) & 0.129819533 \tabularnewline
Interquartile Difference (Empirical Distribution Function - Averaging) & 0.129431495 \tabularnewline
Interquartile Difference (Empirical Distribution Function - Interpolation) & 0.128239933 \tabularnewline
Interquartile Difference (Closest Observation) & 0.129819533 \tabularnewline
Interquartile Difference (True Basic - Statistics Graphics Toolkit) & 0.128239933 \tabularnewline
Interquartile Difference (MS Excel (old versions)) & 0.131814619 \tabularnewline
Semi Interquartile Difference (Weighted Average at Xnp) & 0.0649097665 \tabularnewline
Semi Interquartile Difference (Weighted Average at X(n+1)p) & 0.0653115285 \tabularnewline
Semi Interquartile Difference (Empirical Distribution Function) & 0.0649097665 \tabularnewline
Semi Interquartile Difference (Empirical Distribution Function - Averaging) & 0.0647157475 \tabularnewline
Semi Interquartile Difference (Empirical Distribution Function - Interpolation) & 0.0641199665 \tabularnewline
Semi Interquartile Difference (Closest Observation) & 0.0649097665 \tabularnewline
Semi Interquartile Difference (True Basic - Statistics Graphics Toolkit) & 0.0641199665 \tabularnewline
Semi Interquartile Difference (MS Excel (old versions)) & 0.0659073095 \tabularnewline
Coefficient of Quartile Variation (Weighted Average at Xnp) & -22.3921716120679 \tabularnewline
Coefficient of Quartile Variation (Weighted Average at X(n+1)p) & -36.1993553439772 \tabularnewline
Coefficient of Quartile Variation (Empirical Distribution Function) & -22.3921716120679 \tabularnewline
Coefficient of Quartile Variation (Empirical Distribution Function - Averaging) & -37.9073484580237 \tabularnewline
Coefficient of Quartile Variation (Empirical Distribution Function - Interpolation) & -39.8211441567162 \tabularnewline
Coefficient of Quartile Variation (Closest Observation) & -22.3921716120679 \tabularnewline
Coefficient of Quartile Variation (True Basic - Statistics Graphics Toolkit) & -39.8211441567162 \tabularnewline
Coefficient of Quartile Variation (MS Excel (old versions)) & -34.6656617895544 \tabularnewline
Number of all Pairs of Observations & 1770 \tabularnewline
Squared Differences between all Pairs of Observations & 0.0153485597681537 \tabularnewline
Mean Absolute Differences between all Pairs of Observations & 0.0994008712661017 \tabularnewline
Gini Mean Difference & 0.0994008712661018 \tabularnewline
Leik Measure of Dispersion & -994008702.413015 \tabularnewline
Index of Diversity & -50309167192821240 \tabularnewline
Index of Qualitative Variation & -51161864941852104 \tabularnewline
Coefficient of Dispersion & 3.53565863268532 \tabularnewline
Observations & 60 \tabularnewline
\hline
\end{tabular}
%Source: https://freestatistics.org/blog/index.php?pk=50297&T=2

[TABLE]
[ROW][C]Variability - Ungrouped Data[/C][/ROW]
[ROW][C]Absolute range[/C][C]0.414553916[/C][/ROW]
[ROW][C]Relative range (unbiased)[/C][C]4.7321903430951[/C][/ROW]
[ROW][C]Relative range (biased)[/C][C]4.7721251468185[/C][/ROW]
[ROW][C]Variance (unbiased)[/C][C]0.00767427988407688[/C][/ROW]
[ROW][C]Variance (biased)[/C][C]0.00754637521934227[/C][/ROW]
[ROW][C]Standard Deviation (unbiased)[/C][C]0.0876029673246111[/C][/ROW]
[ROW][C]Standard Deviation (biased)[/C][C]0.0868698752119644[/C][/ROW]
[ROW][C]Coefficient of Variation (unbiased)[/C][C]1752059329.82742[/C][/ROW]
[ROW][C]Coefficient of Variation (biased)[/C][C]1737397487.71395[/C][/ROW]
[ROW][C]Mean Squared Error (MSE versus 0)[/C][C]0.00754637521934227[/C][/ROW]
[ROW][C]Mean Squared Error (MSE versus Mean)[/C][C]0.00754637521934227[/C][/ROW]
[ROW][C]Mean Absolute Deviation from Mean (MAD Mean)[/C][C]0.0722488771416667[/C][/ROW]
[ROW][C]Mean Absolute Deviation from Median (MAD Median)[/C][C]0.07029712265[/C][/ROW]
[ROW][C]Median Absolute Deviation from Mean[/C][C]0.0645217285[/C][/ROW]
[ROW][C]Median Absolute Deviation from Median[/C][C]0.065686392[/C][/ROW]
[ROW][C]Mean Squared Deviation from Mean[/C][C]0.00754637521934227[/C][/ROW]
[ROW][C]Mean Squared Deviation from Median[/C][C]0.00796393777504959[/C][/ROW]
[ROW][C]Interquartile Difference (Weighted Average at Xnp)[/C][C]0.129819533[/C][/ROW]
[ROW][C]Interquartile Difference (Weighted Average at X(n+1)p)[/C][C]0.130623057[/C][/ROW]
[ROW][C]Interquartile Difference (Empirical Distribution Function)[/C][C]0.129819533[/C][/ROW]
[ROW][C]Interquartile Difference (Empirical Distribution Function - Averaging)[/C][C]0.129431495[/C][/ROW]
[ROW][C]Interquartile Difference (Empirical Distribution Function - Interpolation)[/C][C]0.128239933[/C][/ROW]
[ROW][C]Interquartile Difference (Closest Observation)[/C][C]0.129819533[/C][/ROW]
[ROW][C]Interquartile Difference (True Basic - Statistics Graphics Toolkit)[/C][C]0.128239933[/C][/ROW]
[ROW][C]Interquartile Difference (MS Excel (old versions))[/C][C]0.131814619[/C][/ROW]
[ROW][C]Semi Interquartile Difference (Weighted Average at Xnp)[/C][C]0.0649097665[/C][/ROW]
[ROW][C]Semi Interquartile Difference (Weighted Average at X(n+1)p)[/C][C]0.0653115285[/C][/ROW]
[ROW][C]Semi Interquartile Difference (Empirical Distribution Function)[/C][C]0.0649097665[/C][/ROW]
[ROW][C]Semi Interquartile Difference (Empirical Distribution Function - Averaging)[/C][C]0.0647157475[/C][/ROW]
[ROW][C]Semi Interquartile Difference (Empirical Distribution Function - Interpolation)[/C][C]0.0641199665[/C][/ROW]
[ROW][C]Semi Interquartile Difference (Closest Observation)[/C][C]0.0649097665[/C][/ROW]
[ROW][C]Semi Interquartile Difference (True Basic - Statistics Graphics Toolkit)[/C][C]0.0641199665[/C][/ROW]
[ROW][C]Semi Interquartile Difference (MS Excel (old versions))[/C][C]0.0659073095[/C][/ROW]
[ROW][C]Coefficient of Quartile Variation (Weighted Average at Xnp)[/C][C]-22.3921716120679[/C][/ROW]
[ROW][C]Coefficient of Quartile Variation (Weighted Average at X(n+1)p)[/C][C]-36.1993553439772[/C][/ROW]
[ROW][C]Coefficient of Quartile Variation (Empirical Distribution Function)[/C][C]-22.3921716120679[/C][/ROW]
[ROW][C]Coefficient of Quartile Variation (Empirical Distribution Function - Averaging)[/C][C]-37.9073484580237[/C][/ROW]
[ROW][C]Coefficient of Quartile Variation (Empirical Distribution Function - Interpolation)[/C][C]-39.8211441567162[/C][/ROW]
[ROW][C]Coefficient of Quartile Variation (Closest Observation)[/C][C]-22.3921716120679[/C][/ROW]
[ROW][C]Coefficient of Quartile Variation (True Basic - Statistics Graphics Toolkit)[/C][C]-39.8211441567162[/C][/ROW]
[ROW][C]Coefficient of Quartile Variation (MS Excel (old versions))[/C][C]-34.6656617895544[/C][/ROW]
[ROW][C]Number of all Pairs of Observations[/C][C]1770[/C][/ROW]
[ROW][C]Squared Differences between all Pairs of Observations[/C][C]0.0153485597681537[/C][/ROW]
[ROW][C]Mean Absolute Differences between all Pairs of Observations[/C][C]0.0994008712661017[/C][/ROW]
[ROW][C]Gini Mean Difference[/C][C]0.0994008712661018[/C][/ROW]
[ROW][C]Leik Measure of Dispersion[/C][C]-994008702.413015[/C][/ROW]
[ROW][C]Index of Diversity[/C][C]-50309167192821240[/C][/ROW]
[ROW][C]Index of Qualitative Variation[/C][C]-51161864941852104[/C][/ROW]
[ROW][C]Coefficient of Dispersion[/C][C]3.53565863268532[/C][/ROW]
[ROW][C]Observations[/C][C]60[/C][/ROW]
[/TABLE]
Source: https://freestatistics.org/blog/index.php?pk=50297&T=2

Globally Unique Identifier (entire table): ba.freestatistics.org/blog/index.php?pk=50297&T=2

As an alternative you can also use a QR Code:  

The GUIDs for individual cells are displayed in the table below:

Variability - Ungrouped Data
Absolute range0.414553916
Relative range (unbiased)4.7321903430951
Relative range (biased)4.7721251468185
Variance (unbiased)0.00767427988407688
Variance (biased)0.00754637521934227
Standard Deviation (unbiased)0.0876029673246111
Standard Deviation (biased)0.0868698752119644
Coefficient of Variation (unbiased)1752059329.82742
Coefficient of Variation (biased)1737397487.71395
Mean Squared Error (MSE versus 0)0.00754637521934227
Mean Squared Error (MSE versus Mean)0.00754637521934227
Mean Absolute Deviation from Mean (MAD Mean)0.0722488771416667
Mean Absolute Deviation from Median (MAD Median)0.07029712265
Median Absolute Deviation from Mean0.0645217285
Median Absolute Deviation from Median0.065686392
Mean Squared Deviation from Mean0.00754637521934227
Mean Squared Deviation from Median0.00796393777504959
Interquartile Difference (Weighted Average at Xnp)0.129819533
Interquartile Difference (Weighted Average at X(n+1)p)0.130623057
Interquartile Difference (Empirical Distribution Function)0.129819533
Interquartile Difference (Empirical Distribution Function - Averaging)0.129431495
Interquartile Difference (Empirical Distribution Function - Interpolation)0.128239933
Interquartile Difference (Closest Observation)0.129819533
Interquartile Difference (True Basic - Statistics Graphics Toolkit)0.128239933
Interquartile Difference (MS Excel (old versions))0.131814619
Semi Interquartile Difference (Weighted Average at Xnp)0.0649097665
Semi Interquartile Difference (Weighted Average at X(n+1)p)0.0653115285
Semi Interquartile Difference (Empirical Distribution Function)0.0649097665
Semi Interquartile Difference (Empirical Distribution Function - Averaging)0.0647157475
Semi Interquartile Difference (Empirical Distribution Function - Interpolation)0.0641199665
Semi Interquartile Difference (Closest Observation)0.0649097665
Semi Interquartile Difference (True Basic - Statistics Graphics Toolkit)0.0641199665
Semi Interquartile Difference (MS Excel (old versions))0.0659073095
Coefficient of Quartile Variation (Weighted Average at Xnp)-22.3921716120679
Coefficient of Quartile Variation (Weighted Average at X(n+1)p)-36.1993553439772
Coefficient of Quartile Variation (Empirical Distribution Function)-22.3921716120679
Coefficient of Quartile Variation (Empirical Distribution Function - Averaging)-37.9073484580237
Coefficient of Quartile Variation (Empirical Distribution Function - Interpolation)-39.8211441567162
Coefficient of Quartile Variation (Closest Observation)-22.3921716120679
Coefficient of Quartile Variation (True Basic - Statistics Graphics Toolkit)-39.8211441567162
Coefficient of Quartile Variation (MS Excel (old versions))-34.6656617895544
Number of all Pairs of Observations1770
Squared Differences between all Pairs of Observations0.0153485597681537
Mean Absolute Differences between all Pairs of Observations0.0994008712661017
Gini Mean Difference0.0994008712661018
Leik Measure of Dispersion-994008702.413015
Index of Diversity-50309167192821240
Index of Qualitative Variation-51161864941852104
Coefficient of Dispersion3.53565863268532
Observations60


Percentiles - Ungrouped Data
pWeighted Average at XnpWeighted Average at X(n+1)pEmpirical Distribution FunctionEmpirical Distribution Function - AveragingEmpirical Distribution Function - InterpolationClosest ObservationTrue Basic - Statistics Graphics ToolkitMS Excel (old versions)
0.02-0.211636-0.210725-0.175182-0.175182-0.174212-0.22075-0.185207-0.22075
0.04-0.173028-0.172812-0.169797-0.169797-0.167687-0.175182-0.172166-0.175182
0.06-0.16628-0.165929-0.163936-0.163936-0.154504-0.163936-0.167804-0.163936
0.08-0.149962-0.148565-0.146469-0.146469-0.122374-0.146469-0.16184-0.146469
0.1-0.113004-0.111753-0.113004-0.106746-0.101739-0.113004-0.101739-0.113004
0.12-0.099227-0.09847-0.094184-0.094184-0.093521-0.100487-0.096201-0.100487
0.14-0.090869-0.089708-0.085895-0.085895-0.085731-0.094184-0.090371-0.085895
0.16-0.085515-0.085414-0.085262-0.085262-0.084845-0.085262-0.085743-0.085262
0.18-0.084503-0.084332-0.084313-0.084313-0.080666-0.084313-0.085243-0.084313
0.2-0.07843-0.077946-0.07843-0.077221-0.076495-0.07843-0.076495-0.07843
0.22-0.075851-0.075675-0.075211-0.075211-0.075227-0.076011-0.075547-0.076011
0.24-0.07225-0.070473-0.067809-0.067809-0.067365-0.075211-0.072546-0.067809
0.26-0.066146-0.065425-0.065037-0.065037-0.063588-0.065037-0.067421-0.065037
0.28-0.061626-0.060389-0.060773-0.060773-0.058276-0.060773-0.056356-0.060773
0.3-0.055971-0.055775-0.055971-0.055645-0.055514-0.055971-0.055514-0.055971
0.32-0.054671-0.053637-0.052086-0.052086-0.052474-0.055318-0.053766-0.052086
0.34-0.050989-0.050056-0.049343-0.049343-0.049189-0.052086-0.051373-0.049343
0.36-0.047804-0.046881-0.046778-0.046778-0.04035-0.046778-0.049241-0.046778
0.38-0.025352-0.018728-0.019995-0.019995-0.017038-0.019995-0.014222-0.019995
0.4-0.012955-0.012761-0.012955-0.012712-0.012663-0.012955-0.012663-0.012955
0.42-0.009183-0.0022840.0039590.0039590.000345-0.012469-0.0062260.003959
0.440.00450.0050950.0053120.0053120.0052580.0039590.0041750.005312
0.460.0108910.0146470.0146110.0146110.0146940.0146110.015170.014611
0.480.0150870.0163980.0152060.0152060.0165690.0152060.0182730.015206
0.50.0194650.0204340.0194650.0204340.0204340.0194650.0204340.020434
0.520.0214030.0214030.0214030.0214030.0214030.0214030.0214030.021403
0.540.0240110.0275320.0279230.0279230.0270110.0214030.0217950.027923
0.560.0283220.0285960.0285880.0285880.028590.0285880.0286260.028588
0.580.0286240.0291710.0286330.0286330.0289440.0286330.029510.028633
0.60.0300480.0335720.0300480.0329840.0323970.0300480.0323970.035921
0.620.0361030.0366660.0368290.0368290.0364480.0359210.0360840.036829
0.640.0376710.0392640.0389350.0389350.038430.0368290.0468280.038935
0.660.0438680.0476310.0471560.0471560.0466630.0471560.0485080.047156
0.680.0486170.0499480.0489820.0489820.0492240.0489820.0500280.048982
0.70.0509940.0519990.0509940.0517120.0514250.0509940.0514250.05243
0.720.0539490.0594150.0600230.0600230.0560750.052430.0530380.060023
0.740.0608180.062290.0620110.0620110.0613350.0600230.0637270.062011
0.760.0632080.0658860.0640060.0640060.0636870.0640060.0673480.064006
0.780.0681840.0698930.0692280.0692280.0692510.0692280.069710.070374
0.80.0703740.0755430.0703740.0736050.0716660.0703740.0716660.076835
0.820.0770530.0780230.0779250.0779250.0772490.0768350.082740.077925
0.840.079890.083260.0828380.0828380.0806760.0779250.0841730.082838
0.860.0838920.0868340.0845950.0845950.0841380.0845950.0872230.084595
0.880.0884880.089920.0894620.0894620.0890720.0894620.0896770.090136
0.90.0901360.0928190.0901360.0916270.0904340.0901360.0904340.093117
0.920.0983250.119930.1191570.1191570.1004080.0931170.1248260.119157
0.940.1217340.1277450.1255990.1255990.122120.1191570.1297650.125599
0.960.1293860.1412830.1319110.1319110.1296390.1319110.1392740.148646
0.980.1452990.1838690.1486460.1486460.1456340.1486460.1585810.193804

\begin{tabular}{lllllllll}
\hline
Percentiles - Ungrouped Data \tabularnewline
p & Weighted Average at Xnp & Weighted Average at X(n+1)p & Empirical Distribution Function & Empirical Distribution Function - Averaging & Empirical Distribution Function - Interpolation & Closest Observation & True Basic - Statistics Graphics Toolkit & MS Excel (old versions) \tabularnewline
0.02 & -0.211636 & -0.210725 & -0.175182 & -0.175182 & -0.174212 & -0.22075 & -0.185207 & -0.22075 \tabularnewline
0.04 & -0.173028 & -0.172812 & -0.169797 & -0.169797 & -0.167687 & -0.175182 & -0.172166 & -0.175182 \tabularnewline
0.06 & -0.16628 & -0.165929 & -0.163936 & -0.163936 & -0.154504 & -0.163936 & -0.167804 & -0.163936 \tabularnewline
0.08 & -0.149962 & -0.148565 & -0.146469 & -0.146469 & -0.122374 & -0.146469 & -0.16184 & -0.146469 \tabularnewline
0.1 & -0.113004 & -0.111753 & -0.113004 & -0.106746 & -0.101739 & -0.113004 & -0.101739 & -0.113004 \tabularnewline
0.12 & -0.099227 & -0.09847 & -0.094184 & -0.094184 & -0.093521 & -0.100487 & -0.096201 & -0.100487 \tabularnewline
0.14 & -0.090869 & -0.089708 & -0.085895 & -0.085895 & -0.085731 & -0.094184 & -0.090371 & -0.085895 \tabularnewline
0.16 & -0.085515 & -0.085414 & -0.085262 & -0.085262 & -0.084845 & -0.085262 & -0.085743 & -0.085262 \tabularnewline
0.18 & -0.084503 & -0.084332 & -0.084313 & -0.084313 & -0.080666 & -0.084313 & -0.085243 & -0.084313 \tabularnewline
0.2 & -0.07843 & -0.077946 & -0.07843 & -0.077221 & -0.076495 & -0.07843 & -0.076495 & -0.07843 \tabularnewline
0.22 & -0.075851 & -0.075675 & -0.075211 & -0.075211 & -0.075227 & -0.076011 & -0.075547 & -0.076011 \tabularnewline
0.24 & -0.07225 & -0.070473 & -0.067809 & -0.067809 & -0.067365 & -0.075211 & -0.072546 & -0.067809 \tabularnewline
0.26 & -0.066146 & -0.065425 & -0.065037 & -0.065037 & -0.063588 & -0.065037 & -0.067421 & -0.065037 \tabularnewline
0.28 & -0.061626 & -0.060389 & -0.060773 & -0.060773 & -0.058276 & -0.060773 & -0.056356 & -0.060773 \tabularnewline
0.3 & -0.055971 & -0.055775 & -0.055971 & -0.055645 & -0.055514 & -0.055971 & -0.055514 & -0.055971 \tabularnewline
0.32 & -0.054671 & -0.053637 & -0.052086 & -0.052086 & -0.052474 & -0.055318 & -0.053766 & -0.052086 \tabularnewline
0.34 & -0.050989 & -0.050056 & -0.049343 & -0.049343 & -0.049189 & -0.052086 & -0.051373 & -0.049343 \tabularnewline
0.36 & -0.047804 & -0.046881 & -0.046778 & -0.046778 & -0.04035 & -0.046778 & -0.049241 & -0.046778 \tabularnewline
0.38 & -0.025352 & -0.018728 & -0.019995 & -0.019995 & -0.017038 & -0.019995 & -0.014222 & -0.019995 \tabularnewline
0.4 & -0.012955 & -0.012761 & -0.012955 & -0.012712 & -0.012663 & -0.012955 & -0.012663 & -0.012955 \tabularnewline
0.42 & -0.009183 & -0.002284 & 0.003959 & 0.003959 & 0.000345 & -0.012469 & -0.006226 & 0.003959 \tabularnewline
0.44 & 0.0045 & 0.005095 & 0.005312 & 0.005312 & 0.005258 & 0.003959 & 0.004175 & 0.005312 \tabularnewline
0.46 & 0.010891 & 0.014647 & 0.014611 & 0.014611 & 0.014694 & 0.014611 & 0.01517 & 0.014611 \tabularnewline
0.48 & 0.015087 & 0.016398 & 0.015206 & 0.015206 & 0.016569 & 0.015206 & 0.018273 & 0.015206 \tabularnewline
0.5 & 0.019465 & 0.020434 & 0.019465 & 0.020434 & 0.020434 & 0.019465 & 0.020434 & 0.020434 \tabularnewline
0.52 & 0.021403 & 0.021403 & 0.021403 & 0.021403 & 0.021403 & 0.021403 & 0.021403 & 0.021403 \tabularnewline
0.54 & 0.024011 & 0.027532 & 0.027923 & 0.027923 & 0.027011 & 0.021403 & 0.021795 & 0.027923 \tabularnewline
0.56 & 0.028322 & 0.028596 & 0.028588 & 0.028588 & 0.02859 & 0.028588 & 0.028626 & 0.028588 \tabularnewline
0.58 & 0.028624 & 0.029171 & 0.028633 & 0.028633 & 0.028944 & 0.028633 & 0.02951 & 0.028633 \tabularnewline
0.6 & 0.030048 & 0.033572 & 0.030048 & 0.032984 & 0.032397 & 0.030048 & 0.032397 & 0.035921 \tabularnewline
0.62 & 0.036103 & 0.036666 & 0.036829 & 0.036829 & 0.036448 & 0.035921 & 0.036084 & 0.036829 \tabularnewline
0.64 & 0.037671 & 0.039264 & 0.038935 & 0.038935 & 0.03843 & 0.036829 & 0.046828 & 0.038935 \tabularnewline
0.66 & 0.043868 & 0.047631 & 0.047156 & 0.047156 & 0.046663 & 0.047156 & 0.048508 & 0.047156 \tabularnewline
0.68 & 0.048617 & 0.049948 & 0.048982 & 0.048982 & 0.049224 & 0.048982 & 0.050028 & 0.048982 \tabularnewline
0.7 & 0.050994 & 0.051999 & 0.050994 & 0.051712 & 0.051425 & 0.050994 & 0.051425 & 0.05243 \tabularnewline
0.72 & 0.053949 & 0.059415 & 0.060023 & 0.060023 & 0.056075 & 0.05243 & 0.053038 & 0.060023 \tabularnewline
0.74 & 0.060818 & 0.06229 & 0.062011 & 0.062011 & 0.061335 & 0.060023 & 0.063727 & 0.062011 \tabularnewline
0.76 & 0.063208 & 0.065886 & 0.064006 & 0.064006 & 0.063687 & 0.064006 & 0.067348 & 0.064006 \tabularnewline
0.78 & 0.068184 & 0.069893 & 0.069228 & 0.069228 & 0.069251 & 0.069228 & 0.06971 & 0.070374 \tabularnewline
0.8 & 0.070374 & 0.075543 & 0.070374 & 0.073605 & 0.071666 & 0.070374 & 0.071666 & 0.076835 \tabularnewline
0.82 & 0.077053 & 0.078023 & 0.077925 & 0.077925 & 0.077249 & 0.076835 & 0.08274 & 0.077925 \tabularnewline
0.84 & 0.07989 & 0.08326 & 0.082838 & 0.082838 & 0.080676 & 0.077925 & 0.084173 & 0.082838 \tabularnewline
0.86 & 0.083892 & 0.086834 & 0.084595 & 0.084595 & 0.084138 & 0.084595 & 0.087223 & 0.084595 \tabularnewline
0.88 & 0.088488 & 0.08992 & 0.089462 & 0.089462 & 0.089072 & 0.089462 & 0.089677 & 0.090136 \tabularnewline
0.9 & 0.090136 & 0.092819 & 0.090136 & 0.091627 & 0.090434 & 0.090136 & 0.090434 & 0.093117 \tabularnewline
0.92 & 0.098325 & 0.11993 & 0.119157 & 0.119157 & 0.100408 & 0.093117 & 0.124826 & 0.119157 \tabularnewline
0.94 & 0.121734 & 0.127745 & 0.125599 & 0.125599 & 0.12212 & 0.119157 & 0.129765 & 0.125599 \tabularnewline
0.96 & 0.129386 & 0.141283 & 0.131911 & 0.131911 & 0.129639 & 0.131911 & 0.139274 & 0.148646 \tabularnewline
0.98 & 0.145299 & 0.183869 & 0.148646 & 0.148646 & 0.145634 & 0.148646 & 0.158581 & 0.193804 \tabularnewline
\hline
\end{tabular}
%Source: https://freestatistics.org/blog/index.php?pk=50297&T=3

[TABLE]
[ROW][C]Percentiles - Ungrouped Data[/C][/ROW]
[ROW][C]p[/C][C]Weighted Average at Xnp[/C][C]Weighted Average at X(n+1)p[/C][C]Empirical Distribution Function[/C][C]Empirical Distribution Function - Averaging[/C][C]Empirical Distribution Function - Interpolation[/C][C]Closest Observation[/C][C]True Basic - Statistics Graphics Toolkit[/C][C]MS Excel (old versions)[/C][/ROW]
[ROW][C]0.02[/C][C]-0.211636[/C][C]-0.210725[/C][C]-0.175182[/C][C]-0.175182[/C][C]-0.174212[/C][C]-0.22075[/C][C]-0.185207[/C][C]-0.22075[/C][/ROW]
[ROW][C]0.04[/C][C]-0.173028[/C][C]-0.172812[/C][C]-0.169797[/C][C]-0.169797[/C][C]-0.167687[/C][C]-0.175182[/C][C]-0.172166[/C][C]-0.175182[/C][/ROW]
[ROW][C]0.06[/C][C]-0.16628[/C][C]-0.165929[/C][C]-0.163936[/C][C]-0.163936[/C][C]-0.154504[/C][C]-0.163936[/C][C]-0.167804[/C][C]-0.163936[/C][/ROW]
[ROW][C]0.08[/C][C]-0.149962[/C][C]-0.148565[/C][C]-0.146469[/C][C]-0.146469[/C][C]-0.122374[/C][C]-0.146469[/C][C]-0.16184[/C][C]-0.146469[/C][/ROW]
[ROW][C]0.1[/C][C]-0.113004[/C][C]-0.111753[/C][C]-0.113004[/C][C]-0.106746[/C][C]-0.101739[/C][C]-0.113004[/C][C]-0.101739[/C][C]-0.113004[/C][/ROW]
[ROW][C]0.12[/C][C]-0.099227[/C][C]-0.09847[/C][C]-0.094184[/C][C]-0.094184[/C][C]-0.093521[/C][C]-0.100487[/C][C]-0.096201[/C][C]-0.100487[/C][/ROW]
[ROW][C]0.14[/C][C]-0.090869[/C][C]-0.089708[/C][C]-0.085895[/C][C]-0.085895[/C][C]-0.085731[/C][C]-0.094184[/C][C]-0.090371[/C][C]-0.085895[/C][/ROW]
[ROW][C]0.16[/C][C]-0.085515[/C][C]-0.085414[/C][C]-0.085262[/C][C]-0.085262[/C][C]-0.084845[/C][C]-0.085262[/C][C]-0.085743[/C][C]-0.085262[/C][/ROW]
[ROW][C]0.18[/C][C]-0.084503[/C][C]-0.084332[/C][C]-0.084313[/C][C]-0.084313[/C][C]-0.080666[/C][C]-0.084313[/C][C]-0.085243[/C][C]-0.084313[/C][/ROW]
[ROW][C]0.2[/C][C]-0.07843[/C][C]-0.077946[/C][C]-0.07843[/C][C]-0.077221[/C][C]-0.076495[/C][C]-0.07843[/C][C]-0.076495[/C][C]-0.07843[/C][/ROW]
[ROW][C]0.22[/C][C]-0.075851[/C][C]-0.075675[/C][C]-0.075211[/C][C]-0.075211[/C][C]-0.075227[/C][C]-0.076011[/C][C]-0.075547[/C][C]-0.076011[/C][/ROW]
[ROW][C]0.24[/C][C]-0.07225[/C][C]-0.070473[/C][C]-0.067809[/C][C]-0.067809[/C][C]-0.067365[/C][C]-0.075211[/C][C]-0.072546[/C][C]-0.067809[/C][/ROW]
[ROW][C]0.26[/C][C]-0.066146[/C][C]-0.065425[/C][C]-0.065037[/C][C]-0.065037[/C][C]-0.063588[/C][C]-0.065037[/C][C]-0.067421[/C][C]-0.065037[/C][/ROW]
[ROW][C]0.28[/C][C]-0.061626[/C][C]-0.060389[/C][C]-0.060773[/C][C]-0.060773[/C][C]-0.058276[/C][C]-0.060773[/C][C]-0.056356[/C][C]-0.060773[/C][/ROW]
[ROW][C]0.3[/C][C]-0.055971[/C][C]-0.055775[/C][C]-0.055971[/C][C]-0.055645[/C][C]-0.055514[/C][C]-0.055971[/C][C]-0.055514[/C][C]-0.055971[/C][/ROW]
[ROW][C]0.32[/C][C]-0.054671[/C][C]-0.053637[/C][C]-0.052086[/C][C]-0.052086[/C][C]-0.052474[/C][C]-0.055318[/C][C]-0.053766[/C][C]-0.052086[/C][/ROW]
[ROW][C]0.34[/C][C]-0.050989[/C][C]-0.050056[/C][C]-0.049343[/C][C]-0.049343[/C][C]-0.049189[/C][C]-0.052086[/C][C]-0.051373[/C][C]-0.049343[/C][/ROW]
[ROW][C]0.36[/C][C]-0.047804[/C][C]-0.046881[/C][C]-0.046778[/C][C]-0.046778[/C][C]-0.04035[/C][C]-0.046778[/C][C]-0.049241[/C][C]-0.046778[/C][/ROW]
[ROW][C]0.38[/C][C]-0.025352[/C][C]-0.018728[/C][C]-0.019995[/C][C]-0.019995[/C][C]-0.017038[/C][C]-0.019995[/C][C]-0.014222[/C][C]-0.019995[/C][/ROW]
[ROW][C]0.4[/C][C]-0.012955[/C][C]-0.012761[/C][C]-0.012955[/C][C]-0.012712[/C][C]-0.012663[/C][C]-0.012955[/C][C]-0.012663[/C][C]-0.012955[/C][/ROW]
[ROW][C]0.42[/C][C]-0.009183[/C][C]-0.002284[/C][C]0.003959[/C][C]0.003959[/C][C]0.000345[/C][C]-0.012469[/C][C]-0.006226[/C][C]0.003959[/C][/ROW]
[ROW][C]0.44[/C][C]0.0045[/C][C]0.005095[/C][C]0.005312[/C][C]0.005312[/C][C]0.005258[/C][C]0.003959[/C][C]0.004175[/C][C]0.005312[/C][/ROW]
[ROW][C]0.46[/C][C]0.010891[/C][C]0.014647[/C][C]0.014611[/C][C]0.014611[/C][C]0.014694[/C][C]0.014611[/C][C]0.01517[/C][C]0.014611[/C][/ROW]
[ROW][C]0.48[/C][C]0.015087[/C][C]0.016398[/C][C]0.015206[/C][C]0.015206[/C][C]0.016569[/C][C]0.015206[/C][C]0.018273[/C][C]0.015206[/C][/ROW]
[ROW][C]0.5[/C][C]0.019465[/C][C]0.020434[/C][C]0.019465[/C][C]0.020434[/C][C]0.020434[/C][C]0.019465[/C][C]0.020434[/C][C]0.020434[/C][/ROW]
[ROW][C]0.52[/C][C]0.021403[/C][C]0.021403[/C][C]0.021403[/C][C]0.021403[/C][C]0.021403[/C][C]0.021403[/C][C]0.021403[/C][C]0.021403[/C][/ROW]
[ROW][C]0.54[/C][C]0.024011[/C][C]0.027532[/C][C]0.027923[/C][C]0.027923[/C][C]0.027011[/C][C]0.021403[/C][C]0.021795[/C][C]0.027923[/C][/ROW]
[ROW][C]0.56[/C][C]0.028322[/C][C]0.028596[/C][C]0.028588[/C][C]0.028588[/C][C]0.02859[/C][C]0.028588[/C][C]0.028626[/C][C]0.028588[/C][/ROW]
[ROW][C]0.58[/C][C]0.028624[/C][C]0.029171[/C][C]0.028633[/C][C]0.028633[/C][C]0.028944[/C][C]0.028633[/C][C]0.02951[/C][C]0.028633[/C][/ROW]
[ROW][C]0.6[/C][C]0.030048[/C][C]0.033572[/C][C]0.030048[/C][C]0.032984[/C][C]0.032397[/C][C]0.030048[/C][C]0.032397[/C][C]0.035921[/C][/ROW]
[ROW][C]0.62[/C][C]0.036103[/C][C]0.036666[/C][C]0.036829[/C][C]0.036829[/C][C]0.036448[/C][C]0.035921[/C][C]0.036084[/C][C]0.036829[/C][/ROW]
[ROW][C]0.64[/C][C]0.037671[/C][C]0.039264[/C][C]0.038935[/C][C]0.038935[/C][C]0.03843[/C][C]0.036829[/C][C]0.046828[/C][C]0.038935[/C][/ROW]
[ROW][C]0.66[/C][C]0.043868[/C][C]0.047631[/C][C]0.047156[/C][C]0.047156[/C][C]0.046663[/C][C]0.047156[/C][C]0.048508[/C][C]0.047156[/C][/ROW]
[ROW][C]0.68[/C][C]0.048617[/C][C]0.049948[/C][C]0.048982[/C][C]0.048982[/C][C]0.049224[/C][C]0.048982[/C][C]0.050028[/C][C]0.048982[/C][/ROW]
[ROW][C]0.7[/C][C]0.050994[/C][C]0.051999[/C][C]0.050994[/C][C]0.051712[/C][C]0.051425[/C][C]0.050994[/C][C]0.051425[/C][C]0.05243[/C][/ROW]
[ROW][C]0.72[/C][C]0.053949[/C][C]0.059415[/C][C]0.060023[/C][C]0.060023[/C][C]0.056075[/C][C]0.05243[/C][C]0.053038[/C][C]0.060023[/C][/ROW]
[ROW][C]0.74[/C][C]0.060818[/C][C]0.06229[/C][C]0.062011[/C][C]0.062011[/C][C]0.061335[/C][C]0.060023[/C][C]0.063727[/C][C]0.062011[/C][/ROW]
[ROW][C]0.76[/C][C]0.063208[/C][C]0.065886[/C][C]0.064006[/C][C]0.064006[/C][C]0.063687[/C][C]0.064006[/C][C]0.067348[/C][C]0.064006[/C][/ROW]
[ROW][C]0.78[/C][C]0.068184[/C][C]0.069893[/C][C]0.069228[/C][C]0.069228[/C][C]0.069251[/C][C]0.069228[/C][C]0.06971[/C][C]0.070374[/C][/ROW]
[ROW][C]0.8[/C][C]0.070374[/C][C]0.075543[/C][C]0.070374[/C][C]0.073605[/C][C]0.071666[/C][C]0.070374[/C][C]0.071666[/C][C]0.076835[/C][/ROW]
[ROW][C]0.82[/C][C]0.077053[/C][C]0.078023[/C][C]0.077925[/C][C]0.077925[/C][C]0.077249[/C][C]0.076835[/C][C]0.08274[/C][C]0.077925[/C][/ROW]
[ROW][C]0.84[/C][C]0.07989[/C][C]0.08326[/C][C]0.082838[/C][C]0.082838[/C][C]0.080676[/C][C]0.077925[/C][C]0.084173[/C][C]0.082838[/C][/ROW]
[ROW][C]0.86[/C][C]0.083892[/C][C]0.086834[/C][C]0.084595[/C][C]0.084595[/C][C]0.084138[/C][C]0.084595[/C][C]0.087223[/C][C]0.084595[/C][/ROW]
[ROW][C]0.88[/C][C]0.088488[/C][C]0.08992[/C][C]0.089462[/C][C]0.089462[/C][C]0.089072[/C][C]0.089462[/C][C]0.089677[/C][C]0.090136[/C][/ROW]
[ROW][C]0.9[/C][C]0.090136[/C][C]0.092819[/C][C]0.090136[/C][C]0.091627[/C][C]0.090434[/C][C]0.090136[/C][C]0.090434[/C][C]0.093117[/C][/ROW]
[ROW][C]0.92[/C][C]0.098325[/C][C]0.11993[/C][C]0.119157[/C][C]0.119157[/C][C]0.100408[/C][C]0.093117[/C][C]0.124826[/C][C]0.119157[/C][/ROW]
[ROW][C]0.94[/C][C]0.121734[/C][C]0.127745[/C][C]0.125599[/C][C]0.125599[/C][C]0.12212[/C][C]0.119157[/C][C]0.129765[/C][C]0.125599[/C][/ROW]
[ROW][C]0.96[/C][C]0.129386[/C][C]0.141283[/C][C]0.131911[/C][C]0.131911[/C][C]0.129639[/C][C]0.131911[/C][C]0.139274[/C][C]0.148646[/C][/ROW]
[ROW][C]0.98[/C][C]0.145299[/C][C]0.183869[/C][C]0.148646[/C][C]0.148646[/C][C]0.145634[/C][C]0.148646[/C][C]0.158581[/C][C]0.193804[/C][/ROW]
[/TABLE]
Source: https://freestatistics.org/blog/index.php?pk=50297&T=3

Globally Unique Identifier (entire table): ba.freestatistics.org/blog/index.php?pk=50297&T=3

As an alternative you can also use a QR Code:  

The GUIDs for individual cells are displayed in the table below:

Percentiles - Ungrouped Data
pWeighted Average at XnpWeighted Average at X(n+1)pEmpirical Distribution FunctionEmpirical Distribution Function - AveragingEmpirical Distribution Function - InterpolationClosest ObservationTrue Basic - Statistics Graphics ToolkitMS Excel (old versions)
0.02-0.211636-0.210725-0.175182-0.175182-0.174212-0.22075-0.185207-0.22075
0.04-0.173028-0.172812-0.169797-0.169797-0.167687-0.175182-0.172166-0.175182
0.06-0.16628-0.165929-0.163936-0.163936-0.154504-0.163936-0.167804-0.163936
0.08-0.149962-0.148565-0.146469-0.146469-0.122374-0.146469-0.16184-0.146469
0.1-0.113004-0.111753-0.113004-0.106746-0.101739-0.113004-0.101739-0.113004
0.12-0.099227-0.09847-0.094184-0.094184-0.093521-0.100487-0.096201-0.100487
0.14-0.090869-0.089708-0.085895-0.085895-0.085731-0.094184-0.090371-0.085895
0.16-0.085515-0.085414-0.085262-0.085262-0.084845-0.085262-0.085743-0.085262
0.18-0.084503-0.084332-0.084313-0.084313-0.080666-0.084313-0.085243-0.084313
0.2-0.07843-0.077946-0.07843-0.077221-0.076495-0.07843-0.076495-0.07843
0.22-0.075851-0.075675-0.075211-0.075211-0.075227-0.076011-0.075547-0.076011
0.24-0.07225-0.070473-0.067809-0.067809-0.067365-0.075211-0.072546-0.067809
0.26-0.066146-0.065425-0.065037-0.065037-0.063588-0.065037-0.067421-0.065037
0.28-0.061626-0.060389-0.060773-0.060773-0.058276-0.060773-0.056356-0.060773
0.3-0.055971-0.055775-0.055971-0.055645-0.055514-0.055971-0.055514-0.055971
0.32-0.054671-0.053637-0.052086-0.052086-0.052474-0.055318-0.053766-0.052086
0.34-0.050989-0.050056-0.049343-0.049343-0.049189-0.052086-0.051373-0.049343
0.36-0.047804-0.046881-0.046778-0.046778-0.04035-0.046778-0.049241-0.046778
0.38-0.025352-0.018728-0.019995-0.019995-0.017038-0.019995-0.014222-0.019995
0.4-0.012955-0.012761-0.012955-0.012712-0.012663-0.012955-0.012663-0.012955
0.42-0.009183-0.0022840.0039590.0039590.000345-0.012469-0.0062260.003959
0.440.00450.0050950.0053120.0053120.0052580.0039590.0041750.005312
0.460.0108910.0146470.0146110.0146110.0146940.0146110.015170.014611
0.480.0150870.0163980.0152060.0152060.0165690.0152060.0182730.015206
0.50.0194650.0204340.0194650.0204340.0204340.0194650.0204340.020434
0.520.0214030.0214030.0214030.0214030.0214030.0214030.0214030.021403
0.540.0240110.0275320.0279230.0279230.0270110.0214030.0217950.027923
0.560.0283220.0285960.0285880.0285880.028590.0285880.0286260.028588
0.580.0286240.0291710.0286330.0286330.0289440.0286330.029510.028633
0.60.0300480.0335720.0300480.0329840.0323970.0300480.0323970.035921
0.620.0361030.0366660.0368290.0368290.0364480.0359210.0360840.036829
0.640.0376710.0392640.0389350.0389350.038430.0368290.0468280.038935
0.660.0438680.0476310.0471560.0471560.0466630.0471560.0485080.047156
0.680.0486170.0499480.0489820.0489820.0492240.0489820.0500280.048982
0.70.0509940.0519990.0509940.0517120.0514250.0509940.0514250.05243
0.720.0539490.0594150.0600230.0600230.0560750.052430.0530380.060023
0.740.0608180.062290.0620110.0620110.0613350.0600230.0637270.062011
0.760.0632080.0658860.0640060.0640060.0636870.0640060.0673480.064006
0.780.0681840.0698930.0692280.0692280.0692510.0692280.069710.070374
0.80.0703740.0755430.0703740.0736050.0716660.0703740.0716660.076835
0.820.0770530.0780230.0779250.0779250.0772490.0768350.082740.077925
0.840.079890.083260.0828380.0828380.0806760.0779250.0841730.082838
0.860.0838920.0868340.0845950.0845950.0841380.0845950.0872230.084595
0.880.0884880.089920.0894620.0894620.0890720.0894620.0896770.090136
0.90.0901360.0928190.0901360.0916270.0904340.0901360.0904340.093117
0.920.0983250.119930.1191570.1191570.1004080.0931170.1248260.119157
0.940.1217340.1277450.1255990.1255990.122120.1191570.1297650.125599
0.960.1293860.1412830.1319110.1319110.1296390.1319110.1392740.148646
0.980.1452990.1838690.1486460.1486460.1456340.1486460.1585810.193804


Frequency Table (Histogram)
BinsMidpointAbs. FrequencyRel. FrequencyCumul. Rel. Freq.Density
[-0.25,-0.2[-0.22510.0166670.0166670.333333
[-0.2,-0.15[-0.17530.050.0666671
[-0.15,-0.1[-0.12530.050.1166671
[-0.1,-0.05[-0.075130.2166670.3333334.333333
[-0.05,0[-0.02550.0833330.4166671.666667
[0,0.05[0.025160.2666670.6833335.333333
[0.05,0.1[0.075140.2333330.9166674.666667
[0.1,0.15[0.12540.0666670.9833331.333333
[0.15,0.2]0.17510.01666710.333333

\begin{tabular}{lllllllll}
\hline
Frequency Table (Histogram) \tabularnewline
Bins & Midpoint & Abs. Frequency & Rel. Frequency & Cumul. Rel. Freq. & Density \tabularnewline
[-0.25,-0.2[ & -0.225 & 1 & 0.016667 & 0.016667 & 0.333333 \tabularnewline
[-0.2,-0.15[ & -0.175 & 3 & 0.05 & 0.066667 & 1 \tabularnewline
[-0.15,-0.1[ & -0.125 & 3 & 0.05 & 0.116667 & 1 \tabularnewline
[-0.1,-0.05[ & -0.075 & 13 & 0.216667 & 0.333333 & 4.333333 \tabularnewline
[-0.05,0[ & -0.025 & 5 & 0.083333 & 0.416667 & 1.666667 \tabularnewline
[0,0.05[ & 0.025 & 16 & 0.266667 & 0.683333 & 5.333333 \tabularnewline
[0.05,0.1[ & 0.075 & 14 & 0.233333 & 0.916667 & 4.666667 \tabularnewline
[0.1,0.15[ & 0.125 & 4 & 0.066667 & 0.983333 & 1.333333 \tabularnewline
[0.15,0.2] & 0.175 & 1 & 0.016667 & 1 & 0.333333 \tabularnewline
\hline
\end{tabular}
%Source: https://freestatistics.org/blog/index.php?pk=50297&T=4

[TABLE]
[ROW][C]Frequency Table (Histogram)[/C][/ROW]
[ROW][C]Bins[/C][C]Midpoint[/C][C]Abs. Frequency[/C][C]Rel. Frequency[/C][C]Cumul. Rel. Freq.[/C][C]Density[/C][/ROW]
[ROW][C][-0.25,-0.2[[/C][C]-0.225[/C][C]1[/C][C]0.016667[/C][C]0.016667[/C][C]0.333333[/C][/ROW]
[ROW][C][-0.2,-0.15[[/C][C]-0.175[/C][C]3[/C][C]0.05[/C][C]0.066667[/C][C]1[/C][/ROW]
[ROW][C][-0.15,-0.1[[/C][C]-0.125[/C][C]3[/C][C]0.05[/C][C]0.116667[/C][C]1[/C][/ROW]
[ROW][C][-0.1,-0.05[[/C][C]-0.075[/C][C]13[/C][C]0.216667[/C][C]0.333333[/C][C]4.333333[/C][/ROW]
[ROW][C][-0.05,0[[/C][C]-0.025[/C][C]5[/C][C]0.083333[/C][C]0.416667[/C][C]1.666667[/C][/ROW]
[ROW][C][0,0.05[[/C][C]0.025[/C][C]16[/C][C]0.266667[/C][C]0.683333[/C][C]5.333333[/C][/ROW]
[ROW][C][0.05,0.1[[/C][C]0.075[/C][C]14[/C][C]0.233333[/C][C]0.916667[/C][C]4.666667[/C][/ROW]
[ROW][C][0.1,0.15[[/C][C]0.125[/C][C]4[/C][C]0.066667[/C][C]0.983333[/C][C]1.333333[/C][/ROW]
[ROW][C][0.15,0.2][/C][C]0.175[/C][C]1[/C][C]0.016667[/C][C]1[/C][C]0.333333[/C][/ROW]
[/TABLE]
Source: https://freestatistics.org/blog/index.php?pk=50297&T=4

Globally Unique Identifier (entire table): ba.freestatistics.org/blog/index.php?pk=50297&T=4

As an alternative you can also use a QR Code:  

The GUIDs for individual cells are displayed in the table below:

Frequency Table (Histogram)
BinsMidpointAbs. FrequencyRel. FrequencyCumul. Rel. Freq.Density
[-0.25,-0.2[-0.22510.0166670.0166670.333333
[-0.2,-0.15[-0.17530.050.0666671
[-0.15,-0.1[-0.12530.050.1166671
[-0.1,-0.05[-0.075130.2166670.3333334.333333
[-0.05,0[-0.02550.0833330.4166671.666667
[0,0.05[0.025160.2666670.6833335.333333
[0.05,0.1[0.075140.2333330.9166674.666667
[0.1,0.15[0.12540.0666670.9833331.333333
[0.15,0.2]0.17510.01666710.333333


Properties of Density Trace
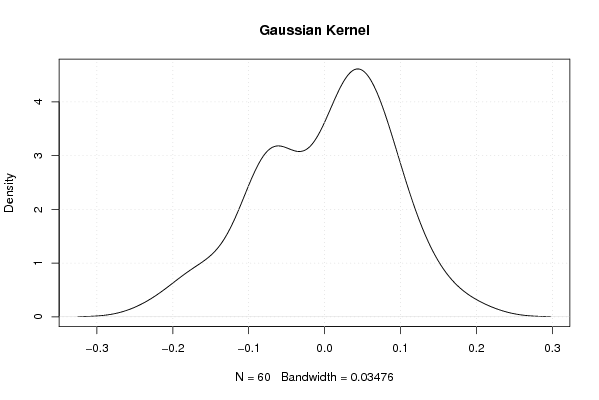
Bandwidth0.0347641068737323
#Observations60

\begin{tabular}{lllllllll}
\hline
Properties of Density Trace \tabularnewline
Bandwidth & 0.0347641068737323 \tabularnewline
#Observations & 60 \tabularnewline
\hline
\end{tabular}
%Source: https://freestatistics.org/blog/index.php?pk=50297&T=5

[TABLE]
[ROW][C]Properties of Density Trace[/C][/ROW]
[ROW][C]Bandwidth[/C][C]0.0347641068737323[/C][/ROW]
[ROW][C]#Observations[/C][C]60[/C][/ROW]
[/TABLE]
Source: https://freestatistics.org/blog/index.php?pk=50297&T=5

Globally Unique Identifier (entire table): ba.freestatistics.org/blog/index.php?pk=50297&T=5

As an alternative you can also use a QR Code:  

The GUIDs for individual cells are displayed in the table below:

Properties of Density Trace
Bandwidth0.0347641068737323
#Observations60


Parameters (Session):
par1 = 0 ; par2 = 36 ;
Parameters (R input):
R code (references can be found in the software module):
load(file='createtable')
x <-sort(x[!is.na(x)])
num <- 50
res <- array(NA,dim=c(num,3))
geomean <- function(x) {
return(exp(mean(log(x))))
}
harmean <- function(x) {
return(1/mean(1/x))
}
quamean <- function(x) {
return(sqrt(mean(x*x)))
}
winmean <- function(x) {
x <-sort(x[!is.na(x)])
n<-length(x)
denom <- 3
nodenom <- n/denom
if (nodenom>40) denom <- n/40
sqrtn = sqrt(n)
roundnodenom = floor(nodenom)
win <- array(NA,dim=c(roundnodenom,2))
for (j in 1:roundnodenom) {
win[j,1] <- (j*x[j+1]+sum(x[(j+1):(n-j)])+j*x[n-j])/n
win[j,2] <- sd(c(rep(x[j+1],j),x[(j+1):(n-j)],rep(x[n-j],j)))/sqrtn
}
return(win)
}
trimean <- function(x) {
x <-sort(x[!is.na(x)])
n<-length(x)
denom <- 3
nodenom <- n/denom
if (nodenom>40) denom <- n/40
sqrtn = sqrt(n)
roundnodenom = floor(nodenom)
tri <- array(NA,dim=c(roundnodenom,2))
for (j in 1:roundnodenom) {
tri[j,1] <- mean(x,trim=j/n)
tri[j,2] <- sd(x[(j+1):(n-j)]) / sqrt(n-j*2)
}
return(tri)
}
midrange <- function(x) {
return((max(x)+min(x))/2)
}
q1 <- function(data,n,p,i,f) {
np <- n*p;
i <<- floor(np)
f <<- np - i
qvalue <- (1-f)*data[i] + f*data[i+1]
}
q2 <- function(data,n,p,i,f) {
np <- (n+1)*p
i <<- floor(np)
f <<- np - i
qvalue <- (1-f)*data[i] + f*data[i+1]
}
q3 <- function(data,n,p,i,f) {
np <- n*p
i <<- floor(np)
f <<- np - i
if (f==0) {
qvalue <- data[i]
} else {
qvalue <- data[i+1]
}
}
q4 <- function(data,n,p,i,f) {
np <- n*p
i <<- floor(np)
f <<- np - i
if (f==0) {
qvalue <- (data[i]+data[i+1])/2
} else {
qvalue <- data[i+1]
}
}
q5 <- function(data,n,p,i,f) {
np <- (n-1)*p
i <<- floor(np)
f <<- np - i
if (f==0) {
qvalue <- data[i+1]
} else {
qvalue <- data[i+1] + f*(data[i+2]-data[i+1])
}
}
q6 <- function(data,n,p,i,f) {
np <- n*p+0.5
i <<- floor(np)
f <<- np - i
qvalue <- data[i]
}
q7 <- function(data,n,p,i,f) {
np <- (n+1)*p
i <<- floor(np)
f <<- np - i
if (f==0) {
qvalue <- data[i]
} else {
qvalue <- f*data[i] + (1-f)*data[i+1]
}
}
q8 <- function(data,n,p,i,f) {
np <- (n+1)*p
i <<- floor(np)
f <<- np - i
if (f==0) {
qvalue <- data[i]
} else {
if (f == 0.5) {
qvalue <- (data[i]+data[i+1])/2
} else {
if (f < 0.5) {
qvalue <- data[i]
} else {
qvalue <- data[i+1]
}
}
}
}
iqd <- function(x,def) {
x <-sort(x[!is.na(x)])
n<-length(x)
if (def==1) {
qvalue1 <- q1(x,n,0.25,i,f)
qvalue3 <- q1(x,n,0.75,i,f)
}
if (def==2) {
qvalue1 <- q2(x,n,0.25,i,f)
qvalue3 <- q2(x,n,0.75,i,f)
}
if (def==3) {
qvalue1 <- q3(x,n,0.25,i,f)
qvalue3 <- q3(x,n,0.75,i,f)
}
if (def==4) {
qvalue1 <- q4(x,n,0.25,i,f)
qvalue3 <- q4(x,n,0.75,i,f)
}
if (def==5) {
qvalue1 <- q5(x,n,0.25,i,f)
qvalue3 <- q5(x,n,0.75,i,f)
}
if (def==6) {
qvalue1 <- q6(x,n,0.25,i,f)
qvalue3 <- q6(x,n,0.75,i,f)
}
if (def==7) {
qvalue1 <- q7(x,n,0.25,i,f)
qvalue3 <- q7(x,n,0.75,i,f)
}
if (def==8) {
qvalue1 <- q8(x,n,0.25,i,f)
qvalue3 <- q8(x,n,0.75,i,f)
}
iqdiff <- qvalue3 - qvalue1
return(c(iqdiff,iqdiff/2,iqdiff/(qvalue3 + qvalue1)))
}
midmean <- function(x,def) {
x <-sort(x[!is.na(x)])
n<-length(x)
if (def==1) {
qvalue1 <- q1(x,n,0.25,i,f)
qvalue3 <- q1(x,n,0.75,i,f)
}
if (def==2) {
qvalue1 <- q2(x,n,0.25,i,f)
qvalue3 <- q2(x,n,0.75,i,f)
}
if (def==3) {
qvalue1 <- q3(x,n,0.25,i,f)
qvalue3 <- q3(x,n,0.75,i,f)
}
if (def==4) {
qvalue1 <- q4(x,n,0.25,i,f)
qvalue3 <- q4(x,n,0.75,i,f)
}
if (def==5) {
qvalue1 <- q5(x,n,0.25,i,f)
qvalue3 <- q5(x,n,0.75,i,f)
}
if (def==6) {
qvalue1 <- q6(x,n,0.25,i,f)
qvalue3 <- q6(x,n,0.75,i,f)
}
if (def==7) {
qvalue1 <- q7(x,n,0.25,i,f)
qvalue3 <- q7(x,n,0.75,i,f)
}
if (def==8) {
qvalue1 <- q8(x,n,0.25,i,f)
qvalue3 <- q8(x,n,0.75,i,f)
}
midm <- 0
myn <- 0
roundno4 <- round(n/4)
round3no4 <- round(3*n/4)
for (i in 1:n) {
if ((x[i]>=qvalue1) & (x[i]<=qvalue3)){
midm = midm + x[i]
myn = myn + 1
}
}
midm = midm / myn
return(midm)
}
range <- max(x) - min(x)
lx <- length(x)
biasf <- (lx-1)/lx
varx <- var(x)
bvarx <- varx*biasf
sdx <- sqrt(varx)
mx <- mean(x)
bsdx <- sqrt(bvarx)
x2 <- x*x
mse0 <- sum(x2)/lx
xmm <- x-mx
xmm2 <- xmm*xmm
msem <- sum(xmm2)/lx
axmm <- abs(x - mx)
medx <- median(x)
axmmed <- abs(x - medx)
xmmed <- x - medx
xmmed2 <- xmmed*xmmed
msemed <- sum(xmmed2)/lx
qarr <- array(NA,dim=c(8,3))
for (j in 1:8) {
qarr[j,] <- iqd(x,j)
}
sdpo <- 0
adpo <- 0
for (i in 1:(lx-1)) {
for (j in (i+1):lx) {
ldi <- x[i]-x[j]
aldi <- abs(ldi)
sdpo = sdpo + ldi * ldi
adpo = adpo + aldi
}
}
denom <- (lx*(lx-1)/2)
sdpo = sdpo / denom
adpo = adpo / denom
gmd <- 0
for (i in 1:lx) {
for (j in 1:lx) {
ldi <- abs(x[i]-x[j])
gmd = gmd + ldi
}
}
gmd <- gmd / (lx*(lx-1))
sumx <- sum(x)
pk <- x / sumx
ck <- cumsum(pk)
dk <- array(NA,dim=lx)
for (i in 1:lx) {
if (ck[i] <= 0.5) dk[i] <- ck[i] else dk[i] <- 1 - ck[i]
}
bigd <- sum(dk) * 2 / (lx-1)
iod <- 1 - sum(pk*pk)
res[1,] <- c('Absolute range','absolute.htm', range)
res[2,] <- c('Relative range (unbiased)','relative.htm', range/sd(x))
res[3,] <- c('Relative range (biased)','relative.htm', range/sqrt(varx*biasf))
res[4,] <- c('Variance (unbiased)','unbiased.htm', varx)
res[5,] <- c('Variance (biased)','biased.htm', bvarx)
res[6,] <- c('Standard Deviation (unbiased)','unbiased1.htm', sdx)
res[7,] <- c('Standard Deviation (biased)','biased1.htm', bsdx)
res[8,] <- c('Coefficient of Variation (unbiased)','variation.htm', sdx/mx)
res[9,] <- c('Coefficient of Variation (biased)','variation.htm', bsdx/mx)
res[10,] <- c('Mean Squared Error (MSE versus 0)','mse.htm', mse0)
res[11,] <- c('Mean Squared Error (MSE versus Mean)','mse.htm', msem)
res[12,] <- c('Mean Absolute Deviation from Mean (MAD Mean)', 'mean2.htm', sum(axmm)/lx)
res[13,] <- c('Mean Absolute Deviation from Median (MAD Median)', 'median1.htm', sum(axmmed)/lx)
res[14,] <- c('Median Absolute Deviation from Mean', 'mean3.htm', median(axmm))
res[15,] <- c('Median Absolute Deviation from Median', 'median2.htm', median(axmmed))
res[16,] <- c('Mean Squared Deviation from Mean', 'mean1.htm', msem)
res[17,] <- c('Mean Squared Deviation from Median', 'median.htm', msemed)
mylink1 <- hyperlink('difference.htm','Interquartile Difference','')
mylink2 <- paste(mylink1,hyperlink('method_1.htm','(Weighted Average at Xnp)',''),sep=' ')
res[18,] <- c('', mylink2, qarr[1,1])
mylink2 <- paste(mylink1,hyperlink('method_2.htm','(Weighted Average at X(n+1)p)',''),sep=' ')
res[19,] <- c('', mylink2, qarr[2,1])
mylink2 <- paste(mylink1,hyperlink('method_3.htm','(Empirical Distribution Function)',''),sep=' ')
res[20,] <- c('', mylink2, qarr[3,1])
mylink2 <- paste(mylink1,hyperlink('method_4.htm','(Empirical Distribution Function - Averaging)',''),sep=' ')
res[21,] <- c('', mylink2, qarr[4,1])
mylink2 <- paste(mylink1,hyperlink('method_5.htm','(Empirical Distribution Function - Interpolation)',''),sep=' ')
res[22,] <- c('', mylink2, qarr[5,1])
mylink2 <- paste(mylink1,hyperlink('method_6.htm','(Closest Observation)',''),sep=' ')
res[23,] <- c('', mylink2, qarr[6,1])
mylink2 <- paste(mylink1,hyperlink('method_7.htm','(True Basic - Statistics Graphics Toolkit)',''),sep=' ')
res[24,] <- c('', mylink2, qarr[7,1])
mylink2 <- paste(mylink1,hyperlink('method_8.htm','(MS Excel (old versions))',''),sep=' ')
res[25,] <- c('', mylink2, qarr[8,1])
mylink1 <- hyperlink('deviation.htm','Semi Interquartile Difference','')
mylink2 <- paste(mylink1,hyperlink('method_1.htm','(Weighted Average at Xnp)',''),sep=' ')
res[26,] <- c('', mylink2, qarr[1,2])
mylink2 <- paste(mylink1,hyperlink('method_2.htm','(Weighted Average at X(n+1)p)',''),sep=' ')
res[27,] <- c('', mylink2, qarr[2,2])
mylink2 <- paste(mylink1,hyperlink('method_3.htm','(Empirical Distribution Function)',''),sep=' ')
res[28,] <- c('', mylink2, qarr[3,2])
mylink2 <- paste(mylink1,hyperlink('method_4.htm','(Empirical Distribution Function - Averaging)',''),sep=' ')
res[29,] <- c('', mylink2, qarr[4,2])
mylink2 <- paste(mylink1,hyperlink('method_5.htm','(Empirical Distribution Function - Interpolation)',''),sep=' ')
res[30,] <- c('', mylink2, qarr[5,2])
mylink2 <- paste(mylink1,hyperlink('method_6.htm','(Closest Observation)',''),sep=' ')
res[31,] <- c('', mylink2, qarr[6,2])
mylink2 <- paste(mylink1,hyperlink('method_7.htm','(True Basic - Statistics Graphics Toolkit)',''),sep=' ')
res[32,] <- c('', mylink2, qarr[7,2])
mylink2 <- paste(mylink1,hyperlink('method_8.htm','(MS Excel (old versions))',''),sep=' ')
res[33,] <- c('', mylink2, qarr[8,2])
mylink1 <- hyperlink('variation1.htm','Coefficient of Quartile Variation','')
mylink2 <- paste(mylink1,hyperlink('method_1.htm','(Weighted Average at Xnp)',''),sep=' ')
res[34,] <- c('', mylink2, qarr[1,3])
mylink2 <- paste(mylink1,hyperlink('method_2.htm','(Weighted Average at X(n+1)p)',''),sep=' ')
res[35,] <- c('', mylink2, qarr[2,3])
mylink2 <- paste(mylink1,hyperlink('method_3.htm','(Empirical Distribution Function)',''),sep=' ')
res[36,] <- c('', mylink2, qarr[3,3])
mylink2 <- paste(mylink1,hyperlink('method_4.htm','(Empirical Distribution Function - Averaging)',''),sep=' ')
res[37,] <- c('', mylink2, qarr[4,3])
mylink2 <- paste(mylink1,hyperlink('method_5.htm','(Empirical Distribution Function - Interpolation)',''),sep=' ')
res[38,] <- c('', mylink2, qarr[5,3])
mylink2 <- paste(mylink1,hyperlink('method_6.htm','(Closest Observation)',''),sep=' ')
res[39,] <- c('', mylink2, qarr[6,3])
mylink2 <- paste(mylink1,hyperlink('method_7.htm','(True Basic - Statistics Graphics Toolkit)',''),sep=' ')
res[40,] <- c('', mylink2, qarr[7,3])
mylink2 <- paste(mylink1,hyperlink('method_8.htm','(MS Excel (old versions))',''),sep=' ')
res[41,] <- c('', mylink2, qarr[8,3])
res[42,] <- c('Number of all Pairs of Observations', 'pair_numbers.htm', lx*(lx-1)/2)
res[43,] <- c('Squared Differences between all Pairs of Observations', 'squared_differences.htm', sdpo)
res[44,] <- c('Mean Absolute Differences between all Pairs of Observations', 'mean_abs_differences.htm', adpo)
res[45,] <- c('Gini Mean Difference', 'gini_mean_difference.htm', gmd)
res[46,] <- c('Leik Measure of Dispersion', 'leiks_d.htm', bigd)
res[47,] <- c('Index of Diversity', 'diversity.htm', iod)
res[48,] <- c('Index of Qualitative Variation', 'qualitative_variation.htm', iod*lx/(lx-1))
res[49,] <- c('Coefficient of Dispersion', 'dispersion.htm', sum(axmm)/lx/medx)
res[50,] <- c('Observations', '', lx)
res
(arm <- mean(x))
sqrtn <- sqrt(length(x))
(armse <- sd(x) / sqrtn)
(armose <- arm / armse)
(geo <- geomean(x))
(har <- harmean(x))
(qua <- quamean(x))
(win <- winmean(x))
(tri <- trimean(x))
(midr <- midrange(x))
midm <- array(NA,dim=8)
for (j in 1:8) midm[j] <- midmean(x,j)
midm
bitmap(file='test1.png')
lb <- win[,1] - 2*win[,2]
ub <- win[,1] + 2*win[,2]
if ((ylimmin == '') | (ylimmax == '')) plot(win[,1],type='b',main='Robustness of Central Tendency', xlab='j', pch=19, ylab='Winsorized Mean(j/n)', ylim=c(min(lb),max(ub))) else plot(win[,1],type='l',main='Robustness of Central Tendency', xlab='j', pch=19, ylab='Winsorized Mean(j/n)', ylim=c(ylimmin,ylimmax))
lines(ub,lty=3)
lines(lb,lty=3)
grid()
dev.off()
bitmap(file='test2.png')
lb <- tri[,1] - 2*tri[,2]
ub <- tri[,1] + 2*tri[,2]
if ((ylimmin == '') | (ylimmax == '')) plot(tri[,1],type='b',main='Robustness of Central Tendency', xlab='j', pch=19, ylab='Trimmed Mean(j/n)', ylim=c(min(lb),max(ub))) else plot(tri[,1],type='l',main='Robustness of Central Tendency', xlab='j', pch=19, ylab='Trimmed Mean(j/n)', ylim=c(ylimmin,ylimmax))
lines(ub,lty=3)
lines(lb,lty=3)
grid()
dev.off()
a<-table.start()
a<-table.row.start(a)
a<-table.element(a,'Central Tendency - Ungrouped Data',4,TRUE)
a<-table.row.end(a)
a<-table.row.start(a)
a<-table.element(a,'Measure',header=TRUE)
a<-table.element(a,'Value',header=TRUE)
a<-table.element(a,'S.E.',header=TRUE)
a<-table.element(a,'Value/S.E.',header=TRUE)
a<-table.row.end(a)
a<-table.row.start(a)
a<-table.element(a,hyperlink('arithmetic_mean.htm', 'Arithmetic Mean', 'click to view the definition of the Arithmetic Mean'),header=TRUE)
a<-table.element(a,arm)
a<-table.element(a,hyperlink('arithmetic_mean_standard_error.htm', armse, 'click to view the definition of the Standard Error of the Arithmetic Mean'))
a<-table.element(a,armose)
a<-table.row.end(a)
a<-table.row.start(a)
a<-table.element(a,hyperlink('geometric_mean.htm', 'Geometric Mean', 'click to view the definition of the Geometric Mean'),header=TRUE)
a<-table.element(a,geo)
a<-table.element(a,'')
a<-table.row.end(a)
a<-table.row.start(a)
a<-table.element(a,hyperlink('harmonic_mean.htm', 'Harmonic Mean', 'click to view the definition of the Harmonic Mean'),header=TRUE)
a<-table.element(a,har)
a<-table.element(a,'')
a<-table.row.end(a)
a<-table.row.start(a)
a<-table.element(a,hyperlink('quadratic_mean.htm', 'Quadratic Mean', 'click to view the definition of the Quadratic Mean'),header=TRUE)
a<-table.element(a,qua)
a<-table.element(a,'')
a<-table.row.end(a)
for (j in 1:length(win[,1])) {
a<-table.row.start(a)
mylabel <- paste('Winsorized Mean (',j)
mylabel <- paste(mylabel,'/')
mylabel <- paste(mylabel,length(win[,1]))
mylabel <- paste(mylabel,')')
a<-table.element(a,hyperlink('winsorized_mean.htm', mylabel, 'click to view the definition of the Winsorized Mean'),header=TRUE)
a<-table.element(a,win[j,1])
a<-table.element(a,win[j,2])
a<-table.element(a,win[j,1]/win[j,2])
a<-table.row.end(a)
}
for (j in 1:length(tri[,1])) {
a<-table.row.start(a)
mylabel <- paste('Trimmed Mean (',j)
mylabel <- paste(mylabel,'/')
mylabel <- paste(mylabel,length(tri[,1]))
mylabel <- paste(mylabel,')')
a<-table.element(a,hyperlink('arithmetic_mean.htm', mylabel, 'click to view the definition of the Trimmed Mean'),header=TRUE)
a<-table.element(a,tri[j,1])
a<-table.element(a,tri[j,2])
a<-table.element(a,tri[j,1]/tri[j,2])
a<-table.row.end(a)
}
a<-table.row.start(a)
a<-table.element(a,hyperlink('median_1.htm', 'Median', 'click to view the definition of the Median'),header=TRUE)
a<-table.element(a,median(x))
a<-table.element(a,'')
a<-table.row.end(a)
a<-table.row.start(a)
a<-table.element(a,hyperlink('midrange.htm', 'Midrange', 'click to view the definition of the Midrange'),header=TRUE)
a<-table.element(a,midr)
a<-table.element(a,'')
a<-table.row.end(a)
a<-table.row.start(a)
mymid <- hyperlink('midmean.htm', 'Midmean', 'click to view the definition of the Midmean')
mylabel <- paste(mymid,hyperlink('method_1.htm','Weighted Average at Xnp',''),sep=' - ')
a<-table.element(a,mylabel,header=TRUE)
a<-table.element(a,midm[1])
a<-table.element(a,'')
a<-table.row.end(a)
a<-table.row.start(a)
mymid <- hyperlink('midmean.htm', 'Midmean', 'click to view the definition of the Midmean')
mylabel <- paste(mymid,hyperlink('method_2.htm','Weighted Average at X(n+1)p',''),sep=' - ')
a<-table.element(a,mylabel,header=TRUE)
a<-table.element(a,midm[2])
a<-table.element(a,'')
a<-table.row.end(a)
a<-table.row.start(a)
mymid <- hyperlink('midmean.htm', 'Midmean', 'click to view the definition of the Midmean')
mylabel <- paste(mymid,hyperlink('method_3.htm','Empirical Distribution Function',''),sep=' - ')
a<-table.element(a,mylabel,header=TRUE)
a<-table.element(a,midm[3])
a<-table.element(a,'')
a<-table.row.end(a)
a<-table.row.start(a)
mymid <- hyperlink('midmean.htm', 'Midmean', 'click to view the definition of the Midmean')
mylabel <- paste(mymid,hyperlink('method_4.htm','Empirical Distribution Function - Averaging',''),sep=' - ')
a<-table.element(a,mylabel,header=TRUE)
a<-table.element(a,midm[4])
a<-table.element(a,'')
a<-table.row.end(a)
a<-table.row.start(a)
mymid <- hyperlink('midmean.htm', 'Midmean', 'click to view the definition of the Midmean')
mylabel <- paste(mymid,hyperlink('method_5.htm','Empirical Distribution Function - Interpolation',''),sep=' - ')
a<-table.element(a,mylabel,header=TRUE)
a<-table.element(a,midm[5])
a<-table.element(a,'')
a<-table.row.end(a)
a<-table.row.start(a)
mymid <- hyperlink('midmean.htm', 'Midmean', 'click to view the definition of the Midmean')
mylabel <- paste(mymid,hyperlink('method_6.htm','Closest Observation',''),sep=' - ')
a<-table.element(a,mylabel,header=TRUE)
a<-table.element(a,midm[6])
a<-table.element(a,'')
a<-table.row.end(a)
a<-table.row.start(a)
mymid <- hyperlink('midmean.htm', 'Midmean', 'click to view the definition of the Midmean')
mylabel <- paste(mymid,hyperlink('method_7.htm','True Basic - Statistics Graphics Toolkit',''),sep=' - ')
a<-table.element(a,mylabel,header=TRUE)
a<-table.element(a,midm[7])
a<-table.element(a,'')
a<-table.row.end(a)
a<-table.row.start(a)
mymid <- hyperlink('midmean.htm', 'Midmean', 'click to view the definition of the Midmean')
mylabel <- paste(mymid,hyperlink('method_8.htm','MS Excel (old versions)',''),sep=' - ')
a<-table.element(a,mylabel,header=TRUE)
a<-table.element(a,midm[8])
a<-table.element(a,'')
a<-table.row.end(a)
a<-table.row.start(a)
a<-table.element(a,'Number of observations',header=TRUE)
a<-table.element(a,length(x))
a<-table.element(a,'')
a<-table.row.end(a)
a<-table.end(a)
table.save(a,file='mytable.tab')
a<-table.start()
a<-table.row.start(a)
a<-table.element(a,'Variability - Ungrouped Data',2,TRUE)
a<-table.row.end(a)
for (i in 1:num) {
a<-table.row.start(a)
if (res[i,1] != '') {
a<-table.element(a,hyperlink(res[i,2],res[i,1],''),header=TRUE)
} else {
a<-table.element(a,res[i,2],header=TRUE)
}
a<-table.element(a,res[i,3])
a<-table.row.end(a)
}
a<-table.end(a)
table.save(a,file='mytable1.tab')
lx <- length(x)
qval <- array(NA,dim=c(99,8))
mystep <- 25
mystart <- 25
if (lx>10){
mystep=10
mystart=10
}
if (lx>20){
mystep=5
mystart=5
}
if (lx>50){
mystep=2
mystart=2
}
if (lx>=100){
mystep=1
mystart=1
}
for (perc in seq(mystart,99,mystep)) {
qval[perc,1] <- q1(x,lx,perc/100,i,f)
qval[perc,2] <- q2(x,lx,perc/100,i,f)
qval[perc,3] <- q3(x,lx,perc/100,i,f)
qval[perc,4] <- q4(x,lx,perc/100,i,f)
qval[perc,5] <- q5(x,lx,perc/100,i,f)
qval[perc,6] <- q6(x,lx,perc/100,i,f)
qval[perc,7] <- q7(x,lx,perc/100,i,f)
qval[perc,8] <- q8(x,lx,perc/100,i,f)
}
bitmap(file='test3.png')
myqqnorm <- qqnorm(x,col=2)
qqline(x)
grid()
dev.off()
a<-table.start()
a<-table.row.start(a)
a<-table.element(a,'Percentiles - Ungrouped Data',9,TRUE)
a<-table.row.end(a)
a<-table.row.start(a)
a<-table.element(a,'p',1,TRUE)
a<-table.element(a,hyperlink('method_1.htm', 'Weighted Average at Xnp',''),1,TRUE)
a<-table.element(a,hyperlink('method_2.htm','Weighted Average at X(n+1)p',''),1,TRUE)
a<-table.element(a,hyperlink('method_3.htm','Empirical Distribution Function',''),1,TRUE)
a<-table.element(a,hyperlink('method_4.htm','Empirical Distribution Function - Averaging',''),1,TRUE)
a<-table.element(a,hyperlink('method_5.htm','Empirical Distribution Function - Interpolation',''),1,TRUE)
a<-table.element(a,hyperlink('method_6.htm','Closest Observation',''),1,TRUE)
a<-table.element(a,hyperlink('method_7.htm','True Basic - Statistics Graphics Toolkit',''),1,TRUE)
a<-table.element(a,hyperlink('method_8.htm','MS Excel (old versions)',''),1,TRUE)
a<-table.row.end(a)
for (perc in seq(mystart,99,mystep)) {
a<-table.row.start(a)
a<-table.element(a,round(perc/100,2),1,TRUE)
for (j in 1:8) {
a<-table.element(a,round(qval[perc,j],6))
}
a<-table.row.end(a)
}
a<-table.end(a)
table.save(a,file='mytable2.tab')
bitmap(file='histogram1.png')
myhist<-hist(x)
dev.off()
myhist
n <- length(x)
a<-table.start()
a<-table.row.start(a)
a<-table.element(a,hyperlink('histogram.htm','Frequency Table (Histogram)',''),6,TRUE)
a<-table.row.end(a)
a<-table.row.start(a)
a<-table.element(a,'Bins',header=TRUE)
a<-table.element(a,'Midpoint',header=TRUE)
a<-table.element(a,'Abs. Frequency',header=TRUE)
a<-table.element(a,'Rel. Frequency',header=TRUE)
a<-table.element(a,'Cumul. Rel. Freq.',header=TRUE)
a<-table.element(a,'Density',header=TRUE)
a<-table.row.end(a)
crf <- 0
mybracket <- '['
mynumrows <- (length(myhist$breaks)-1)
for (i in 1:mynumrows) {
a<-table.row.start(a)
if (i == 1)
dum <- paste('[',myhist$breaks[i],sep='')
else
dum <- paste(mybracket,myhist$breaks[i],sep='')
dum <- paste(dum,myhist$breaks[i+1],sep=',')
if (i==mynumrows)
dum <- paste(dum,']',sep='')
else
dum <- paste(dum,mybracket,sep='')
a<-table.element(a,dum,header=TRUE)
a<-table.element(a,myhist$mids[i])
a<-table.element(a,myhist$counts[i])
rf <- myhist$counts[i]/n
crf <- crf + rf
a<-table.element(a,round(rf,6))
a<-table.element(a,round(crf,6))
a<-table.element(a,round(myhist$density[i],6))
a<-table.row.end(a)
}
a<-table.end(a)
table.save(a,file='mytable5.tab')
bitmap(file='density1.png')
mydensity1<-density(x,kernel='gaussian',na.rm=TRUE)
plot(mydensity1,main='Gaussian Kernel')
grid()
dev.off()
mydensity1
a<-table.start()
a<-table.row.start(a)
a<-table.element(a,'Properties of Density Trace',2,TRUE)
a<-table.row.end(a)
a<-table.row.start(a)
a<-table.element(a,'Bandwidth',header=TRUE)
a<-table.element(a,mydensity1$bw)
a<-table.row.end(a)
a<-table.row.start(a)
a<-table.element(a,'#Observations',header=TRUE)
a<-table.element(a,mydensity1$n)
a<-table.row.end(a)
a<-table.end(a)
table.save(a,file='mytable4.tab')