Free Statistics

of Irreproducible Research!

Author's title

Author*The author of this computation has been verified*
R Software Modulerwasp_edabi.wasp
Title produced by softwareBivariate Explorative Data Analysis
Date of computationMon, 26 Oct 2009 13:27:12 -0600
Cite this page as followsStatistical Computations at FreeStatistics.org, Office for Research Development and Education, URL https://freestatistics.org/blog/index.php?v=date/2009/Oct/26/t1256585353u1e25ncjv70kkxy.htm/, Retrieved Thu, 02 May 2024 16:01:30 +0000
Statistical Computations at FreeStatistics.org, Office for Research Development and Education, URL https://freestatistics.org/blog/index.php?pk=50715, Retrieved Thu, 02 May 2024 16:01:30 +0000
QR Codes:

Original text written by user:
IsPrivate?No (this computation is public)
User-defined keywords
Estimated Impact111
Family? (F = Feedback message, R = changed R code, M = changed R Module, P = changed Parameters, D = changed Data)
-     [Bivariate Data Series] [Bivariate dataset] [2008-01-05 23:51:08] [74be16979710d4c4e7c6647856088456]
F RMPD  [Univariate Explorative Data Analysis] [Colombia Coffee] [2008-01-07 14:21:11] [74be16979710d4c4e7c6647856088456]
F RMPD    [Univariate Data Series] [] [2009-10-14 08:30:28] [74be16979710d4c4e7c6647856088456]
- R  D      [Univariate Data Series] [] [2009-10-20 15:18:21] [ba905ddf7cdf9ecb063c35348c4dab2e]
- RMPD          [Bivariate Explorative Data Analysis] [] [2009-10-26 19:27:12] [244731fa3e7e6c85774b8c0902c58f85] [Current]
Feedback Forum

Post a new message
Dataseries X:
8,9
8,2
7,6
7,7
8,1
8,3
8,3
7,9
7,8
8
8,5
8,6
8,5
8
7,8
8
8,2
8,3
8,2
8,1
8
7,8
7,8
7,7
7,6
7,6
7,6
7,8
8
8
7,9
7,7
7,4
6,9
6,7
6,5
6,4
6,7
6,8
6,9
6,9
6,7
6,4
6,2
5,9
6,1
6,7
6,8
6,6
6,4
6,4
6,7
7,1
7,1
6,9
6,4
6
6
Dataseries Y:
3071
3388
2652
3190
2885
3295
3818
3226
3953
3810
2877
3515
3708
3450
3360
4110
4385
3729
4309
3506
3690
3911
2952
3324
3417
3498
2770
2907
3179
3014
3483
3016
2617
3534
2849
3129
2578
3626
2813
2591
2890
3369
2926
3016
2878
3198
2560
2573
3121
2658
2869
3076
2168
2341
2570
2626
2490
2756


Summary of computational transaction
Raw Inputview raw input (R code)
Raw Outputview raw output of R engine
Computing time3 seconds
R Server'George Udny Yule' @ 72.249.76.132

\begin{tabular}{lllllllll}
\hline
Summary of computational transaction \tabularnewline
Raw Input & view raw input (R code)  \tabularnewline
Raw Output & view raw output of R engine  \tabularnewline
Computing time & 3 seconds \tabularnewline
R Server & 'George Udny Yule' @ 72.249.76.132 \tabularnewline
\hline
\end{tabular}
%Source: https://freestatistics.org/blog/index.php?pk=50715&T=0

[TABLE]
[ROW][C]Summary of computational transaction[/C][/ROW]
[ROW][C]Raw Input[/C][C]view raw input (R code) [/C][/ROW]
[ROW][C]Raw Output[/C][C]view raw output of R engine [/C][/ROW]
[ROW][C]Computing time[/C][C]3 seconds[/C][/ROW]
[ROW][C]R Server[/C][C]'George Udny Yule' @ 72.249.76.132[/C][/ROW]
[/TABLE]
Source: https://freestatistics.org/blog/index.php?pk=50715&T=0

Globally Unique Identifier (entire table): ba.freestatistics.org/blog/index.php?pk=50715&T=0

As an alternative you can also use a QR Code:  

The GUIDs for individual cells are displayed in the table below:

Summary of computational transaction
Raw Inputview raw input (R code)
Raw Outputview raw output of R engine
Computing time3 seconds
R Server'George Udny Yule' @ 72.249.76.132


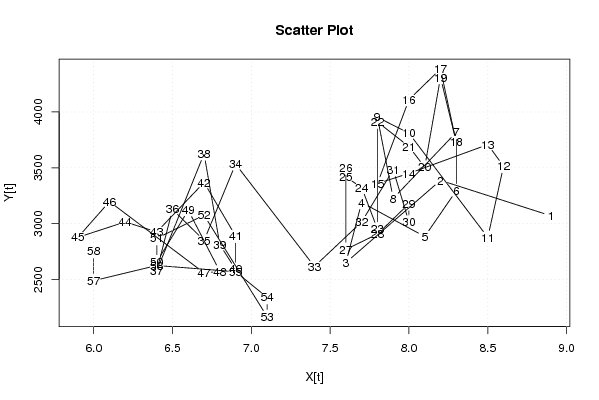
Model: Y[t] = c + b X[t] + e[t]
c639.813592828666
b341.300657827464

\begin{tabular}{lllllllll}
\hline
Model: Y[t] = c + b X[t] + e[t] \tabularnewline
c & 639.813592828666 \tabularnewline
b & 341.300657827464 \tabularnewline
\hline
\end{tabular}
%Source: https://freestatistics.org/blog/index.php?pk=50715&T=1

[TABLE]
[ROW][C]Model: Y[t] = c + b X[t] + e[t][/C][/ROW]
[ROW][C]c[/C][C]639.813592828666[/C][/ROW]
[ROW][C]b[/C][C]341.300657827464[/C][/ROW]
[/TABLE]
Source: https://freestatistics.org/blog/index.php?pk=50715&T=1

Globally Unique Identifier (entire table): ba.freestatistics.org/blog/index.php?pk=50715&T=1

As an alternative you can also use a QR Code:  

The GUIDs for individual cells are displayed in the table below:

Model: Y[t] = c + b X[t] + e[t]
c639.813592828666
b341.300657827464


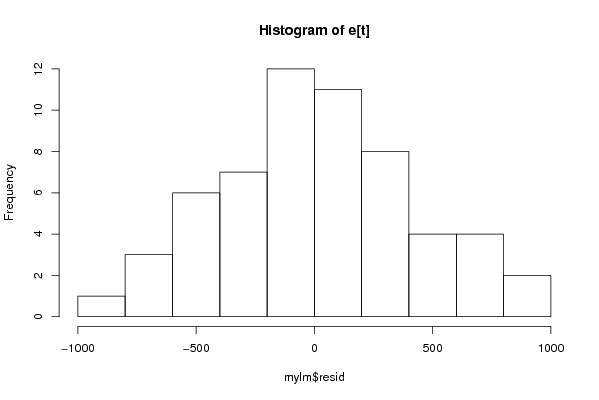
Descriptive Statistics about e[t]
# observations58
minimum-895.04826340366
Q1-325.426207437199
median-2.80839496915351
mean6.0099195734962e-15
Q3259.189483281638
maximum946.52101298613

\begin{tabular}{lllllllll}
\hline
Descriptive Statistics about e[t] \tabularnewline
# observations & 58 \tabularnewline
minimum & -895.04826340366 \tabularnewline
Q1 & -325.426207437199 \tabularnewline
median & -2.80839496915351 \tabularnewline
mean & 6.0099195734962e-15 \tabularnewline
Q3 & 259.189483281638 \tabularnewline
maximum & 946.52101298613 \tabularnewline
\hline
\end{tabular}
%Source: https://freestatistics.org/blog/index.php?pk=50715&T=2

[TABLE]
[ROW][C]Descriptive Statistics about e[t][/C][/ROW]
[ROW][C]# observations[/C][C]58[/C][/ROW]
[ROW][C]minimum[/C][C]-895.04826340366[/C][/ROW]
[ROW][C]Q1[/C][C]-325.426207437199[/C][/ROW]
[ROW][C]median[/C][C]-2.80839496915351[/C][/ROW]
[ROW][C]mean[/C][C]6.0099195734962e-15[/C][/ROW]
[ROW][C]Q3[/C][C]259.189483281638[/C][/ROW]
[ROW][C]maximum[/C][C]946.52101298613[/C][/ROW]
[/TABLE]
Source: https://freestatistics.org/blog/index.php?pk=50715&T=2

Globally Unique Identifier (entire table): ba.freestatistics.org/blog/index.php?pk=50715&T=2

As an alternative you can also use a QR Code:  

The GUIDs for individual cells are displayed in the table below:

Descriptive Statistics about e[t]
# observations58
minimum-895.04826340366
Q1-325.426207437199
median-2.80839496915351
mean6.0099195734962e-15
Q3259.189483281638
maximum946.52101298613


Parameters (Session):
par1 = 0 ; par2 = 36 ;
Parameters (R input):
par1 = 0 ; par2 = 36 ;
R code (references can be found in the software module):
par1 <- as.numeric(par1)
par2 <- as.numeric(par2)
x <- as.ts(x)
y <- as.ts(y)
mylm <- lm(y~x)
cbind(mylm$resid)
library(lattice)
bitmap(file='pic1.png')
plot(y,type='l',main='Run Sequence Plot of Y[t]',xlab='time or index',ylab='value')
grid()
dev.off()
bitmap(file='pic1a.png')
plot(x,type='l',main='Run Sequence Plot of X[t]',xlab='time or index',ylab='value')
grid()
dev.off()
bitmap(file='pic1b.png')
plot(x,y,main='Scatter Plot',xlab='X[t]',ylab='Y[t]')
grid()
dev.off()
bitmap(file='pic1c.png')
plot(mylm$resid,type='l',main='Run Sequence Plot of e[t]',xlab='time or index',ylab='value')
grid()
dev.off()
bitmap(file='pic2.png')
hist(mylm$resid,main='Histogram of e[t]')
dev.off()
bitmap(file='pic3.png')
if (par1 > 0)
{
densityplot(~mylm$resid,col='black',main=paste('Density Plot of e[t] bw = ',par1),bw=par1)
} else {
densityplot(~mylm$resid,col='black',main='Density Plot of e[t]')
}
dev.off()
bitmap(file='pic4.png')
qqnorm(mylm$resid,main='QQ plot of e[t]')
qqline(mylm$resid)
grid()
dev.off()
if (par2 > 0)
{
bitmap(file='pic5.png')
acf(mylm$resid,lag.max=par2,main='Residual Autocorrelation Function')
grid()
dev.off()
}
summary(x)
load(file='createtable')
a<-table.start()
a<-table.row.start(a)
a<-table.element(a,'Model: Y[t] = c + b X[t] + e[t]',2,TRUE)
a<-table.row.end(a)
a<-table.row.start(a)
a<-table.element(a,'c',1,TRUE)
a<-table.element(a,mylm$coeff[[1]])
a<-table.row.end(a)
a<-table.row.start(a)
a<-table.element(a,'b',1,TRUE)
a<-table.element(a,mylm$coeff[[2]])
a<-table.row.end(a)
a<-table.end(a)
table.save(a,file='mytable.tab')
a<-table.start()
a<-table.row.start(a)
a<-table.element(a,'Descriptive Statistics about e[t]',2,TRUE)
a<-table.row.end(a)
a<-table.row.start(a)
a<-table.element(a,'# observations',header=TRUE)
a<-table.element(a,length(mylm$resid))
a<-table.row.end(a)
a<-table.row.start(a)
a<-table.element(a,'minimum',header=TRUE)
a<-table.element(a,min(mylm$resid))
a<-table.row.end(a)
a<-table.row.start(a)
a<-table.element(a,'Q1',header=TRUE)
a<-table.element(a,quantile(mylm$resid,0.25))
a<-table.row.end(a)
a<-table.row.start(a)
a<-table.element(a,'median',header=TRUE)
a<-table.element(a,median(mylm$resid))
a<-table.row.end(a)
a<-table.row.start(a)
a<-table.element(a,'mean',header=TRUE)
a<-table.element(a,mean(mylm$resid))
a<-table.row.end(a)
a<-table.row.start(a)
a<-table.element(a,'Q3',header=TRUE)
a<-table.element(a,quantile(mylm$resid,0.75))
a<-table.row.end(a)
a<-table.row.start(a)
a<-table.element(a,'maximum',header=TRUE)
a<-table.element(a,max(mylm$resid))
a<-table.row.end(a)
a<-table.end(a)
table.save(a,file='mytable.tab')