Free Statistics

of Irreproducible Research!

Author's title

Author*The author of this computation has been verified*
R Software Modulerwasp_edauni.wasp
Title produced by softwareUnivariate Explorative Data Analysis
Date of computationMon, 26 Oct 2009 16:13:21 -0600
Cite this page as followsStatistical Computations at FreeStatistics.org, Office for Research Development and Education, URL https://freestatistics.org/blog/index.php?v=date/2009/Oct/26/t1256595310e5wy4vh6uhh6ji8.htm/, Retrieved Thu, 02 May 2024 15:49:02 +0000
Statistical Computations at FreeStatistics.org, Office for Research Development and Education, URL https://freestatistics.org/blog/index.php?pk=50777, Retrieved Thu, 02 May 2024 15:49:02 +0000
QR Codes:

Original text written by user:
IsPrivate?No (this computation is public)
User-defined keywords
Estimated Impact127
Family? (F = Feedback message, R = changed R code, M = changed R Module, P = changed Parameters, D = changed Data)
-       [Univariate Explorative Data Analysis] [Workshop3/part2] [2009-10-26 22:13:21] [f94f05f163a3ee3ab544c4fef41db0eb] [Current]
Feedback Forum

Post a new message
Dataseries X:
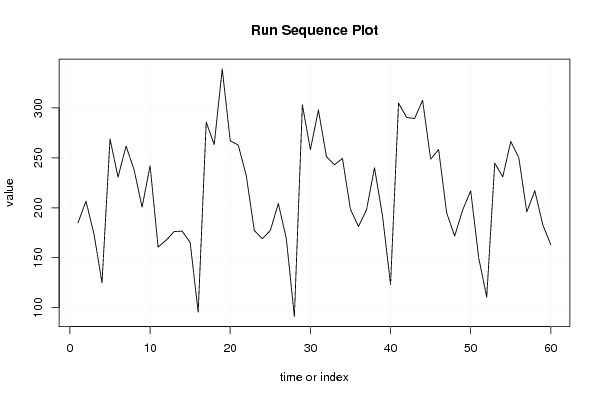
184.7926685
206.6394558
173.6951794
124.9389196
268.8268257
230.6534475
261.7017449
238.1689001
200.5998747
242.1128021
160.6903335
167.5762727
176.1747069
176.6360146
165.1975684
95.4837558
285.6785267
263.3523742
338.9254494
267.056626
262.6842209
232.1736574
177.3837436
168.9547582
177.2811374
204.2911355
169.003403
91.03012634
302.9984424
258.3033369
297.8717201
251.2778156
243.0051312
249.4242864
198.2907643
181.3488598
197.9453382
240.0542583
191.773132
123.2988094
304.6911197
290.4224537
289.2839934
307.5900597
248.6616599
258.2771896
194.9724983
171.6256633
197.8784957
216.9991327
149.8172022
110.6315486
244.6121311
230.9905072
266.2769526
250.2627305
195.8942041
217.04177
182.8736185
162.9476716


Summary of computational transaction
Raw Inputview raw input (R code)
Raw Outputview raw output of R engine
Computing time3 seconds
R Server'Sir Ronald Aylmer Fisher' @ 193.190.124.24

\begin{tabular}{lllllllll}
\hline
Summary of computational transaction \tabularnewline
Raw Input & view raw input (R code)  \tabularnewline
Raw Output & view raw output of R engine  \tabularnewline
Computing time & 3 seconds \tabularnewline
R Server & 'Sir Ronald Aylmer Fisher' @ 193.190.124.24 \tabularnewline
\hline
\end{tabular}
%Source: https://freestatistics.org/blog/index.php?pk=50777&T=0

[TABLE]
[ROW][C]Summary of computational transaction[/C][/ROW]
[ROW][C]Raw Input[/C][C]view raw input (R code) [/C][/ROW]
[ROW][C]Raw Output[/C][C]view raw output of R engine [/C][/ROW]
[ROW][C]Computing time[/C][C]3 seconds[/C][/ROW]
[ROW][C]R Server[/C][C]'Sir Ronald Aylmer Fisher' @ 193.190.124.24[/C][/ROW]
[/TABLE]
Source: https://freestatistics.org/blog/index.php?pk=50777&T=0

Globally Unique Identifier (entire table): ba.freestatistics.org/blog/index.php?pk=50777&T=0

As an alternative you can also use a QR Code:  

The GUIDs for individual cells are displayed in the table below:

Summary of computational transaction
Raw Inputview raw input (R code)
Raw Outputview raw output of R engine
Computing time3 seconds
R Server'Sir Ronald Aylmer Fisher' @ 193.190.124.24


Descriptive Statistics
# observations60
minimum91.03012634
Q1176.520687675
median211.81929425
mean215.650768764
Q3258.283726425
maximum338.9254494

\begin{tabular}{lllllllll}
\hline
Descriptive Statistics \tabularnewline
# observations & 60 \tabularnewline
minimum & 91.03012634 \tabularnewline
Q1 & 176.520687675 \tabularnewline
median & 211.81929425 \tabularnewline
mean & 215.650768764 \tabularnewline
Q3 & 258.283726425 \tabularnewline
maximum & 338.9254494 \tabularnewline
\hline
\end{tabular}
%Source: https://freestatistics.org/blog/index.php?pk=50777&T=1

[TABLE]
[ROW][C]Descriptive Statistics[/C][/ROW]
[ROW][C]# observations[/C][C]60[/C][/ROW]
[ROW][C]minimum[/C][C]91.03012634[/C][/ROW]
[ROW][C]Q1[/C][C]176.520687675[/C][/ROW]
[ROW][C]median[/C][C]211.81929425[/C][/ROW]
[ROW][C]mean[/C][C]215.650768764[/C][/ROW]
[ROW][C]Q3[/C][C]258.283726425[/C][/ROW]
[ROW][C]maximum[/C][C]338.9254494[/C][/ROW]
[/TABLE]
Source: https://freestatistics.org/blog/index.php?pk=50777&T=1

Globally Unique Identifier (entire table): ba.freestatistics.org/blog/index.php?pk=50777&T=1

As an alternative you can also use a QR Code:  

The GUIDs for individual cells are displayed in the table below:

Descriptive Statistics
# observations60
minimum91.03012634
Q1176.520687675
median211.81929425
mean215.650768764
Q3258.283726425
maximum338.9254494


Parameters (Session):
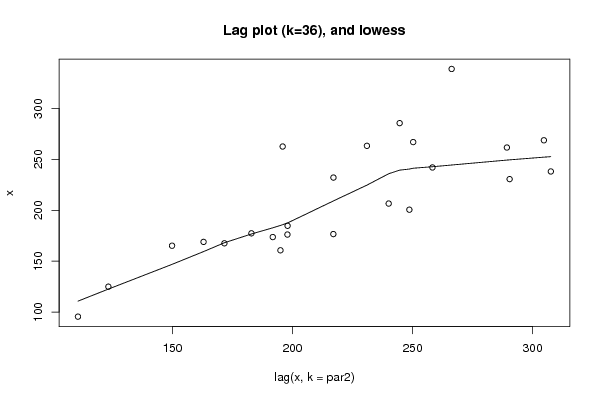
par1 = 0 ; par2 = 36 ;
Parameters (R input):
par1 = 0 ; par2 = 36 ;
R code (references can be found in the software module):
par1 <- as.numeric(par1)
par2 <- as.numeric(par2)
x <- as.ts(x)
library(lattice)
bitmap(file='pic1.png')
plot(x,type='l',main='Run Sequence Plot',xlab='time or index',ylab='value')
grid()
dev.off()
bitmap(file='pic2.png')
hist(x)
grid()
dev.off()
bitmap(file='pic3.png')
if (par1 > 0)
{
densityplot(~x,col='black',main=paste('Density Plot bw = ',par1),bw=par1)
} else {
densityplot(~x,col='black',main='Density Plot')
}
dev.off()
bitmap(file='pic4.png')
qqnorm(x)
qqline(x)
grid()
dev.off()
if (par2 > 0)
{
bitmap(file='lagplot1.png')
dum <- cbind(lag(x,k=1),x)
dum
dum1 <- dum[2:length(x),]
dum1
z <- as.data.frame(dum1)
z
plot(z,main='Lag plot (k=1), lowess, and regression line')
lines(lowess(z))
abline(lm(z))
dev.off()
if (par2 > 1) {
bitmap(file='lagplotpar2.png')
dum <- cbind(lag(x,k=par2),x)
dum
dum1 <- dum[(par2+1):length(x),]
dum1
z <- as.data.frame(dum1)
z
mylagtitle <- 'Lag plot (k='
mylagtitle <- paste(mylagtitle,par2,sep='')
mylagtitle <- paste(mylagtitle,'), and lowess',sep='')
plot(z,main=mylagtitle)
lines(lowess(z))
dev.off()
}
bitmap(file='pic5.png')
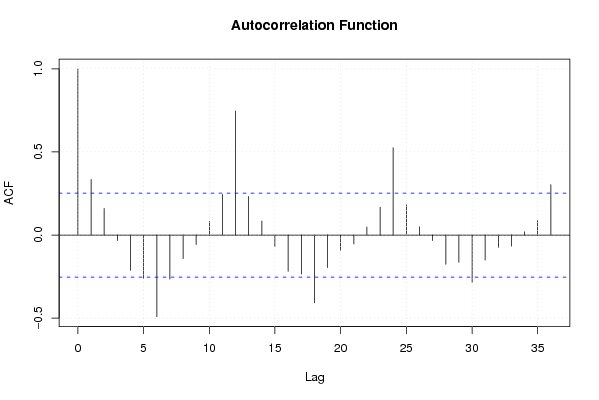
acf(x,lag.max=par2,main='Autocorrelation Function')
grid()
dev.off()
}
summary(x)
load(file='createtable')
a<-table.start()
a<-table.row.start(a)
a<-table.element(a,'Descriptive Statistics',2,TRUE)
a<-table.row.end(a)
a<-table.row.start(a)
a<-table.element(a,'# observations',header=TRUE)
a<-table.element(a,length(x))
a<-table.row.end(a)
a<-table.row.start(a)
a<-table.element(a,'minimum',header=TRUE)
a<-table.element(a,min(x))
a<-table.row.end(a)
a<-table.row.start(a)
a<-table.element(a,'Q1',header=TRUE)
a<-table.element(a,quantile(x,0.25))
a<-table.row.end(a)
a<-table.row.start(a)
a<-table.element(a,'median',header=TRUE)
a<-table.element(a,median(x))
a<-table.row.end(a)
a<-table.row.start(a)
a<-table.element(a,'mean',header=TRUE)
a<-table.element(a,mean(x))
a<-table.row.end(a)
a<-table.row.start(a)
a<-table.element(a,'Q3',header=TRUE)
a<-table.element(a,quantile(x,0.75))
a<-table.row.end(a)
a<-table.row.start(a)
a<-table.element(a,'maximum',header=TRUE)
a<-table.element(a,max(x))
a<-table.row.end(a)
a<-table.end(a)
table.save(a,file='mytable.tab')