Free Statistics

of Irreproducible Research!

Author's title

Author*The author of this computation has been verified*
R Software Modulerwasp_edabi.wasp
Title produced by softwareBivariate Explorative Data Analysis
Date of computationTue, 27 Oct 2009 14:12:09 -0600
Cite this page as followsStatistical Computations at FreeStatistics.org, Office for Research Development and Education, URL https://freestatistics.org/blog/index.php?v=date/2009/Oct/27/t12566744273b6ik21eq0x9phq.htm/, Retrieved Tue, 07 May 2024 06:28:28 +0000
Statistical Computations at FreeStatistics.org, Office for Research Development and Education, URL https://freestatistics.org/blog/index.php?pk=51214, Retrieved Tue, 07 May 2024 06:28:28 +0000
QR Codes:

Original text written by user:
IsPrivate?No (this computation is public)
User-defined keywordsx^2
Estimated Impact173
Family? (F = Feedback message, R = changed R code, M = changed R Module, P = changed Parameters, D = changed Data)
-     [Bivariate Data Series] [Bivariate dataset] [2008-01-05 23:51:08] [74be16979710d4c4e7c6647856088456]
- RMPD    [Bivariate Explorative Data Analysis] [X^2] [2009-10-27 20:12:09] [950726a732ba3ca782ecb1a5307d0f6f] [Current]
Feedback Forum

Post a new message
Dataseries X:
144057605.8
241041150.3
203002654.4
225021000.5
222946706
177787555.7
216419405.4
295747127.3
224556219
217102543.4
254013468.8
169731389.6
191457034.2
278139006.3
228916900
306390016
288317004
256400156.3
263987755.3
371263531.2
241274089
282350890.9
302624295.2
229686149.2
246251417.8
326297257.7
308655706
329578608.5
239240462.8
287509327.2
284057316
376220333
270852597.8
298753940.3
338387062.1
286919557.7
269429244.5
330272467.6
396794448.1
385093526.4
296807429.6
350824138.1
362487328.8
376876216.9
400544185
321026055.8
452425662.1
352166509.2
281930964.6
398425552.4
383638816.9
295118041
223948232
193724642.3
207397441.7
255827229.2
210862345.2
188966262.3
254593936
205411956.8
Dataseries Y:
13132.1
17665.9
16913
17318.8
16224.2
15469.6
16557.5
19414.8
17335
16525.2
18160.4
15553.8
15262.2
18581
17564.1
18948.6
17187.8
17564.8
17668.4
20811.7
17257.8
18984.2
20532.6
17082.3
16894.9
20274.9
20078.6
19900.9
17012.2
19642.9
19024
21691
18835.9
19873.4
21468.2
19406.8
18385.3
20739.3
22268.3
21569
17514.8
21124.7
21251
21393
22145.2
20310.5
23466.9
21264.6
18388.1
22635.4
22014.3
18422.7
16120.2
16037.7
16410.7
17749.8
16349.8
15662.3
17782.3
16398.9


Summary of computational transaction
Raw Inputview raw input (R code)
Raw Outputview raw output of R engine
Computing time5 seconds
R Server'Sir Ronald Aylmer Fisher' @ 193.190.124.24

\begin{tabular}{lllllllll}
\hline
Summary of computational transaction \tabularnewline
Raw Input & view raw input (R code)  \tabularnewline
Raw Output & view raw output of R engine  \tabularnewline
Computing time & 5 seconds \tabularnewline
R Server & 'Sir Ronald Aylmer Fisher' @ 193.190.124.24 \tabularnewline
\hline
\end{tabular}
%Source: https://freestatistics.org/blog/index.php?pk=51214&T=0

[TABLE]
[ROW][C]Summary of computational transaction[/C][/ROW]
[ROW][C]Raw Input[/C][C]view raw input (R code) [/C][/ROW]
[ROW][C]Raw Output[/C][C]view raw output of R engine [/C][/ROW]
[ROW][C]Computing time[/C][C]5 seconds[/C][/ROW]
[ROW][C]R Server[/C][C]'Sir Ronald Aylmer Fisher' @ 193.190.124.24[/C][/ROW]
[/TABLE]
Source: https://freestatistics.org/blog/index.php?pk=51214&T=0

Globally Unique Identifier (entire table): ba.freestatistics.org/blog/index.php?pk=51214&T=0

As an alternative you can also use a QR Code:  

The GUIDs for individual cells are displayed in the table below:

Summary of computational transaction
Raw Inputview raw input (R code)
Raw Outputview raw output of R engine
Computing time5 seconds
R Server'Sir Ronald Aylmer Fisher' @ 193.190.124.24


Model: Y[t] = c + b X[t] + e[t]
c9714.62010709397
b3.17694051031521e-05

\begin{tabular}{lllllllll}
\hline
Model: Y[t] = c + b X[t] + e[t] \tabularnewline
c & 9714.62010709397 \tabularnewline
b & 3.17694051031521e-05 \tabularnewline
\hline
\end{tabular}
%Source: https://freestatistics.org/blog/index.php?pk=51214&T=1

[TABLE]
[ROW][C]Model: Y[t] = c + b X[t] + e[t][/C][/ROW]
[ROW][C]c[/C][C]9714.62010709397[/C][/ROW]
[ROW][C]b[/C][C]3.17694051031521e-05[/C][/ROW]
[/TABLE]
Source: https://freestatistics.org/blog/index.php?pk=51214&T=1

Globally Unique Identifier (entire table): ba.freestatistics.org/blog/index.php?pk=51214&T=1

As an alternative you can also use a QR Code:  

The GUIDs for individual cells are displayed in the table below:

Model: Y[t] = c + b X[t] + e[t]
c9714.62010709397
b3.17694051031521e-05


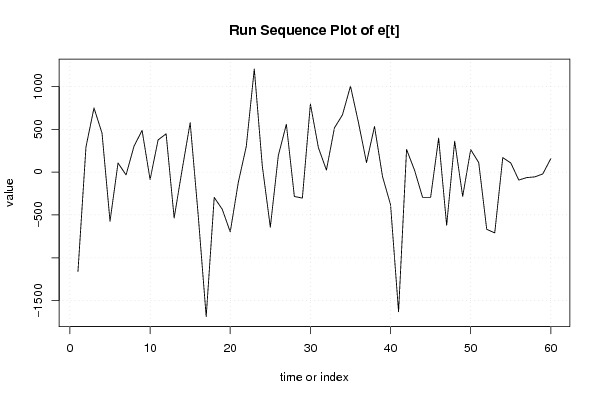
Descriptive Statistics about e[t]
# observations60
minimum-1686.47980529710
Q1-294.940121925171
median50.3783495806685
mean1.27943951729511e-14
Q3365.375324011693
maximum1203.78606464133

\begin{tabular}{lllllllll}
\hline
Descriptive Statistics about e[t] \tabularnewline
# observations & 60 \tabularnewline
minimum & -1686.47980529710 \tabularnewline
Q1 & -294.940121925171 \tabularnewline
median & 50.3783495806685 \tabularnewline
mean & 1.27943951729511e-14 \tabularnewline
Q3 & 365.375324011693 \tabularnewline
maximum & 1203.78606464133 \tabularnewline
\hline
\end{tabular}
%Source: https://freestatistics.org/blog/index.php?pk=51214&T=2

[TABLE]
[ROW][C]Descriptive Statistics about e[t][/C][/ROW]
[ROW][C]# observations[/C][C]60[/C][/ROW]
[ROW][C]minimum[/C][C]-1686.47980529710[/C][/ROW]
[ROW][C]Q1[/C][C]-294.940121925171[/C][/ROW]
[ROW][C]median[/C][C]50.3783495806685[/C][/ROW]
[ROW][C]mean[/C][C]1.27943951729511e-14[/C][/ROW]
[ROW][C]Q3[/C][C]365.375324011693[/C][/ROW]
[ROW][C]maximum[/C][C]1203.78606464133[/C][/ROW]
[/TABLE]
Source: https://freestatistics.org/blog/index.php?pk=51214&T=2

Globally Unique Identifier (entire table): ba.freestatistics.org/blog/index.php?pk=51214&T=2

As an alternative you can also use a QR Code:  

The GUIDs for individual cells are displayed in the table below:

Descriptive Statistics about e[t]
# observations60
minimum-1686.47980529710
Q1-294.940121925171
median50.3783495806685
mean1.27943951729511e-14
Q3365.375324011693
maximum1203.78606464133


Parameters (Session):
par1 = 0 ; par2 = 36 ;
Parameters (R input):
par1 = 0 ; par2 = 36 ;
R code (references can be found in the software module):
par1 <- as.numeric(par1)
par2 <- as.numeric(par2)
x <- as.ts(x)
y <- as.ts(y)
mylm <- lm(y~x)
cbind(mylm$resid)
library(lattice)
bitmap(file='pic1.png')
plot(y,type='l',main='Run Sequence Plot of Y[t]',xlab='time or index',ylab='value')
grid()
dev.off()
bitmap(file='pic1a.png')
plot(x,type='l',main='Run Sequence Plot of X[t]',xlab='time or index',ylab='value')
grid()
dev.off()
bitmap(file='pic1b.png')
plot(x,y,main='Scatter Plot',xlab='X[t]',ylab='Y[t]')
grid()
dev.off()
bitmap(file='pic1c.png')
plot(mylm$resid,type='l',main='Run Sequence Plot of e[t]',xlab='time or index',ylab='value')
grid()
dev.off()
bitmap(file='pic2.png')
hist(mylm$resid,main='Histogram of e[t]')
dev.off()
bitmap(file='pic3.png')
if (par1 > 0)
{
densityplot(~mylm$resid,col='black',main=paste('Density Plot of e[t] bw = ',par1),bw=par1)
} else {
densityplot(~mylm$resid,col='black',main='Density Plot of e[t]')
}
dev.off()
bitmap(file='pic4.png')
qqnorm(mylm$resid,main='QQ plot of e[t]')
qqline(mylm$resid)
grid()
dev.off()
if (par2 > 0)
{
bitmap(file='pic5.png')
acf(mylm$resid,lag.max=par2,main='Residual Autocorrelation Function')
grid()
dev.off()
}
summary(x)
load(file='createtable')
a<-table.start()
a<-table.row.start(a)
a<-table.element(a,'Model: Y[t] = c + b X[t] + e[t]',2,TRUE)
a<-table.row.end(a)
a<-table.row.start(a)
a<-table.element(a,'c',1,TRUE)
a<-table.element(a,mylm$coeff[[1]])
a<-table.row.end(a)
a<-table.row.start(a)
a<-table.element(a,'b',1,TRUE)
a<-table.element(a,mylm$coeff[[2]])
a<-table.row.end(a)
a<-table.end(a)
table.save(a,file='mytable.tab')
a<-table.start()
a<-table.row.start(a)
a<-table.element(a,'Descriptive Statistics about e[t]',2,TRUE)
a<-table.row.end(a)
a<-table.row.start(a)
a<-table.element(a,'# observations',header=TRUE)
a<-table.element(a,length(mylm$resid))
a<-table.row.end(a)
a<-table.row.start(a)
a<-table.element(a,'minimum',header=TRUE)
a<-table.element(a,min(mylm$resid))
a<-table.row.end(a)
a<-table.row.start(a)
a<-table.element(a,'Q1',header=TRUE)
a<-table.element(a,quantile(mylm$resid,0.25))
a<-table.row.end(a)
a<-table.row.start(a)
a<-table.element(a,'median',header=TRUE)
a<-table.element(a,median(mylm$resid))
a<-table.row.end(a)
a<-table.row.start(a)
a<-table.element(a,'mean',header=TRUE)
a<-table.element(a,mean(mylm$resid))
a<-table.row.end(a)
a<-table.row.start(a)
a<-table.element(a,'Q3',header=TRUE)
a<-table.element(a,quantile(mylm$resid,0.75))
a<-table.row.end(a)
a<-table.row.start(a)
a<-table.element(a,'maximum',header=TRUE)
a<-table.element(a,max(mylm$resid))
a<-table.row.end(a)
a<-table.end(a)
table.save(a,file='mytable.tab')