Free Statistics
of Irreproducible Research!
Description of Statistical Computation | |||||||||||||||||||||||||||||||||||||||||||||
|---|---|---|---|---|---|---|---|---|---|---|---|---|---|---|---|---|---|---|---|---|---|---|---|---|---|---|---|---|---|---|---|---|---|---|---|---|---|---|---|---|---|---|---|---|---|
| Author's title | |||||||||||||||||||||||||||||||||||||||||||||
| Author | *The author of this computation has been verified* | ||||||||||||||||||||||||||||||||||||||||||||
| R Software Module | rwasp_bidensity.wasp | ||||||||||||||||||||||||||||||||||||||||||||
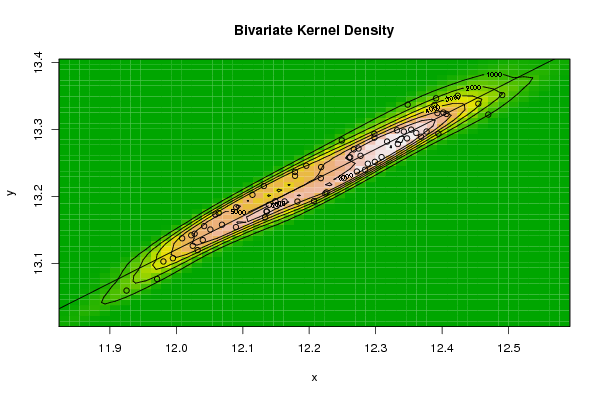
| Title produced by software | Bivariate Kernel Density Estimation | ||||||||||||||||||||||||||||||||||||||||||||
| Date of computation | Fri, 30 Oct 2009 08:12:02 -0600 | ||||||||||||||||||||||||||||||||||||||||||||
| Cite this page as follows | Statistical Computations at FreeStatistics.org, Office for Research Development and Education, URL https://freestatistics.org/blog/index.php?v=date/2009/Oct/30/t1256911990x1nizup98swgnnj.htm/, Retrieved Mon, 29 Apr 2024 03:19:34 +0000 | ||||||||||||||||||||||||||||||||||||||||||||
| Statistical Computations at FreeStatistics.org, Office for Research Development and Education, URL https://freestatistics.org/blog/index.php?pk=52106, Retrieved Mon, 29 Apr 2024 03:19:34 +0000 | |||||||||||||||||||||||||||||||||||||||||||||
| QR Codes: | |||||||||||||||||||||||||||||||||||||||||||||
|
| |||||||||||||||||||||||||||||||||||||||||||||
| Original text written by user: | |||||||||||||||||||||||||||||||||||||||||||||
| IsPrivate? | No (this computation is public) | ||||||||||||||||||||||||||||||||||||||||||||
| User-defined keywords | |||||||||||||||||||||||||||||||||||||||||||||
| Estimated Impact | 109 | ||||||||||||||||||||||||||||||||||||||||||||
Tree of Dependent Computations | |||||||||||||||||||||||||||||||||||||||||||||
| Family? (F = Feedback message, R = changed R code, M = changed R Module, P = changed Parameters, D = changed Data) | |||||||||||||||||||||||||||||||||||||||||||||
| - [Bivariate Kernel Density Estimation] [workshop 4 review] [2009-10-30 14:12:02] [6198946fb53eb5eb18db46bb758f7fde] [Current] | |||||||||||||||||||||||||||||||||||||||||||||
| Feedback Forum | |||||||||||||||||||||||||||||||||||||||||||||
Post a new message | |||||||||||||||||||||||||||||||||||||||||||||
Dataset | |||||||||||||||||||||||||||||||||||||||||||||
| Dataseries X: | |||||||||||||||||||||||||||||||||||||||||||||
12.28411643 12.27179952 12.25231194 12.22609584 12.20725694 12.22423668 12.39452537 12.46961698 12.40214917 12.40680698 12.3612585 12.37673061 12.3683743 12.34737254 12.33351554 12.30898116 12.2883068 12.29888881 12.4546734 12.49066871 12.42369699 12.39302513 12.34254658 12.35365178 12.29809105 12.29825521 12.26721478 12.27732762 12.26028617 12.26177695 12.38859418 12.3910407 12.34835315 12.24910819 12.19562829 12.17868089 12.17860381 12.13181235 12.09013416 12.05877841 12.02755584 12.03203468 12.21750702 12.21794193 12.11459312 12.06379454 12.0224142 12.05115417 12.04179334 12.00873085 11.99482061 11.98050115 11.92504174 11.97107157 12.13634736 12.13923281 12.06870533 12.03979371 12.02471263 12.08974667 12.13571456 12.15069735 12.16297202 12.14900482 12.13352883 12.1823382 12.31730986 12.33226026 12.27431991 | |||||||||||||||||||||||||||||||||||||||||||||
| Dataseries Y: | |||||||||||||||||||||||||||||||||||||||||||||
13.23983525 13.2372159 13.22732141 13.20596712 13.19312375 13.2043525 13.29384304 13.32246427 13.32548869 13.32338238 13.2949157 13.29707942 13.28934284 13.28682472 13.27838887 13.2588155 13.24891849 13.25168492 13.33865954 13.3517021 13.3506648 13.32467872 13.29699545 13.29990855 13.29363747 13.28799984 13.27043677 13.26074175 13.25824825 13.25853977 13.33677613 13.34680049 13.33733926 13.28384427 13.24589342 13.23081232 13.23672011 13.21558775 13.18378392 13.17290249 13.14419923 13.11968379 13.22737543 13.24385685 13.20238824 13.17508865 13.141864 13.15048036 13.15564727 13.13737218 13.10749742 13.10265647 13.05911895 13.07648696 13.17756911 13.18738303 13.15762434 13.13463576 13.12608843 13.15413526 13.17727193 13.1855973 13.19249001 13.19288708 13.16847758 13.19228861 13.28204729 13.29899209 13.2716847 | |||||||||||||||||||||||||||||||||||||||||||||
Tables (Output of Computation) | |||||||||||||||||||||||||||||||||||||||||||||
| |||||||||||||||||||||||||||||||||||||||||||||
Figures (Output of Computation) | |||||||||||||||||||||||||||||||||||||||||||||
Input Parameters & R Code | |||||||||||||||||||||||||||||||||||||||||||||
| Parameters (Session): | |||||||||||||||||||||||||||||||||||||||||||||
| par1 = 50 ; par2 = 50 ; par3 = 0 ; par4 = 0 ; par5 = 0 ; par6 = Y ; par7 = Y ; | |||||||||||||||||||||||||||||||||||||||||||||
| Parameters (R input): | |||||||||||||||||||||||||||||||||||||||||||||
| par1 = 50 ; par2 = 50 ; par3 = 0 ; par4 = 0 ; par5 = 0 ; par6 = Y ; par7 = Y ; | |||||||||||||||||||||||||||||||||||||||||||||
| R code (references can be found in the software module): | |||||||||||||||||||||||||||||||||||||||||||||
par1 <- as(par1,'numeric') | |||||||||||||||||||||||||||||||||||||||||||||