Free Statistics
of Irreproducible Research!
Description of Statistical Computation | |||||||||||||||||||||||||||||||||||||||||||||
|---|---|---|---|---|---|---|---|---|---|---|---|---|---|---|---|---|---|---|---|---|---|---|---|---|---|---|---|---|---|---|---|---|---|---|---|---|---|---|---|---|---|---|---|---|---|
| Author's title | |||||||||||||||||||||||||||||||||||||||||||||
| Author | *The author of this computation has been verified* | ||||||||||||||||||||||||||||||||||||||||||||
| R Software Module | rwasp_bidensity.wasp | ||||||||||||||||||||||||||||||||||||||||||||
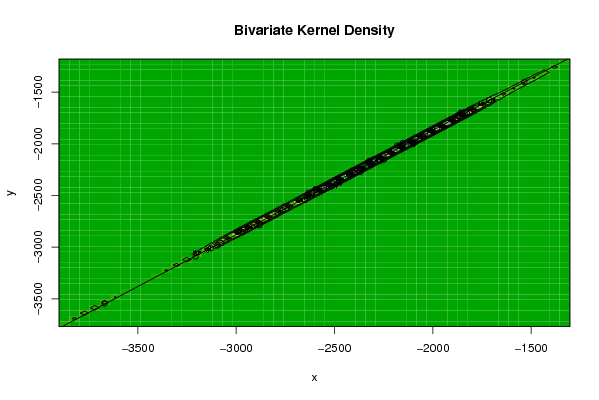
| Title produced by software | Bivariate Kernel Density Estimation | ||||||||||||||||||||||||||||||||||||||||||||
| Date of computation | Fri, 30 Oct 2009 08:38:33 -0600 | ||||||||||||||||||||||||||||||||||||||||||||
| Cite this page as follows | Statistical Computations at FreeStatistics.org, Office for Research Development and Education, URL https://freestatistics.org/blog/index.php?v=date/2009/Oct/30/t12569136642d4a34hxfj9o84z.htm/, Retrieved Sun, 28 Apr 2024 19:40:14 +0000 | ||||||||||||||||||||||||||||||||||||||||||||
| Statistical Computations at FreeStatistics.org, Office for Research Development and Education, URL https://freestatistics.org/blog/index.php?pk=52126, Retrieved Sun, 28 Apr 2024 19:40:14 +0000 | |||||||||||||||||||||||||||||||||||||||||||||
| QR Codes: | |||||||||||||||||||||||||||||||||||||||||||||
|
| |||||||||||||||||||||||||||||||||||||||||||||
| Original text written by user: | |||||||||||||||||||||||||||||||||||||||||||||
| IsPrivate? | No (this computation is public) | ||||||||||||||||||||||||||||||||||||||||||||
| User-defined keywords | |||||||||||||||||||||||||||||||||||||||||||||
| Estimated Impact | 137 | ||||||||||||||||||||||||||||||||||||||||||||
Tree of Dependent Computations | |||||||||||||||||||||||||||||||||||||||||||||
| Family? (F = Feedback message, R = changed R code, M = changed R Module, P = changed Parameters, D = changed Data) | |||||||||||||||||||||||||||||||||||||||||||||
| F [Univariate Data Series] [Gemiddelde renden...] [2008-10-13 19:42:56] [86c69698417c3ad89592e76776a2c65b] - PD [Univariate Data Series] [Bouwvergunningen ...] [2009-10-11 20:54:46] [5c968c05ca472afa314d272082b56b09] - RMPD [Bivariate Kernel Density Estimation] [WS5] [2009-10-30 14:38:33] [b8ce264f75295a954feffaf60221d1b0] [Current] - RMPD [Bivariate Explorative Data Analysis] [] [2009-11-05 18:10:16] [023d83ebdf42a2acf423907b4076e8a1] | |||||||||||||||||||||||||||||||||||||||||||||
| Feedback Forum | |||||||||||||||||||||||||||||||||||||||||||||
Post a new message | |||||||||||||||||||||||||||||||||||||||||||||
Dataset | |||||||||||||||||||||||||||||||||||||||||||||
| Dataseries X: | |||||||||||||||||||||||||||||||||||||||||||||
-1813.130876 -2101.143684 -2058.137618 -2267.706355 -2101.007565 -2368.612017 -2303.984657 -1874.249475 -2271.114711 -1868.681416 -1534.283836 -1863.492063 -1977.995434 -1826.136941 -2331.23331 -2358.156491 -2133.800693 -2364.103257 -2322.073607 -1858.604597 -2322.26296 -2088.771043 -1712.609985 -2362.32226 -2426.8728 -2251.227245 -2975.922001 -2422.926035 -2397.760266 -3206.088446 -2168.055411 -2180.274414 -2151.108645 -2596.63089 -2038.688158 -2154.002177 -2272.937488 -2554.003531 -2789.306095 -2918.99882 -3094.833728 -3074.804078 -2330.919969 -2594.956362 -2631.636955 -2755.382914 -2500.914581 -2961.141004 -3669.374169 -2764.087092 -3128.461087 -2273.937488 -2966.51971 -2613.09248 -2491.0507 -2299.564848 -2404.47051 -2541.405821 -2049.498805 -2315.724551 -2398.168622 -2314.967138 -2649.471187 -2370.594497 -2247.765654 -2880.986689 -2478.96175 -2156.025761 -1885.391659 -2651.388302 -2101.58169 -2090.634924 | |||||||||||||||||||||||||||||||||||||||||||||
| Dataseries Y: | |||||||||||||||||||||||||||||||||||||||||||||
-1700.130876 -1990.143684 -1951.137618 -2164.706355 -2003.007565 -2269.612017 -2166.984657 -1727.249475 -2124.114711 -1729.681416 -1404.283836 -1735.492063 -1850.995434 -1703.136941 -2213.23331 -2245.156491 -2024.800693 -2253.103257 -2172.073607 -1699.604597 -2164.26296 -1941.771043 -1575.609985 -2225.32226 -2290.8728 -2118.227245 -2850.922001 -2302.926035 -2283.760266 -3090.088446 -2015.055411 -2018.274414 -1990.108645 -2447.63089 -1899.688158 -2020.002177 -2142.937488 -2428.003531 -2667.306095 -2801.99882 -2982.833728 -2961.804078 -2181.919969 -2437.956362 -2474.636955 -2608.382914 -2364.914581 -2829.141004 -3544.374169 -2641.087092 -3011.461087 -2159.937488 -2855.51971 -2501.09248 -2347.0507 -2149.564848 -2255.47051 -2406.405821 -1926.498805 -2200.724551 -2281.168622 -2203.967138 -2544.471187 -2268.594497 -2152.765654 -2787.986689 -2354.96175 -2025.025761 -1761.391659 -2536.388302 -1995.58169 -1985.634924 | |||||||||||||||||||||||||||||||||||||||||||||
Tables (Output of Computation) | |||||||||||||||||||||||||||||||||||||||||||||
| |||||||||||||||||||||||||||||||||||||||||||||
Figures (Output of Computation) | |||||||||||||||||||||||||||||||||||||||||||||
Input Parameters & R Code | |||||||||||||||||||||||||||||||||||||||||||||
| Parameters (Session): | |||||||||||||||||||||||||||||||||||||||||||||
| par1 = 50 ; par2 = 50 ; par3 = 0 ; par4 = 0 ; par5 = 0 ; par6 = Y ; par7 = Y ; | |||||||||||||||||||||||||||||||||||||||||||||
| Parameters (R input): | |||||||||||||||||||||||||||||||||||||||||||||
| par1 = 50 ; par2 = 50 ; par3 = 0 ; par4 = 0 ; par5 = 0 ; par6 = Y ; par7 = Y ; | |||||||||||||||||||||||||||||||||||||||||||||
| R code (references can be found in the software module): | |||||||||||||||||||||||||||||||||||||||||||||
par1 <- as(par1,'numeric') | |||||||||||||||||||||||||||||||||||||||||||||