Free Statistics
of Irreproducible Research!
Description of Statistical Computation | |||||||||||||||||||||||||||||||||||||||||
|---|---|---|---|---|---|---|---|---|---|---|---|---|---|---|---|---|---|---|---|---|---|---|---|---|---|---|---|---|---|---|---|---|---|---|---|---|---|---|---|---|---|
| Author's title | Gemiddelde consumptieprijzen per product: normaal onderhoud en reparatie va... | ||||||||||||||||||||||||||||||||||||||||
| Author | *The author of this computation has been verified* | ||||||||||||||||||||||||||||||||||||||||
| R Software Module | rwasp_univariatedataseries.wasp | ||||||||||||||||||||||||||||||||||||||||
| Title produced by software | Univariate Data Series | ||||||||||||||||||||||||||||||||||||||||
| Date of computation | Fri, 30 Oct 2009 13:30:53 -0600 | ||||||||||||||||||||||||||||||||||||||||
| Cite this page as follows | Statistical Computations at FreeStatistics.org, Office for Research Development and Education, URL https://freestatistics.org/blog/index.php?v=date/2009/Oct/30/t12569311032zwjjlxenplsvml.htm/, Retrieved Mon, 29 Apr 2024 06:27:14 +0000 | ||||||||||||||||||||||||||||||||||||||||
| Statistical Computations at FreeStatistics.org, Office for Research Development and Education, URL https://freestatistics.org/blog/index.php?pk=52160, Retrieved Mon, 29 Apr 2024 06:27:14 +0000 | |||||||||||||||||||||||||||||||||||||||||
| QR Codes: | |||||||||||||||||||||||||||||||||||||||||
|
| |||||||||||||||||||||||||||||||||||||||||
| Original text written by user: | |||||||||||||||||||||||||||||||||||||||||
| IsPrivate? | No (this computation is public) | ||||||||||||||||||||||||||||||||||||||||
| User-defined keywords | |||||||||||||||||||||||||||||||||||||||||
| Estimated Impact | 175 | ||||||||||||||||||||||||||||||||||||||||
Tree of Dependent Computations | |||||||||||||||||||||||||||||||||||||||||
| Family? (F = Feedback message, R = changed R code, M = changed R Module, P = changed Parameters, D = changed Data) | |||||||||||||||||||||||||||||||||||||||||
| - [Univariate Data Series] [Gemiddelde consum...] [2009-10-30 19:30:53] [2622964eb3e61db9b0dfd11950e3a18c] [Current] - MP [Univariate Data Series] [Uurtarief loodgieter] [2009-11-10 16:01:55] [e2a6b1b31bd881219e1879835b4c60d0] | |||||||||||||||||||||||||||||||||||||||||
| Feedback Forum | |||||||||||||||||||||||||||||||||||||||||
Post a new message | |||||||||||||||||||||||||||||||||||||||||
Dataset | |||||||||||||||||||||||||||||||||||||||||
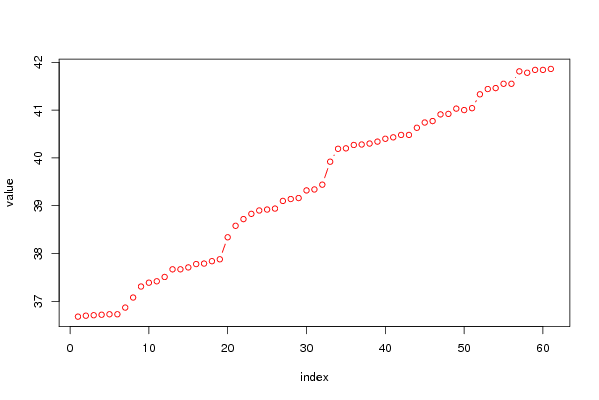
| Dataseries X: | |||||||||||||||||||||||||||||||||||||||||
36.68 36.7 36.71 36.72 36.73 36.73 36.87 37.08 37.31 37.39 37.42 37.51 37.67 37.67 37.71 37.78 37.79 37.84 37.88 38.34 38.58 38.72 38.83 38.9 38.92 38.94 39.1 39.14 39.16 39.32 39.34 39.44 39.92 40.19 40.2 40.27 40.28 40.3 40.34 40.4 40.43 40.48 40.48 40.63 40.74 40.77 40.91 40.92 41.03 41 41.04 41.33 41.44 41.46 41.55 41.55 41.81 41.78 41.84 41.84 41.86 | |||||||||||||||||||||||||||||||||||||||||
Tables (Output of Computation) | |||||||||||||||||||||||||||||||||||||||||
| |||||||||||||||||||||||||||||||||||||||||
Figures (Output of Computation) | |||||||||||||||||||||||||||||||||||||||||
Input Parameters & R Code | |||||||||||||||||||||||||||||||||||||||||
| Parameters (Session): | |||||||||||||||||||||||||||||||||||||||||
| par1 = Uurtarief loodgieter ; par2 = Belgostat ; par3 = Gemiddelde consumptieprijzen per product: normaal onderhoud en reparatie van de woning - diensten voor normaal onderhoud en reparatie van woningen ; | |||||||||||||||||||||||||||||||||||||||||
| Parameters (R input): | |||||||||||||||||||||||||||||||||||||||||
| par1 = Uurtarief loodgieter ; par2 = Belgostat ; par3 = Gemiddelde consumptieprijzen per product: normaal onderhoud en reparatie van de woning - diensten voor normaal onderhoud en reparatie van woningen ; | |||||||||||||||||||||||||||||||||||||||||
| R code (references can be found in the software module): | |||||||||||||||||||||||||||||||||||||||||
bitmap(file='test1.png') | |||||||||||||||||||||||||||||||||||||||||