Free Statistics
of Irreproducible Research!
Description of Statistical Computation | |
|---|---|
| Author's title | |
| Author | *The author of this computation has been verified* |
| R Software Module | Rscript (source code is shown below) |
| Title produced by software | R console |
| Date of computation | Fri, 04 Sep 2009 05:03:20 -0600 |
| Cite this page as follows | Statistical Computations at FreeStatistics.org, Office for Research Development and Education, URL https://freestatistics.org/blog/index.php?v=date/2009/Sep/04/t1252062201qmlc7zg5wtaocxh.htm/, Retrieved Thu, 16 May 2024 16:14:14 +0000 |
| Statistical Computations at FreeStatistics.org, Office for Research Development and Education, URL https://freestatistics.org/blog/index.php?pk=42978, Retrieved Thu, 16 May 2024 16:14:14 +0000 | |
| QR Codes: | |
|
| |
| Original text written by user: | This example is used in the manual files of the RC package. |
| IsPrivate? | No (this computation is public) |
| User-defined keywords | blogtest |
| Estimated Impact | 264 |
Tree of Dependent Computations | |
| Family? (F = Feedback message, R = changed R code, M = changed R Module, P = changed Parameters, D = changed Data) | |
| - [Spectral Analysis] [] [2009-06-19 08:45:25] [b98453cac15ba1066b407e146608df68] - RMPD [R console] [correlation test] [2009-09-04 11:03:20] [256f657a32c6b2b7628dddcfa9a822d0] [Current] | |
| Feedback Forum | |
Post a new message | |
Dataset | |
| Dataseries X: | |
-0.195318556630164 -1.34026188097655 0.833189523838066 -0.582479358437781 0.459218588069904 1.07593848522702 -0.851464293268898 -1.35811096910044 0.0217475464251442 -0.0240034348804741 -0.566921103879656 -0.371029778548940 -0.825131284400369 -0.158901849612410 0.191772048548733 2.30464408155995 0.185991774072335 1.28462518065553 -0.207940105696579 1.51849660089803 -0.871002207784188 0.644157623801728 1.48727373583370 -1.02561899554200 0.682893628191407 1.11140662953725 1.08443042303221 1.15477697004935 -1.28150722465239 -0.782174771675023 1.29805817716355 0.34669536495116 -0.149097264992159 -0.719375616261475 0.617749451913488 -1.65182626329652 -2.22126259051188 -0.458372453372996 -1.50261059293842 0.958369881203464 -0.464920660885446 -0.384491031513721 0.260128337154379 -0.696465845616919 -0.504034574764555 -0.591285339120801 0.139221205277459 -1.66228678008181 -1.48054205222866 -1.50478887085589 -1.39625974393428 -0.871166189701796 0.774298924868677 0.459491454657757 1.88614628395439 1.00814301291040 -0.426802717126795 -0.336175950643805 0.0888583034671628 0.242924524043013 -0.230837734983085 1.07415039342718 0.345725045409046 1.64249682385273 0.101751396496017 -1.33249560501735 0.485471368173327 -0.294076227679069 -3.03200926250989 1.14288684284443 -1.266232769356 1.53538572689354 -1.14874148041058 -0.609356570022525 -0.629279911729056 2.59521903874670 -2.26011288160216 1.40620985372860 0.765314214763132 1.56674488509074 -0.769176685086572 -0.882083606243507 -0.928900796022187 -0.92751136526161 0.506911770205717 -0.0817153202603825 0.453625701637046 0.632181419952343 -1.13452598589110 -0.586206761951814 1.02485138510707 3.14703758047872 1.34414917083172 -0.852465549118429 0.556564263765452 1.95413755216506 0.515995483075011 0.976570541168322 1.48090388258044 0.528322825065961 | |
Tables (Output of Computation) | |
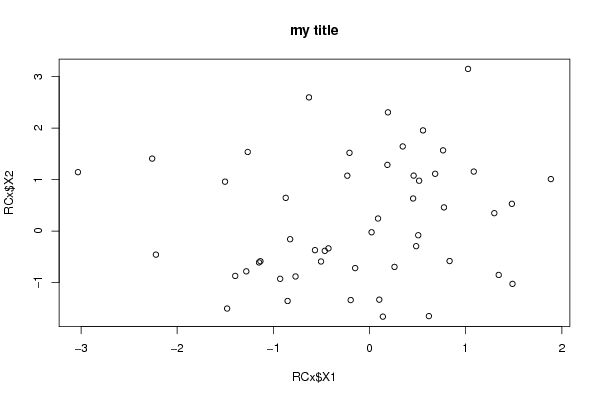
> title = 'my title'


> {
+     plot(RCx$X1, RCx$X2, main = title)
+     res <- cor.test(RCx$X1, RCx$X2)
+     print(res)
+ }

	Pearson's product-moment correlation

data:  RCx$X1 and RCx$X2
t = 0.9311, df = 48, p-value = 0.3564
alternative hypothesis: true correlation is not equal to 0
95 percent confidence interval:
 -0.1507353  0.3968357
sample estimates:
      cor
0.1332011
| |
Figures (Output of Computation) | |
Input Parameters & R Code | |
| Parameters (Session): | |
| par1 = 'mytitle' ; | |
| Parameters (R input): | |
| R code (body of R function): | |
{ | |