Free Statistics
of Irreproducible Research!
Description of Statistical Computation | |
|---|---|
| Author's title | |
| Author | *The author of this computation has been verified* |
| R Software Module | Rscript (source code is shown below) |
| Title produced by software | R console |
| Date of computation | Wed, 23 Sep 2009 01:46:43 -0600 |
| Cite this page as follows | Statistical Computations at FreeStatistics.org, Office for Research Development and Education, URL https://freestatistics.org/blog/index.php?v=date/2009/Sep/23/t1253692005q7hldawhf7rfel3.htm/, Retrieved Thu, 02 May 2024 21:08:51 +0000 |
| Statistical Computations at FreeStatistics.org, Office for Research Development and Education, URL https://freestatistics.org/blog/index.php?pk=43001, Retrieved Thu, 02 May 2024 21:08:51 +0000 | |
| QR Codes: | |
|
| |
| Original text written by user: | This example is used in the manual files of the RC package. |
| IsPrivate? | No (this computation is public) |
| User-defined keywords | blogtest |
| Estimated Impact | 256 |
Tree of Dependent Computations | |
| Family? (F = Feedback message, R = changed R code, M = changed R Module, P = changed Parameters, D = changed Data) | |
| - [Bagplot] [test] [2009-08-13 21:20:56] [b98453cac15ba1066b407e146608df68] - RMPD [R console] [correlation test] [2009-09-23 07:46:43] [256f657a32c6b2b7628dddcfa9a822d0] [Current] | |
| Feedback Forum | |
Post a new message | |
Dataset | |
| Dataseries X: | |
-0.603587569504248 0.0903333834964677 0.456793481420999 -0.462983460284063 0.68836857471527 0.629263308817853 0.681206111331602 1.03387389254118 -0.394544916054143 -0.946563269649112 1.04368980747146 -0.305886783040773 -0.104282146651156 1.09635851033353 2.10132734028122 0.100948426887387 -0.262493566532433 -0.0629138192586112 -0.753513856526121 -1.00936941451496 0.170236994081325 -0.57872399030376 -0.444611141151938 -0.333662713333354 -0.70414897754712 1.43436538041397 -0.791455660988697 -1.14886833918605 0.637063795765823 -0.96267466042059 -0.606350537658577 -1.13630140652132 -2.02374081475408 -2.19109122399720 -0.53091566580776 -0.233171255957852 -0.370262308795391 0.638621637380754 0.487275091218545 -0.993458213279501 -0.382842316828017 -0.992561032982792 -0.0055824840459708 -0.473086867408685 1.09330837823507 0.62744509053002 -0.0150912274714793 0.916216187007162 0.844749065804107 -0.322954211419127 0.113753572625428 -0.637883090836931 -0.580802725432952 -2.05822337775833 0.263020183426005 -0.550711611695321 -0.322357311665891 0.313154557701688 0.614185386856909 1.43286026780039 0.487818304442740 1.17673605542189 0.438777404704271 -0.131137226587201 -1.95076203164633 -0.295474391632602 0.59505918253513 0.509427747644112 1.02094021155102 0.158421375946129 0.43340421333824 1.28055714610623 1.08008065554954 0.166053119699061 1.46299906429072 -0.4483264732443 -0.534509141482431 1.93679862532907 0.394049048484759 0.307662909379780 1.29755806456103 -0.469659375719167 -0.439272127857303 1.39081497367774 1.46209409034926 -0.212161197260256 -0.169641714988746 -0.382711601726004 0.334733948169158 -1.61819123118974 0.19942040356675 -1.04476477775262 0.256813426584979 0.264389902286446 2.38336693344172 -0.411068595031767 -1.42940730434619 -0.370000846935263 -0.386938552629515 0.552612910647556 | |
Tables (Output of Computation) | |
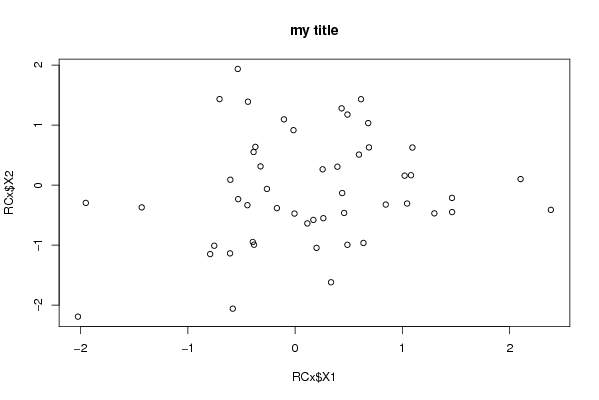
> title = 'my title'


> {
+     plot(RCx$X1, RCx$X2, main = title)
+     res <- cor.test(RCx$X1, RCx$X2)
+     print(res)
+ }

	Pearson's product-moment correlation

data:  RCx$X1 and RCx$X2
t = 1.2116, df = 48, p-value = 0.2316
alternative hypothesis: true correlation is not equal to 0
95 percent confidence interval:
 -0.1114213  0.4299982
sample estimates:
      cor
0.1722692
| |
Figures (Output of Computation) | |
Input Parameters & R Code | |
| Parameters (Session): | |
| par1 = 'mytitle' ; | |
| Parameters (R input): | |
| R code (body of R function): | |
{ | |