Free Statistics

of Irreproducible Research!

Author's title

Author*The author of this computation has been verified*
R Software Modulerwasp_autocorrelation.wasp
Title produced by software(Partial) Autocorrelation Function
Date of computationTue, 21 Dec 2010 18:29:19 +0000
Cite this page as followsStatistical Computations at FreeStatistics.org, Office for Research Development and Education, URL https://freestatistics.org/blog/index.php?v=date/2010/Dec/21/t1292956091hvhrlo99nl7yhfo.htm/, Retrieved Fri, 17 May 2024 22:49:29 +0000
Statistical Computations at FreeStatistics.org, Office for Research Development and Education, URL https://freestatistics.org/blog/index.php?pk=113813, Retrieved Fri, 17 May 2024 22:49:29 +0000
QR Codes:

Original text written by user:
IsPrivate?No (this computation is public)
User-defined keywords
Estimated Impact89
Family? (F = Feedback message, R = changed R code, M = changed R Module, P = changed Parameters, D = changed Data)
-       [(Partial) Autocorrelation Function] [ACF - d=D=0 (ASO)] [2010-12-21 18:29:19] [194b0dcd1d575718d8c1582a0112d12c] [Current]
Feedback Forum

Post a new message
Dataseries X:
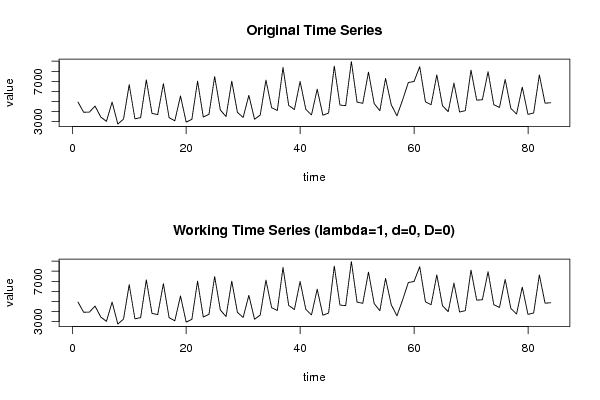
4940
3924
3927
4535
3446
3016
4934
2743
3242
6662
3262
3381
7144
3803
3684
6759
3386
3066
5538
2940
3215
7023
3443
3712
7475
4137
3491
7019
3908
3402
5604
3222
3636
7123
4368
4092
8377
4595
4188
6988
4218
3655
6211
3622
3841
8510
4627
4582
8967
4928
4809
7917
4790
4065
7290
4670
3561
5149
6880
6981
8454
4960
4670
7638
4560
3980
6825
3939
4079
8117
5121
5167
7960
4670
4397
7191
4293
3747
6425
3709
3840
7642
4821
4865


Summary of computational transaction
Raw Inputview raw input (R code)
Raw Outputview raw output of R engine
Computing time1 seconds
R Server'Gwilym Jenkins' @ 72.249.127.135

\begin{tabular}{lllllllll}
\hline
Summary of computational transaction \tabularnewline
Raw Input & view raw input (R code)  \tabularnewline
Raw Output & view raw output of R engine  \tabularnewline
Computing time & 1 seconds \tabularnewline
R Server & 'Gwilym Jenkins' @ 72.249.127.135 \tabularnewline
\hline
\end{tabular}
%Source: https://freestatistics.org/blog/index.php?pk=113813&T=0

[TABLE]
[ROW][C]Summary of computational transaction[/C][/ROW]
[ROW][C]Raw Input[/C][C]view raw input (R code) [/C][/ROW]
[ROW][C]Raw Output[/C][C]view raw output of R engine [/C][/ROW]
[ROW][C]Computing time[/C][C]1 seconds[/C][/ROW]
[ROW][C]R Server[/C][C]'Gwilym Jenkins' @ 72.249.127.135[/C][/ROW]
[/TABLE]
Source: https://freestatistics.org/blog/index.php?pk=113813&T=0

Globally Unique Identifier (entire table): ba.freestatistics.org/blog/index.php?pk=113813&T=0

As an alternative you can also use a QR Code:  

The GUIDs for individual cells are displayed in the table below:

Summary of computational transaction
Raw Inputview raw input (R code)
Raw Outputview raw output of R engine
Computing time1 seconds
R Server'Gwilym Jenkins' @ 72.249.127.135


Autocorrelation Function
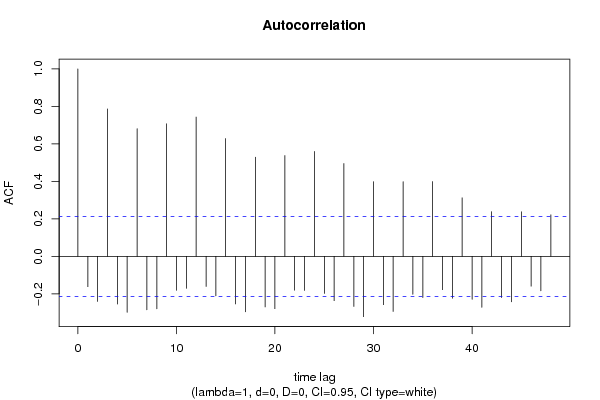
Time lag kACF(k)T-STATP-value
1-0.162253-1.48710.07037
2-0.240831-2.20730.015012
30.7863877.20740
4-0.254865-2.33590.010941
5-0.298672-2.73740.003779
60.6812756.2440
7-0.28529-2.61470.005291
8-0.28042-2.57010.005966
90.707326.48270
10-0.181146-1.66020.050299
11-0.171074-1.56790.06033
120.7430266.80990
13-0.160849-1.47420.072083
14-0.210789-1.93190.028371
150.6283655.75910
16-0.25447-2.33230.01104
17-0.296374-2.71630.004007
180.5292944.85113e-06
19-0.270453-2.47870.007592
20-0.279393-2.56070.006117
210.5378064.92912e-06
22-0.180809-1.65710.050611
23-0.182431-1.6720.049122
240.5595095.1281e-06
25-0.198061-1.81530.036527
26-0.236505-2.16760.016509
270.4948954.53589e-06
28-0.267783-2.45430.008091
29-0.32201-2.95130.00205
300.3983483.65090.000227
31-0.257861-2.36330.01021
32-0.294253-2.69690.004228
330.3983943.65130.000226
34-0.202727-1.8580.033334
35-0.220449-2.02040.023261
360.3986583.65380.000224
37-0.177822-1.62980.053448
38-0.22318-2.04550.021969
390.3122762.86210.002656
40-0.229365-2.10220.019267
41-0.272051-2.49340.007307
420.2379122.18050.016009
43-0.220149-2.01770.023407
44-0.243125-2.22830.014267
450.2372872.17480.01623
46-0.159418-1.46110.07386
47-0.184374-1.68980.047385
480.2214352.02950.022787

\begin{tabular}{lllllllll}
\hline
Autocorrelation Function \tabularnewline
Time lag k & ACF(k) & T-STAT & P-value \tabularnewline
1 & -0.162253 & -1.4871 & 0.07037 \tabularnewline
2 & -0.240831 & -2.2073 & 0.015012 \tabularnewline
3 & 0.786387 & 7.2074 & 0 \tabularnewline
4 & -0.254865 & -2.3359 & 0.010941 \tabularnewline
5 & -0.298672 & -2.7374 & 0.003779 \tabularnewline
6 & 0.681275 & 6.244 & 0 \tabularnewline
7 & -0.28529 & -2.6147 & 0.005291 \tabularnewline
8 & -0.28042 & -2.5701 & 0.005966 \tabularnewline
9 & 0.70732 & 6.4827 & 0 \tabularnewline
10 & -0.181146 & -1.6602 & 0.050299 \tabularnewline
11 & -0.171074 & -1.5679 & 0.06033 \tabularnewline
12 & 0.743026 & 6.8099 & 0 \tabularnewline
13 & -0.160849 & -1.4742 & 0.072083 \tabularnewline
14 & -0.210789 & -1.9319 & 0.028371 \tabularnewline
15 & 0.628365 & 5.7591 & 0 \tabularnewline
16 & -0.25447 & -2.3323 & 0.01104 \tabularnewline
17 & -0.296374 & -2.7163 & 0.004007 \tabularnewline
18 & 0.529294 & 4.8511 & 3e-06 \tabularnewline
19 & -0.270453 & -2.4787 & 0.007592 \tabularnewline
20 & -0.279393 & -2.5607 & 0.006117 \tabularnewline
21 & 0.537806 & 4.9291 & 2e-06 \tabularnewline
22 & -0.180809 & -1.6571 & 0.050611 \tabularnewline
23 & -0.182431 & -1.672 & 0.049122 \tabularnewline
24 & 0.559509 & 5.128 & 1e-06 \tabularnewline
25 & -0.198061 & -1.8153 & 0.036527 \tabularnewline
26 & -0.236505 & -2.1676 & 0.016509 \tabularnewline
27 & 0.494895 & 4.5358 & 9e-06 \tabularnewline
28 & -0.267783 & -2.4543 & 0.008091 \tabularnewline
29 & -0.32201 & -2.9513 & 0.00205 \tabularnewline
30 & 0.398348 & 3.6509 & 0.000227 \tabularnewline
31 & -0.257861 & -2.3633 & 0.01021 \tabularnewline
32 & -0.294253 & -2.6969 & 0.004228 \tabularnewline
33 & 0.398394 & 3.6513 & 0.000226 \tabularnewline
34 & -0.202727 & -1.858 & 0.033334 \tabularnewline
35 & -0.220449 & -2.0204 & 0.023261 \tabularnewline
36 & 0.398658 & 3.6538 & 0.000224 \tabularnewline
37 & -0.177822 & -1.6298 & 0.053448 \tabularnewline
38 & -0.22318 & -2.0455 & 0.021969 \tabularnewline
39 & 0.312276 & 2.8621 & 0.002656 \tabularnewline
40 & -0.229365 & -2.1022 & 0.019267 \tabularnewline
41 & -0.272051 & -2.4934 & 0.007307 \tabularnewline
42 & 0.237912 & 2.1805 & 0.016009 \tabularnewline
43 & -0.220149 & -2.0177 & 0.023407 \tabularnewline
44 & -0.243125 & -2.2283 & 0.014267 \tabularnewline
45 & 0.237287 & 2.1748 & 0.01623 \tabularnewline
46 & -0.159418 & -1.4611 & 0.07386 \tabularnewline
47 & -0.184374 & -1.6898 & 0.047385 \tabularnewline
48 & 0.221435 & 2.0295 & 0.022787 \tabularnewline
\hline
\end{tabular}
%Source: https://freestatistics.org/blog/index.php?pk=113813&T=1

[TABLE]
[ROW][C]Autocorrelation Function[/C][/ROW]
[ROW][C]Time lag k[/C][C]ACF(k)[/C][C]T-STAT[/C][C]P-value[/C][/ROW]
[ROW][C]1[/C][C]-0.162253[/C][C]-1.4871[/C][C]0.07037[/C][/ROW]
[ROW][C]2[/C][C]-0.240831[/C][C]-2.2073[/C][C]0.015012[/C][/ROW]
[ROW][C]3[/C][C]0.786387[/C][C]7.2074[/C][C]0[/C][/ROW]
[ROW][C]4[/C][C]-0.254865[/C][C]-2.3359[/C][C]0.010941[/C][/ROW]
[ROW][C]5[/C][C]-0.298672[/C][C]-2.7374[/C][C]0.003779[/C][/ROW]
[ROW][C]6[/C][C]0.681275[/C][C]6.244[/C][C]0[/C][/ROW]
[ROW][C]7[/C][C]-0.28529[/C][C]-2.6147[/C][C]0.005291[/C][/ROW]
[ROW][C]8[/C][C]-0.28042[/C][C]-2.5701[/C][C]0.005966[/C][/ROW]
[ROW][C]9[/C][C]0.70732[/C][C]6.4827[/C][C]0[/C][/ROW]
[ROW][C]10[/C][C]-0.181146[/C][C]-1.6602[/C][C]0.050299[/C][/ROW]
[ROW][C]11[/C][C]-0.171074[/C][C]-1.5679[/C][C]0.06033[/C][/ROW]
[ROW][C]12[/C][C]0.743026[/C][C]6.8099[/C][C]0[/C][/ROW]
[ROW][C]13[/C][C]-0.160849[/C][C]-1.4742[/C][C]0.072083[/C][/ROW]
[ROW][C]14[/C][C]-0.210789[/C][C]-1.9319[/C][C]0.028371[/C][/ROW]
[ROW][C]15[/C][C]0.628365[/C][C]5.7591[/C][C]0[/C][/ROW]
[ROW][C]16[/C][C]-0.25447[/C][C]-2.3323[/C][C]0.01104[/C][/ROW]
[ROW][C]17[/C][C]-0.296374[/C][C]-2.7163[/C][C]0.004007[/C][/ROW]
[ROW][C]18[/C][C]0.529294[/C][C]4.8511[/C][C]3e-06[/C][/ROW]
[ROW][C]19[/C][C]-0.270453[/C][C]-2.4787[/C][C]0.007592[/C][/ROW]
[ROW][C]20[/C][C]-0.279393[/C][C]-2.5607[/C][C]0.006117[/C][/ROW]
[ROW][C]21[/C][C]0.537806[/C][C]4.9291[/C][C]2e-06[/C][/ROW]
[ROW][C]22[/C][C]-0.180809[/C][C]-1.6571[/C][C]0.050611[/C][/ROW]
[ROW][C]23[/C][C]-0.182431[/C][C]-1.672[/C][C]0.049122[/C][/ROW]
[ROW][C]24[/C][C]0.559509[/C][C]5.128[/C][C]1e-06[/C][/ROW]
[ROW][C]25[/C][C]-0.198061[/C][C]-1.8153[/C][C]0.036527[/C][/ROW]
[ROW][C]26[/C][C]-0.236505[/C][C]-2.1676[/C][C]0.016509[/C][/ROW]
[ROW][C]27[/C][C]0.494895[/C][C]4.5358[/C][C]9e-06[/C][/ROW]
[ROW][C]28[/C][C]-0.267783[/C][C]-2.4543[/C][C]0.008091[/C][/ROW]
[ROW][C]29[/C][C]-0.32201[/C][C]-2.9513[/C][C]0.00205[/C][/ROW]
[ROW][C]30[/C][C]0.398348[/C][C]3.6509[/C][C]0.000227[/C][/ROW]
[ROW][C]31[/C][C]-0.257861[/C][C]-2.3633[/C][C]0.01021[/C][/ROW]
[ROW][C]32[/C][C]-0.294253[/C][C]-2.6969[/C][C]0.004228[/C][/ROW]
[ROW][C]33[/C][C]0.398394[/C][C]3.6513[/C][C]0.000226[/C][/ROW]
[ROW][C]34[/C][C]-0.202727[/C][C]-1.858[/C][C]0.033334[/C][/ROW]
[ROW][C]35[/C][C]-0.220449[/C][C]-2.0204[/C][C]0.023261[/C][/ROW]
[ROW][C]36[/C][C]0.398658[/C][C]3.6538[/C][C]0.000224[/C][/ROW]
[ROW][C]37[/C][C]-0.177822[/C][C]-1.6298[/C][C]0.053448[/C][/ROW]
[ROW][C]38[/C][C]-0.22318[/C][C]-2.0455[/C][C]0.021969[/C][/ROW]
[ROW][C]39[/C][C]0.312276[/C][C]2.8621[/C][C]0.002656[/C][/ROW]
[ROW][C]40[/C][C]-0.229365[/C][C]-2.1022[/C][C]0.019267[/C][/ROW]
[ROW][C]41[/C][C]-0.272051[/C][C]-2.4934[/C][C]0.007307[/C][/ROW]
[ROW][C]42[/C][C]0.237912[/C][C]2.1805[/C][C]0.016009[/C][/ROW]
[ROW][C]43[/C][C]-0.220149[/C][C]-2.0177[/C][C]0.023407[/C][/ROW]
[ROW][C]44[/C][C]-0.243125[/C][C]-2.2283[/C][C]0.014267[/C][/ROW]
[ROW][C]45[/C][C]0.237287[/C][C]2.1748[/C][C]0.01623[/C][/ROW]
[ROW][C]46[/C][C]-0.159418[/C][C]-1.4611[/C][C]0.07386[/C][/ROW]
[ROW][C]47[/C][C]-0.184374[/C][C]-1.6898[/C][C]0.047385[/C][/ROW]
[ROW][C]48[/C][C]0.221435[/C][C]2.0295[/C][C]0.022787[/C][/ROW]
[/TABLE]
Source: https://freestatistics.org/blog/index.php?pk=113813&T=1

Globally Unique Identifier (entire table): ba.freestatistics.org/blog/index.php?pk=113813&T=1

As an alternative you can also use a QR Code:  

The GUIDs for individual cells are displayed in the table below:

Autocorrelation Function
Time lag kACF(k)T-STATP-value
1-0.162253-1.48710.07037
2-0.240831-2.20730.015012
30.7863877.20740
4-0.254865-2.33590.010941
5-0.298672-2.73740.003779
60.6812756.2440
7-0.28529-2.61470.005291
8-0.28042-2.57010.005966
90.707326.48270
10-0.181146-1.66020.050299
11-0.171074-1.56790.06033
120.7430266.80990
13-0.160849-1.47420.072083
14-0.210789-1.93190.028371
150.6283655.75910
16-0.25447-2.33230.01104
17-0.296374-2.71630.004007
180.5292944.85113e-06
19-0.270453-2.47870.007592
20-0.279393-2.56070.006117
210.5378064.92912e-06
22-0.180809-1.65710.050611
23-0.182431-1.6720.049122
240.5595095.1281e-06
25-0.198061-1.81530.036527
26-0.236505-2.16760.016509
270.4948954.53589e-06
28-0.267783-2.45430.008091
29-0.32201-2.95130.00205
300.3983483.65090.000227
31-0.257861-2.36330.01021
32-0.294253-2.69690.004228
330.3983943.65130.000226
34-0.202727-1.8580.033334
35-0.220449-2.02040.023261
360.3986583.65380.000224
37-0.177822-1.62980.053448
38-0.22318-2.04550.021969
390.3122762.86210.002656
40-0.229365-2.10220.019267
41-0.272051-2.49340.007307
420.2379122.18050.016009
43-0.220149-2.01770.023407
44-0.243125-2.22830.014267
450.2372872.17480.01623
46-0.159418-1.46110.07386
47-0.184374-1.68980.047385
480.2214352.02950.022787


Partial Autocorrelation Function
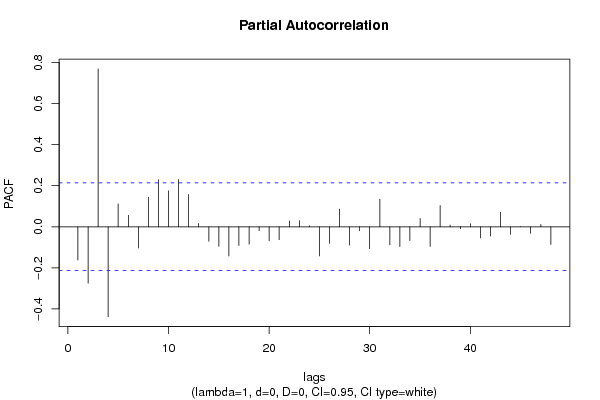
Time lag kPACF(k)T-STATP-value
1-0.162253-1.48710.07037
2-0.27438-2.51470.006909
30.7686517.04480
4-0.437557-4.01036.5e-05
50.111331.02040.155245
60.0560930.51410.304265
7-0.102806-0.94220.174388
80.1441891.32150.09496
90.228752.09650.019522
100.1752821.60650.05596
110.2304752.11230.018813
120.1575571.4440.076225
130.0158380.14520.442468
14-0.070984-0.65060.258548
15-0.09516-0.87220.192805
16-0.142364-1.30480.097765
17-0.090936-0.83340.20348
18-0.08495-0.77860.219209
19-0.019235-0.17630.430246
20-0.068541-0.62820.265793
21-0.062723-0.57490.28346
220.0287590.26360.396374
230.0304930.27950.390283
240.0045310.04150.483486
25-0.142214-1.30340.097998
26-0.081253-0.74470.229267
270.0865520.79330.21493
28-0.089755-0.82260.206526
29-0.019526-0.1790.429199
30-0.107509-0.98530.163643
310.1340021.22810.111411
32-0.087767-0.80440.21172
33-0.096548-0.88490.189374
34-0.066841-0.61260.270896
350.0404210.37050.355984
36-0.095767-0.87770.1913
370.1037060.95050.172297
380.0081480.07470.470324
39-0.009531-0.08740.465298
400.0144650.13260.447422
41-0.054536-0.49980.30925
42-0.04456-0.40840.342011
430.0709560.65030.258629
44-0.03593-0.32930.371374
450.0001240.00110.499548
46-0.031907-0.29240.385338
470.0115360.10570.458026
48-0.085711-0.78560.21717

\begin{tabular}{lllllllll}
\hline
Partial Autocorrelation Function \tabularnewline
Time lag k & PACF(k) & T-STAT & P-value \tabularnewline
1 & -0.162253 & -1.4871 & 0.07037 \tabularnewline
2 & -0.27438 & -2.5147 & 0.006909 \tabularnewline
3 & 0.768651 & 7.0448 & 0 \tabularnewline
4 & -0.437557 & -4.0103 & 6.5e-05 \tabularnewline
5 & 0.11133 & 1.0204 & 0.155245 \tabularnewline
6 & 0.056093 & 0.5141 & 0.304265 \tabularnewline
7 & -0.102806 & -0.9422 & 0.174388 \tabularnewline
8 & 0.144189 & 1.3215 & 0.09496 \tabularnewline
9 & 0.22875 & 2.0965 & 0.019522 \tabularnewline
10 & 0.175282 & 1.6065 & 0.05596 \tabularnewline
11 & 0.230475 & 2.1123 & 0.018813 \tabularnewline
12 & 0.157557 & 1.444 & 0.076225 \tabularnewline
13 & 0.015838 & 0.1452 & 0.442468 \tabularnewline
14 & -0.070984 & -0.6506 & 0.258548 \tabularnewline
15 & -0.09516 & -0.8722 & 0.192805 \tabularnewline
16 & -0.142364 & -1.3048 & 0.097765 \tabularnewline
17 & -0.090936 & -0.8334 & 0.20348 \tabularnewline
18 & -0.08495 & -0.7786 & 0.219209 \tabularnewline
19 & -0.019235 & -0.1763 & 0.430246 \tabularnewline
20 & -0.068541 & -0.6282 & 0.265793 \tabularnewline
21 & -0.062723 & -0.5749 & 0.28346 \tabularnewline
22 & 0.028759 & 0.2636 & 0.396374 \tabularnewline
23 & 0.030493 & 0.2795 & 0.390283 \tabularnewline
24 & 0.004531 & 0.0415 & 0.483486 \tabularnewline
25 & -0.142214 & -1.3034 & 0.097998 \tabularnewline
26 & -0.081253 & -0.7447 & 0.229267 \tabularnewline
27 & 0.086552 & 0.7933 & 0.21493 \tabularnewline
28 & -0.089755 & -0.8226 & 0.206526 \tabularnewline
29 & -0.019526 & -0.179 & 0.429199 \tabularnewline
30 & -0.107509 & -0.9853 & 0.163643 \tabularnewline
31 & 0.134002 & 1.2281 & 0.111411 \tabularnewline
32 & -0.087767 & -0.8044 & 0.21172 \tabularnewline
33 & -0.096548 & -0.8849 & 0.189374 \tabularnewline
34 & -0.066841 & -0.6126 & 0.270896 \tabularnewline
35 & 0.040421 & 0.3705 & 0.355984 \tabularnewline
36 & -0.095767 & -0.8777 & 0.1913 \tabularnewline
37 & 0.103706 & 0.9505 & 0.172297 \tabularnewline
38 & 0.008148 & 0.0747 & 0.470324 \tabularnewline
39 & -0.009531 & -0.0874 & 0.465298 \tabularnewline
40 & 0.014465 & 0.1326 & 0.447422 \tabularnewline
41 & -0.054536 & -0.4998 & 0.30925 \tabularnewline
42 & -0.04456 & -0.4084 & 0.342011 \tabularnewline
43 & 0.070956 & 0.6503 & 0.258629 \tabularnewline
44 & -0.03593 & -0.3293 & 0.371374 \tabularnewline
45 & 0.000124 & 0.0011 & 0.499548 \tabularnewline
46 & -0.031907 & -0.2924 & 0.385338 \tabularnewline
47 & 0.011536 & 0.1057 & 0.458026 \tabularnewline
48 & -0.085711 & -0.7856 & 0.21717 \tabularnewline
\hline
\end{tabular}
%Source: https://freestatistics.org/blog/index.php?pk=113813&T=2

[TABLE]
[ROW][C]Partial Autocorrelation Function[/C][/ROW]
[ROW][C]Time lag k[/C][C]PACF(k)[/C][C]T-STAT[/C][C]P-value[/C][/ROW]
[ROW][C]1[/C][C]-0.162253[/C][C]-1.4871[/C][C]0.07037[/C][/ROW]
[ROW][C]2[/C][C]-0.27438[/C][C]-2.5147[/C][C]0.006909[/C][/ROW]
[ROW][C]3[/C][C]0.768651[/C][C]7.0448[/C][C]0[/C][/ROW]
[ROW][C]4[/C][C]-0.437557[/C][C]-4.0103[/C][C]6.5e-05[/C][/ROW]
[ROW][C]5[/C][C]0.11133[/C][C]1.0204[/C][C]0.155245[/C][/ROW]
[ROW][C]6[/C][C]0.056093[/C][C]0.5141[/C][C]0.304265[/C][/ROW]
[ROW][C]7[/C][C]-0.102806[/C][C]-0.9422[/C][C]0.174388[/C][/ROW]
[ROW][C]8[/C][C]0.144189[/C][C]1.3215[/C][C]0.09496[/C][/ROW]
[ROW][C]9[/C][C]0.22875[/C][C]2.0965[/C][C]0.019522[/C][/ROW]
[ROW][C]10[/C][C]0.175282[/C][C]1.6065[/C][C]0.05596[/C][/ROW]
[ROW][C]11[/C][C]0.230475[/C][C]2.1123[/C][C]0.018813[/C][/ROW]
[ROW][C]12[/C][C]0.157557[/C][C]1.444[/C][C]0.076225[/C][/ROW]
[ROW][C]13[/C][C]0.015838[/C][C]0.1452[/C][C]0.442468[/C][/ROW]
[ROW][C]14[/C][C]-0.070984[/C][C]-0.6506[/C][C]0.258548[/C][/ROW]
[ROW][C]15[/C][C]-0.09516[/C][C]-0.8722[/C][C]0.192805[/C][/ROW]
[ROW][C]16[/C][C]-0.142364[/C][C]-1.3048[/C][C]0.097765[/C][/ROW]
[ROW][C]17[/C][C]-0.090936[/C][C]-0.8334[/C][C]0.20348[/C][/ROW]
[ROW][C]18[/C][C]-0.08495[/C][C]-0.7786[/C][C]0.219209[/C][/ROW]
[ROW][C]19[/C][C]-0.019235[/C][C]-0.1763[/C][C]0.430246[/C][/ROW]
[ROW][C]20[/C][C]-0.068541[/C][C]-0.6282[/C][C]0.265793[/C][/ROW]
[ROW][C]21[/C][C]-0.062723[/C][C]-0.5749[/C][C]0.28346[/C][/ROW]
[ROW][C]22[/C][C]0.028759[/C][C]0.2636[/C][C]0.396374[/C][/ROW]
[ROW][C]23[/C][C]0.030493[/C][C]0.2795[/C][C]0.390283[/C][/ROW]
[ROW][C]24[/C][C]0.004531[/C][C]0.0415[/C][C]0.483486[/C][/ROW]
[ROW][C]25[/C][C]-0.142214[/C][C]-1.3034[/C][C]0.097998[/C][/ROW]
[ROW][C]26[/C][C]-0.081253[/C][C]-0.7447[/C][C]0.229267[/C][/ROW]
[ROW][C]27[/C][C]0.086552[/C][C]0.7933[/C][C]0.21493[/C][/ROW]
[ROW][C]28[/C][C]-0.089755[/C][C]-0.8226[/C][C]0.206526[/C][/ROW]
[ROW][C]29[/C][C]-0.019526[/C][C]-0.179[/C][C]0.429199[/C][/ROW]
[ROW][C]30[/C][C]-0.107509[/C][C]-0.9853[/C][C]0.163643[/C][/ROW]
[ROW][C]31[/C][C]0.134002[/C][C]1.2281[/C][C]0.111411[/C][/ROW]
[ROW][C]32[/C][C]-0.087767[/C][C]-0.8044[/C][C]0.21172[/C][/ROW]
[ROW][C]33[/C][C]-0.096548[/C][C]-0.8849[/C][C]0.189374[/C][/ROW]
[ROW][C]34[/C][C]-0.066841[/C][C]-0.6126[/C][C]0.270896[/C][/ROW]
[ROW][C]35[/C][C]0.040421[/C][C]0.3705[/C][C]0.355984[/C][/ROW]
[ROW][C]36[/C][C]-0.095767[/C][C]-0.8777[/C][C]0.1913[/C][/ROW]
[ROW][C]37[/C][C]0.103706[/C][C]0.9505[/C][C]0.172297[/C][/ROW]
[ROW][C]38[/C][C]0.008148[/C][C]0.0747[/C][C]0.470324[/C][/ROW]
[ROW][C]39[/C][C]-0.009531[/C][C]-0.0874[/C][C]0.465298[/C][/ROW]
[ROW][C]40[/C][C]0.014465[/C][C]0.1326[/C][C]0.447422[/C][/ROW]
[ROW][C]41[/C][C]-0.054536[/C][C]-0.4998[/C][C]0.30925[/C][/ROW]
[ROW][C]42[/C][C]-0.04456[/C][C]-0.4084[/C][C]0.342011[/C][/ROW]
[ROW][C]43[/C][C]0.070956[/C][C]0.6503[/C][C]0.258629[/C][/ROW]
[ROW][C]44[/C][C]-0.03593[/C][C]-0.3293[/C][C]0.371374[/C][/ROW]
[ROW][C]45[/C][C]0.000124[/C][C]0.0011[/C][C]0.499548[/C][/ROW]
[ROW][C]46[/C][C]-0.031907[/C][C]-0.2924[/C][C]0.385338[/C][/ROW]
[ROW][C]47[/C][C]0.011536[/C][C]0.1057[/C][C]0.458026[/C][/ROW]
[ROW][C]48[/C][C]-0.085711[/C][C]-0.7856[/C][C]0.21717[/C][/ROW]
[/TABLE]
Source: https://freestatistics.org/blog/index.php?pk=113813&T=2

Globally Unique Identifier (entire table): ba.freestatistics.org/blog/index.php?pk=113813&T=2

As an alternative you can also use a QR Code:  

The GUIDs for individual cells are displayed in the table below:

Partial Autocorrelation Function
Time lag kPACF(k)T-STATP-value
1-0.162253-1.48710.07037
2-0.27438-2.51470.006909
30.7686517.04480
4-0.437557-4.01036.5e-05
50.111331.02040.155245
60.0560930.51410.304265
7-0.102806-0.94220.174388
80.1441891.32150.09496
90.228752.09650.019522
100.1752821.60650.05596
110.2304752.11230.018813
120.1575571.4440.076225
130.0158380.14520.442468
14-0.070984-0.65060.258548
15-0.09516-0.87220.192805
16-0.142364-1.30480.097765
17-0.090936-0.83340.20348
18-0.08495-0.77860.219209
19-0.019235-0.17630.430246
20-0.068541-0.62820.265793
21-0.062723-0.57490.28346
220.0287590.26360.396374
230.0304930.27950.390283
240.0045310.04150.483486
25-0.142214-1.30340.097998
26-0.081253-0.74470.229267
270.0865520.79330.21493
28-0.089755-0.82260.206526
29-0.019526-0.1790.429199
30-0.107509-0.98530.163643
310.1340021.22810.111411
32-0.087767-0.80440.21172
33-0.096548-0.88490.189374
34-0.066841-0.61260.270896
350.0404210.37050.355984
36-0.095767-0.87770.1913
370.1037060.95050.172297
380.0081480.07470.470324
39-0.009531-0.08740.465298
400.0144650.13260.447422
41-0.054536-0.49980.30925
42-0.04456-0.40840.342011
430.0709560.65030.258629
44-0.03593-0.32930.371374
450.0001240.00110.499548
46-0.031907-0.29240.385338
470.0115360.10570.458026
48-0.085711-0.78560.21717


Parameters (Session):
par1 = 48 ; par2 = 1 ; par3 = 0 ; par4 = 0 ; par5 = 12 ; par6 = White Noise ; par7 = 0.95 ;
Parameters (R input):
par1 = 48 ; par2 = 1 ; par3 = 0 ; par4 = 0 ; par5 = 12 ; par6 = White Noise ; par7 = 0.95 ; par8 = ;
R code (references can be found in the software module):
if (par1 == 'Default') {
par1 = 10*log10(length(x))
} else {
par1 <- as.numeric(par1)
}
par2 <- as.numeric(par2)
par3 <- as.numeric(par3)
par4 <- as.numeric(par4)
par5 <- as.numeric(par5)
if (par6 == 'White Noise') par6 <- 'white' else par6 <- 'ma'
par7 <- as.numeric(par7)
if (par8 != '') par8 <- as.numeric(par8)
ox <- x
if (par8 == '') {
if (par2 == 0) {
x <- log(x)
} else {
x <- (x ^ par2 - 1) / par2
}
} else {
x <- log(x,base=par8)
}
if (par3 > 0) x <- diff(x,lag=1,difference=par3)
if (par4 > 0) x <- diff(x,lag=par5,difference=par4)
bitmap(file='picts.png')
op <- par(mfrow=c(2,1))
plot(ox,type='l',main='Original Time Series',xlab='time',ylab='value')
if (par8=='') {
mytitle <- paste('Working Time Series (lambda=',par2,', d=',par3,', D=',par4,')',sep='')
mysub <- paste('(lambda=',par2,', d=',par3,', D=',par4,', CI=', par7, ', CI type=',par6,')',sep='')
} else {
mytitle <- paste('Working Time Series (base=',par8,', d=',par3,', D=',par4,')',sep='')
mysub <- paste('(base=',par8,', d=',par3,', D=',par4,', CI=', par7, ', CI type=',par6,')',sep='')
}
plot(x,type='l', main=mytitle,xlab='time',ylab='value')
par(op)
dev.off()
bitmap(file='pic1.png')
racf <- acf(x, par1, main='Autocorrelation', xlab='time lag', ylab='ACF', ci.type=par6, ci=par7, sub=mysub)
dev.off()
bitmap(file='pic2.png')
rpacf <- pacf(x,par1,main='Partial Autocorrelation',xlab='lags',ylab='PACF',sub=mysub)
dev.off()
(myacf <- c(racf$acf))
(mypacf <- c(rpacf$acf))
lengthx <- length(x)
sqrtn <- sqrt(lengthx)
load(file='createtable')
a<-table.start()
a<-table.row.start(a)
a<-table.element(a,'Autocorrelation Function',4,TRUE)
a<-table.row.end(a)
a<-table.row.start(a)
a<-table.element(a,'Time lag k',header=TRUE)
a<-table.element(a,hyperlink('basics.htm','ACF(k)','click here for more information about the Autocorrelation Function'),header=TRUE)
a<-table.element(a,'T-STAT',header=TRUE)
a<-table.element(a,'P-value',header=TRUE)
a<-table.row.end(a)
for (i in 2:(par1+1)) {
a<-table.row.start(a)
a<-table.element(a,i-1,header=TRUE)
a<-table.element(a,round(myacf[i],6))
mytstat <- myacf[i]*sqrtn
a<-table.element(a,round(mytstat,4))
a<-table.element(a,round(1-pt(abs(mytstat),lengthx),6))
a<-table.row.end(a)
}
a<-table.end(a)
table.save(a,file='mytable.tab')
a<-table.start()
a<-table.row.start(a)
a<-table.element(a,'Partial Autocorrelation Function',4,TRUE)
a<-table.row.end(a)
a<-table.row.start(a)
a<-table.element(a,'Time lag k',header=TRUE)
a<-table.element(a,hyperlink('basics.htm','PACF(k)','click here for more information about the Partial Autocorrelation Function'),header=TRUE)
a<-table.element(a,'T-STAT',header=TRUE)
a<-table.element(a,'P-value',header=TRUE)
a<-table.row.end(a)
for (i in 1:par1) {
a<-table.row.start(a)
a<-table.element(a,i,header=TRUE)
a<-table.element(a,round(mypacf[i],6))
mytstat <- mypacf[i]*sqrtn
a<-table.element(a,round(mytstat,4))
a<-table.element(a,round(1-pt(abs(mytstat),lengthx),6))
a<-table.row.end(a)
}
a<-table.end(a)
table.save(a,file='mytable1.tab')