Free Statistics
of Irreproducible Research!
Description of Statistical Computation | |||||||||||||||||||||||||||||||||||||||||
|---|---|---|---|---|---|---|---|---|---|---|---|---|---|---|---|---|---|---|---|---|---|---|---|---|---|---|---|---|---|---|---|---|---|---|---|---|---|---|---|---|---|
| Author's title | |||||||||||||||||||||||||||||||||||||||||
| Author | *Unverified author* | ||||||||||||||||||||||||||||||||||||||||
| R Software Module | rwasp_univariatedataseries.wasp | ||||||||||||||||||||||||||||||||||||||||
| Title produced by software | Univariate Data Series | ||||||||||||||||||||||||||||||||||||||||
| Date of computation | Wed, 17 Feb 2010 07:37:11 -0700 | ||||||||||||||||||||||||||||||||||||||||
| Cite this page as follows | Statistical Computations at FreeStatistics.org, Office for Research Development and Education, URL https://freestatistics.org/blog/index.php?v=date/2010/Feb/17/t1266417619gj9yiqsjg4cml69.htm/, Retrieved Fri, 26 Apr 2024 17:18:01 +0000 | ||||||||||||||||||||||||||||||||||||||||
| Statistical Computations at FreeStatistics.org, Office for Research Development and Education, URL https://freestatistics.org/blog/index.php?pk=73164, Retrieved Fri, 26 Apr 2024 17:18:01 +0000 | |||||||||||||||||||||||||||||||||||||||||
| QR Codes: | |||||||||||||||||||||||||||||||||||||||||
|
| |||||||||||||||||||||||||||||||||||||||||
| Original text written by user: | |||||||||||||||||||||||||||||||||||||||||
| IsPrivate? | No (this computation is public) | ||||||||||||||||||||||||||||||||||||||||
| User-defined keywords | KDGP1W1 | ||||||||||||||||||||||||||||||||||||||||
| Estimated Impact | 253 | ||||||||||||||||||||||||||||||||||||||||
Tree of Dependent Computations | |||||||||||||||||||||||||||||||||||||||||
| Family? (F = Feedback message, R = changed R code, M = changed R Module, P = changed Parameters, D = changed Data) | |||||||||||||||||||||||||||||||||||||||||
| - [Univariate Data Series] [The total generat...] [2010-02-17 14:37:11] [0e6aef37627b8cf9d1bd74110cef2cca] [Current] | |||||||||||||||||||||||||||||||||||||||||
| Feedback Forum | |||||||||||||||||||||||||||||||||||||||||
Post a new message | |||||||||||||||||||||||||||||||||||||||||
Dataset | |||||||||||||||||||||||||||||||||||||||||
| Dataseries X: | |||||||||||||||||||||||||||||||||||||||||
227.86 198.24 194.97 184.88 196.79 205.36 226.72 226.05 202.50 194.79 192.43 219.25 217.47 192.34 196.83 186.07 197.31 215.02 242.67 225.17 206.69 197.75 196.43 213.55 222.75 194.03 201.85 189.50 206.07 225.59 247.91 247.64 213.01 203.01 200.26 220.50 237.90 216.94 214.01 196.00 208.37 232.75 257.46 267.69 220.18 210.61 209.59 232.75 232.75 219.82 226.74 208.04 220.12 235.69 257.05 258.69 227.15 219.91 219.30 259.04 237.29 212.88 226.03 211.07 222.91 249.18 266.38 268.53 238.02 224.69 213.75 237.43 248.46 210.82 221.40 209.00 234.37 248.43 271.98 268.11 233.88 223.43 221.38 233.76 243.97 217.76 224.66 210.84 220.35 236.84 266.15 255.20 234.76 221.29 221.26 244.13 245.78 224.62 234.80 211.37 222.39 249.63 282.29 279.13 236.60 223.62 225.86 246.41 261.70 225.01 231.54 214.82 227.70 263.86 278.15 274.64 237.66 227.97 224.75 242.91 253.08 228.13 233.68 217.38 236.38 256.08 292.83 304.71 245.57 234.41 234.12 258.17 268.66 245.31 247.47 226.25 251.67 268.79 288.94 290.16 250.69 240.80 | |||||||||||||||||||||||||||||||||||||||||
Tables (Output of Computation) | |||||||||||||||||||||||||||||||||||||||||
| |||||||||||||||||||||||||||||||||||||||||
Figures (Output of Computation) | |||||||||||||||||||||||||||||||||||||||||
Input Parameters & R Code | |||||||||||||||||||||||||||||||||||||||||
| Parameters (Session): | |||||||||||||||||||||||||||||||||||||||||
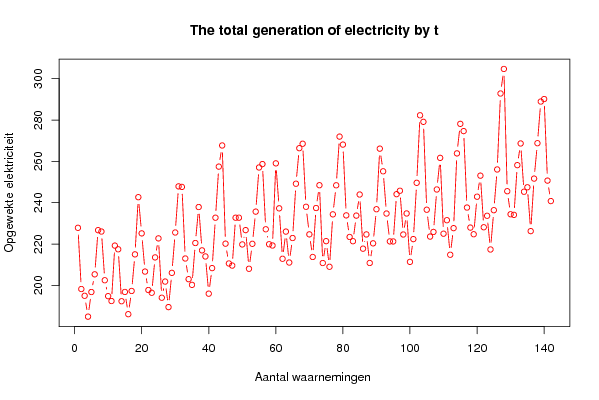
| par1 = The total generation of electricity by the U.S. electric industry ; par2 = http://www.robjhyndman.com/TSDL/index.htm ; par3 = The total generation of electricity by the U.S. electric industry (monthly data for the period Jan. 1985 - Oct. 1996) ; | |||||||||||||||||||||||||||||||||||||||||
| Parameters (R input): | |||||||||||||||||||||||||||||||||||||||||
| par1 = The total generation of electricity by the U.S. electric industry ; par2 = http://www.robjhyndman.com/TSDL/index.htm ; par3 = The total generation of electricity by the U.S. electric industry (monthly data for the period Jan. 1985 - Oct. 1996) ; | |||||||||||||||||||||||||||||||||||||||||
| R code (references can be found in the software module): | |||||||||||||||||||||||||||||||||||||||||
bitmap(file='test1.png') | |||||||||||||||||||||||||||||||||||||||||