library(digest)
myran <- runif(1)
if (myran <= 1) {
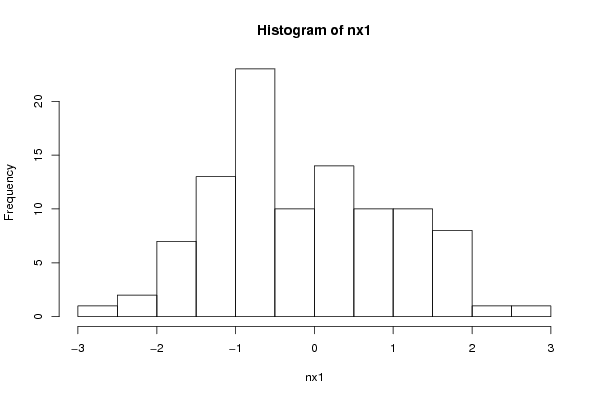
nx1 <- rnorm(100)
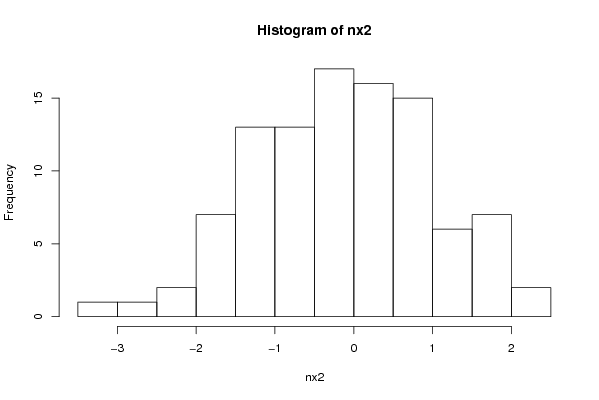
nx2 <- rnorm(100, sd=1.0, mean=0.0)
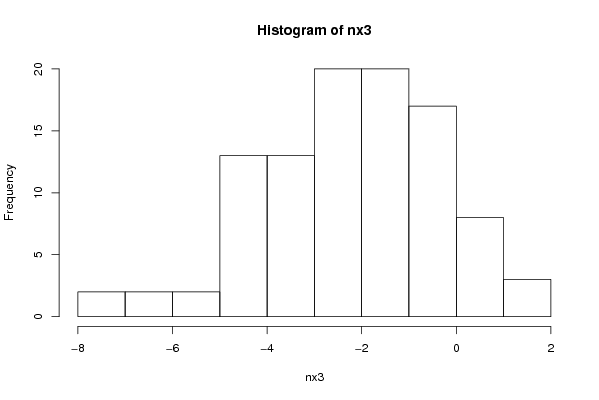
nx3 <- rnorm(100, sd=2.0, mean=-2.0)
answer <- 'nx3'
}
if (myran < 0.66) {
nx2 <- rnorm(100)
nx3 <- rnorm(100, sd=1.0, mean=0.0)
nx1 <- rnorm(100, sd=2.0, mean=-2.0)
answer <- 'nx1'
}
if (myran < 0.33) {
nx3 <- rnorm(100)
nx1 <- rnorm(100, sd=1.0, mean=0.0)
nx2 <- rnorm(100, sd=2.0, mean=-2.0)
answer <- 'nx2'
}
answer <- digest(answer,ser=F)
allmeans<- c(mean(nx1),mean(nx2),mean(nx3))
names(allmeans)<-c('Sample 1', 'Sample 2', 'Sample 3')
allmeans
allsd<- c(sd(nx1), sd(nx2), sd(nx3))
names(allsd)<- c('Sample 1', 'Sample 2', 'Sample 3')
allsd
load(file='createtable')
a<-table.start()
a<-table.row.start(a)
a<-table.element(a,'Identify the sample least likely to be from a standard normal distribution.',1,TRUE)
a<-table.row.end(a)
a<-table.row.start(a)
a<-table.element(a,hyperlink(paste('https://automated.biganalytics.eu/Ian.Holliday/rwasp_May_mock2.wasp?par1=',par1,'&par2=nx1&par3=',answer,'&par0=1',sep=''),'The sample called nx1','',target=''))
a<-table.row.end(a)
a<-table.row.start(a)
a<-table.element(a,hyperlink(paste('https://automated.biganalytics.eu/Ian.Holliday/rwasp_May_mock2.wasp?par1=',par1,'&par2=nx2&par3=',answer,'&par0=1',sep=''),'The sample called nx2','',target=''))
a<-table.row.end(a)
a<-table.row.start(a)
a<-table.element(a,hyperlink(paste('https://automated.biganalytics.eu/Ian.Holliday/rwasp_May_mock2.wasp?par1=',par1,'&par2=nx3&par3=',answer,'&par0=1',sep=''),'The sample called nx3','',target=''))
a<-table.row.end(a)
a<-table.row.start(a)
a<-table.element(a,hyperlink(paste('https://automated.biganalytics.eu/Ian.Holliday/rwasp_May_mock2.wasp?par1=',par1,'&par2=wnga&par3=',answer,'&par0=1',sep=''),'Avoid Guessing Penalty','',target=''))
a<-table.row.end(a)
a<-table.end(a)
table.save(a,file='mytable1.tab')
a<-table.start()
a<-table.row.start(a)
a<-table.element(a,'Means of the three samples',4,TRUE)
a<-table.row.end(a)
a<-table.row.start(a)
a<-table.element(a,'Sample',1,TRUE)
a<-table.element(a,'nx1',1,TRUE)
a<-table.element(a,'nx2',1,TRUE)
a<-table.element(a,'nx3',1,TRUE)
a<-table.row.end(a)
a<-table.row.start(a)
a<-table.element(a,'Value',1,TRUE)
a<-table.element(a,round(mean(nx1),3))
a<-table.element(a,round(mean(nx2),3))
a<-table.element(a,round(mean(nx3),3))
a<-table.row.end(a)
a<-table.end(a)
table.save(a,file='mytable2.tab')
a<-table.start()
a<-table.row.start(a)
a<-table.element(a,'Standard deviations of the three samples',4,TRUE)
a<-table.row.end(a)
a<-table.row.start(a)
a<-table.element(a,'Sample',1,TRUE)
a<-table.element(a,'nx1',1,TRUE)
a<-table.element(a,'nx2',1,TRUE)
a<-table.element(a,'nx3',1,TRUE)
a<-table.row.end(a)
a<-table.row.start(a)
a<-table.element(a,'Value',1,TRUE)
a<-table.element(a,round(sd(nx1),3))
a<-table.element(a,round(sd(nx2),3))
a<-table.element(a,round(sd(nx3),3))
a<-table.row.end(a)
a<-table.end(a)
table.save(a,file='mytable3.tab')
bitmap(file='hist1.png')
hist(nx1)
dev.off()
bitmap(file='hist2.png')
hist(nx2)
dev.off()
bitmap(file='hist3.png')
hist(nx3)
dev.off()
bitmap(file='pairs.png')
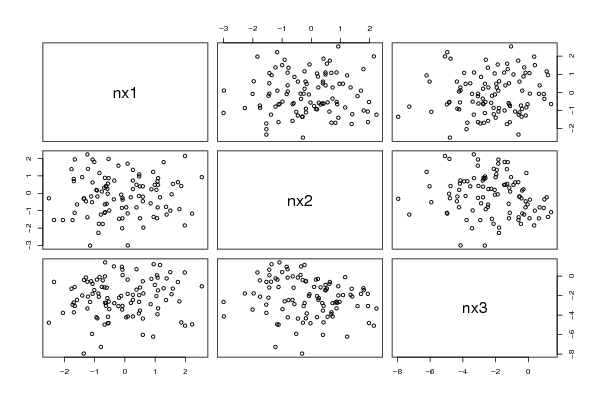
pairs(x=cbind(nx1, nx2, nx3))
dev.off()
|