Free Statistics

of Irreproducible Research!

Author's title

Author*Unverified author*
R Software Modulerwasp_autocorrelation.wasp
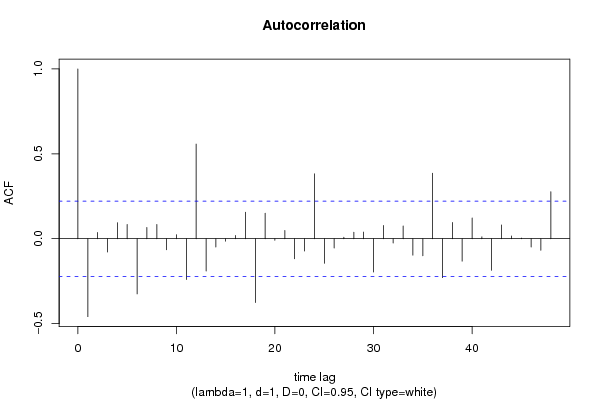
Title produced by software(Partial) Autocorrelation Function
Date of computationWed, 02 Jun 2010 15:19:05 +0000
Cite this page as followsStatistical Computations at FreeStatistics.org, Office for Research Development and Education, URL https://freestatistics.org/blog/index.php?v=date/2010/Jun/02/t1275491993gfoem7bais37ss7.htm/, Retrieved Sat, 27 Apr 2024 05:14:25 +0000
Statistical Computations at FreeStatistics.org, Office for Research Development and Education, URL https://freestatistics.org/blog/index.php?pk=77308, Retrieved Sat, 27 Apr 2024 05:14:25 +0000
QR Codes:

Original text written by user:
IsPrivate?No (this computation is public)
User-defined keywordsKDGP2W21
Estimated Impact129
Family? (F = Feedback message, R = changed R code, M = changed R Module, P = changed Parameters, D = changed Data)
-       [(Partial) Autocorrelation Function] [] [2010-06-02 15:19:05] [850dbf9e683f79d78a1e8310559edb6e] [Current]
Feedback Forum

Post a new message
Dataseries X:
306
303
344
254
309
310
379
294
356
318
405
545
268
243
273
273
236
222
302
285
309
322
362
471
198
253
173
186
185
105
228
214
189
270
277
378
185
182
258
179
197
168
250
211
260
234
305
347
203
217
227
242
185
175
252
319
202
254
336
431
150
280
187
279
193
227
225
205
259
254
275
394
159
230
188
195
189
220
274


Summary of computational transaction
Raw Inputview raw input (R code)
Raw Outputview raw output of R engine
Computing time1 seconds
R Server'RServer@AstonUniversity' @ vre.aston.ac.uk

\begin{tabular}{lllllllll}
\hline
Summary of computational transaction \tabularnewline
Raw Input & view raw input (R code)  \tabularnewline
Raw Output & view raw output of R engine  \tabularnewline
Computing time & 1 seconds \tabularnewline
R Server & 'RServer@AstonUniversity' @ vre.aston.ac.uk \tabularnewline
\hline
\end{tabular}
%Source: https://freestatistics.org/blog/index.php?pk=77308&T=0

[TABLE]
[ROW][C]Summary of computational transaction[/C][/ROW]
[ROW][C]Raw Input[/C][C]view raw input (R code) [/C][/ROW]
[ROW][C]Raw Output[/C][C]view raw output of R engine [/C][/ROW]
[ROW][C]Computing time[/C][C]1 seconds[/C][/ROW]
[ROW][C]R Server[/C][C]'RServer@AstonUniversity' @ vre.aston.ac.uk[/C][/ROW]
[/TABLE]
Source: https://freestatistics.org/blog/index.php?pk=77308&T=0

Globally Unique Identifier (entire table): ba.freestatistics.org/blog/index.php?pk=77308&T=0

As an alternative you can also use a QR Code:  

The GUIDs for individual cells are displayed in the table below:

Summary of computational transaction
Raw Inputview raw input (R code)
Raw Outputview raw output of R engine
Computing time1 seconds
R Server'RServer@AstonUniversity' @ vre.aston.ac.uk


Autocorrelation Function
Time lag kACF(k)T-STATP-value
1-0.458833-4.05235.9e-05
20.0366510.32370.373517
3-0.078186-0.69050.245959
40.094710.83650.202726
50.0836070.73840.231244
6-0.324911-2.86950.002644
70.0662750.58530.280009
80.0836720.7390.231073
9-0.06547-0.57820.282392
100.0236820.20920.417435
11-0.240383-2.1230.018463
120.5575634.92432e-06
13-0.19013-1.67920.048559
14-0.048999-0.43270.333196
15-0.014256-0.12590.450064
160.0194230.17150.432121
170.1559371.37720.086195
18-0.375393-3.31540.000695
190.1505581.32970.093748
20-0.008679-0.07660.469549
210.0485160.42850.33474
22-0.117698-1.03950.150897
23-0.072712-0.64220.261323
240.382093.37450.000577
25-0.145008-1.28070.102051
26-0.054462-0.4810.315934
270.0088240.07790.469042
280.0383610.33880.367836
290.0392880.3470.364771
30-0.19581-1.72930.043852
310.0777210.68640.247244
32-0.025682-0.22680.410581
330.0754450.66630.253589
34-0.096654-0.85360.197963
35-0.100546-0.8880.188635
360.3855843.40540.000523
37-0.229193-2.02420.023188
380.0963550.8510.198691
39-0.131855-1.16450.123884
400.1226631.08330.140999
410.0112390.09930.460593
42-0.185535-1.63860.052662
430.0810.71540.238258
440.0161980.14310.443308
450.0038610.03410.486443
46-0.049089-0.43350.332907
47-0.068201-0.60230.27435
480.2764842.44180.008438

\begin{tabular}{lllllllll}
\hline
Autocorrelation Function \tabularnewline
Time lag k & ACF(k) & T-STAT & P-value \tabularnewline
1 & -0.458833 & -4.0523 & 5.9e-05 \tabularnewline
2 & 0.036651 & 0.3237 & 0.373517 \tabularnewline
3 & -0.078186 & -0.6905 & 0.245959 \tabularnewline
4 & 0.09471 & 0.8365 & 0.202726 \tabularnewline
5 & 0.083607 & 0.7384 & 0.231244 \tabularnewline
6 & -0.324911 & -2.8695 & 0.002644 \tabularnewline
7 & 0.066275 & 0.5853 & 0.280009 \tabularnewline
8 & 0.083672 & 0.739 & 0.231073 \tabularnewline
9 & -0.06547 & -0.5782 & 0.282392 \tabularnewline
10 & 0.023682 & 0.2092 & 0.417435 \tabularnewline
11 & -0.240383 & -2.123 & 0.018463 \tabularnewline
12 & 0.557563 & 4.9243 & 2e-06 \tabularnewline
13 & -0.19013 & -1.6792 & 0.048559 \tabularnewline
14 & -0.048999 & -0.4327 & 0.333196 \tabularnewline
15 & -0.014256 & -0.1259 & 0.450064 \tabularnewline
16 & 0.019423 & 0.1715 & 0.432121 \tabularnewline
17 & 0.155937 & 1.3772 & 0.086195 \tabularnewline
18 & -0.375393 & -3.3154 & 0.000695 \tabularnewline
19 & 0.150558 & 1.3297 & 0.093748 \tabularnewline
20 & -0.008679 & -0.0766 & 0.469549 \tabularnewline
21 & 0.048516 & 0.4285 & 0.33474 \tabularnewline
22 & -0.117698 & -1.0395 & 0.150897 \tabularnewline
23 & -0.072712 & -0.6422 & 0.261323 \tabularnewline
24 & 0.38209 & 3.3745 & 0.000577 \tabularnewline
25 & -0.145008 & -1.2807 & 0.102051 \tabularnewline
26 & -0.054462 & -0.481 & 0.315934 \tabularnewline
27 & 0.008824 & 0.0779 & 0.469042 \tabularnewline
28 & 0.038361 & 0.3388 & 0.367836 \tabularnewline
29 & 0.039288 & 0.347 & 0.364771 \tabularnewline
30 & -0.19581 & -1.7293 & 0.043852 \tabularnewline
31 & 0.077721 & 0.6864 & 0.247244 \tabularnewline
32 & -0.025682 & -0.2268 & 0.410581 \tabularnewline
33 & 0.075445 & 0.6663 & 0.253589 \tabularnewline
34 & -0.096654 & -0.8536 & 0.197963 \tabularnewline
35 & -0.100546 & -0.888 & 0.188635 \tabularnewline
36 & 0.385584 & 3.4054 & 0.000523 \tabularnewline
37 & -0.229193 & -2.0242 & 0.023188 \tabularnewline
38 & 0.096355 & 0.851 & 0.198691 \tabularnewline
39 & -0.131855 & -1.1645 & 0.123884 \tabularnewline
40 & 0.122663 & 1.0833 & 0.140999 \tabularnewline
41 & 0.011239 & 0.0993 & 0.460593 \tabularnewline
42 & -0.185535 & -1.6386 & 0.052662 \tabularnewline
43 & 0.081 & 0.7154 & 0.238258 \tabularnewline
44 & 0.016198 & 0.1431 & 0.443308 \tabularnewline
45 & 0.003861 & 0.0341 & 0.486443 \tabularnewline
46 & -0.049089 & -0.4335 & 0.332907 \tabularnewline
47 & -0.068201 & -0.6023 & 0.27435 \tabularnewline
48 & 0.276484 & 2.4418 & 0.008438 \tabularnewline
\hline
\end{tabular}
%Source: https://freestatistics.org/blog/index.php?pk=77308&T=1

[TABLE]
[ROW][C]Autocorrelation Function[/C][/ROW]
[ROW][C]Time lag k[/C][C]ACF(k)[/C][C]T-STAT[/C][C]P-value[/C][/ROW]
[ROW][C]1[/C][C]-0.458833[/C][C]-4.0523[/C][C]5.9e-05[/C][/ROW]
[ROW][C]2[/C][C]0.036651[/C][C]0.3237[/C][C]0.373517[/C][/ROW]
[ROW][C]3[/C][C]-0.078186[/C][C]-0.6905[/C][C]0.245959[/C][/ROW]
[ROW][C]4[/C][C]0.09471[/C][C]0.8365[/C][C]0.202726[/C][/ROW]
[ROW][C]5[/C][C]0.083607[/C][C]0.7384[/C][C]0.231244[/C][/ROW]
[ROW][C]6[/C][C]-0.324911[/C][C]-2.8695[/C][C]0.002644[/C][/ROW]
[ROW][C]7[/C][C]0.066275[/C][C]0.5853[/C][C]0.280009[/C][/ROW]
[ROW][C]8[/C][C]0.083672[/C][C]0.739[/C][C]0.231073[/C][/ROW]
[ROW][C]9[/C][C]-0.06547[/C][C]-0.5782[/C][C]0.282392[/C][/ROW]
[ROW][C]10[/C][C]0.023682[/C][C]0.2092[/C][C]0.417435[/C][/ROW]
[ROW][C]11[/C][C]-0.240383[/C][C]-2.123[/C][C]0.018463[/C][/ROW]
[ROW][C]12[/C][C]0.557563[/C][C]4.9243[/C][C]2e-06[/C][/ROW]
[ROW][C]13[/C][C]-0.19013[/C][C]-1.6792[/C][C]0.048559[/C][/ROW]
[ROW][C]14[/C][C]-0.048999[/C][C]-0.4327[/C][C]0.333196[/C][/ROW]
[ROW][C]15[/C][C]-0.014256[/C][C]-0.1259[/C][C]0.450064[/C][/ROW]
[ROW][C]16[/C][C]0.019423[/C][C]0.1715[/C][C]0.432121[/C][/ROW]
[ROW][C]17[/C][C]0.155937[/C][C]1.3772[/C][C]0.086195[/C][/ROW]
[ROW][C]18[/C][C]-0.375393[/C][C]-3.3154[/C][C]0.000695[/C][/ROW]
[ROW][C]19[/C][C]0.150558[/C][C]1.3297[/C][C]0.093748[/C][/ROW]
[ROW][C]20[/C][C]-0.008679[/C][C]-0.0766[/C][C]0.469549[/C][/ROW]
[ROW][C]21[/C][C]0.048516[/C][C]0.4285[/C][C]0.33474[/C][/ROW]
[ROW][C]22[/C][C]-0.117698[/C][C]-1.0395[/C][C]0.150897[/C][/ROW]
[ROW][C]23[/C][C]-0.072712[/C][C]-0.6422[/C][C]0.261323[/C][/ROW]
[ROW][C]24[/C][C]0.38209[/C][C]3.3745[/C][C]0.000577[/C][/ROW]
[ROW][C]25[/C][C]-0.145008[/C][C]-1.2807[/C][C]0.102051[/C][/ROW]
[ROW][C]26[/C][C]-0.054462[/C][C]-0.481[/C][C]0.315934[/C][/ROW]
[ROW][C]27[/C][C]0.008824[/C][C]0.0779[/C][C]0.469042[/C][/ROW]
[ROW][C]28[/C][C]0.038361[/C][C]0.3388[/C][C]0.367836[/C][/ROW]
[ROW][C]29[/C][C]0.039288[/C][C]0.347[/C][C]0.364771[/C][/ROW]
[ROW][C]30[/C][C]-0.19581[/C][C]-1.7293[/C][C]0.043852[/C][/ROW]
[ROW][C]31[/C][C]0.077721[/C][C]0.6864[/C][C]0.247244[/C][/ROW]
[ROW][C]32[/C][C]-0.025682[/C][C]-0.2268[/C][C]0.410581[/C][/ROW]
[ROW][C]33[/C][C]0.075445[/C][C]0.6663[/C][C]0.253589[/C][/ROW]
[ROW][C]34[/C][C]-0.096654[/C][C]-0.8536[/C][C]0.197963[/C][/ROW]
[ROW][C]35[/C][C]-0.100546[/C][C]-0.888[/C][C]0.188635[/C][/ROW]
[ROW][C]36[/C][C]0.385584[/C][C]3.4054[/C][C]0.000523[/C][/ROW]
[ROW][C]37[/C][C]-0.229193[/C][C]-2.0242[/C][C]0.023188[/C][/ROW]
[ROW][C]38[/C][C]0.096355[/C][C]0.851[/C][C]0.198691[/C][/ROW]
[ROW][C]39[/C][C]-0.131855[/C][C]-1.1645[/C][C]0.123884[/C][/ROW]
[ROW][C]40[/C][C]0.122663[/C][C]1.0833[/C][C]0.140999[/C][/ROW]
[ROW][C]41[/C][C]0.011239[/C][C]0.0993[/C][C]0.460593[/C][/ROW]
[ROW][C]42[/C][C]-0.185535[/C][C]-1.6386[/C][C]0.052662[/C][/ROW]
[ROW][C]43[/C][C]0.081[/C][C]0.7154[/C][C]0.238258[/C][/ROW]
[ROW][C]44[/C][C]0.016198[/C][C]0.1431[/C][C]0.443308[/C][/ROW]
[ROW][C]45[/C][C]0.003861[/C][C]0.0341[/C][C]0.486443[/C][/ROW]
[ROW][C]46[/C][C]-0.049089[/C][C]-0.4335[/C][C]0.332907[/C][/ROW]
[ROW][C]47[/C][C]-0.068201[/C][C]-0.6023[/C][C]0.27435[/C][/ROW]
[ROW][C]48[/C][C]0.276484[/C][C]2.4418[/C][C]0.008438[/C][/ROW]
[/TABLE]
Source: https://freestatistics.org/blog/index.php?pk=77308&T=1

Globally Unique Identifier (entire table): ba.freestatistics.org/blog/index.php?pk=77308&T=1

As an alternative you can also use a QR Code:  

The GUIDs for individual cells are displayed in the table below:

Autocorrelation Function
Time lag kACF(k)T-STATP-value
1-0.458833-4.05235.9e-05
20.0366510.32370.373517
3-0.078186-0.69050.245959
40.094710.83650.202726
50.0836070.73840.231244
6-0.324911-2.86950.002644
70.0662750.58530.280009
80.0836720.7390.231073
9-0.06547-0.57820.282392
100.0236820.20920.417435
11-0.240383-2.1230.018463
120.5575634.92432e-06
13-0.19013-1.67920.048559
14-0.048999-0.43270.333196
15-0.014256-0.12590.450064
160.0194230.17150.432121
170.1559371.37720.086195
18-0.375393-3.31540.000695
190.1505581.32970.093748
20-0.008679-0.07660.469549
210.0485160.42850.33474
22-0.117698-1.03950.150897
23-0.072712-0.64220.261323
240.382093.37450.000577
25-0.145008-1.28070.102051
26-0.054462-0.4810.315934
270.0088240.07790.469042
280.0383610.33880.367836
290.0392880.3470.364771
30-0.19581-1.72930.043852
310.0777210.68640.247244
32-0.025682-0.22680.410581
330.0754450.66630.253589
34-0.096654-0.85360.197963
35-0.100546-0.8880.188635
360.3855843.40540.000523
37-0.229193-2.02420.023188
380.0963550.8510.198691
39-0.131855-1.16450.123884
400.1226631.08330.140999
410.0112390.09930.460593
42-0.185535-1.63860.052662
430.0810.71540.238258
440.0161980.14310.443308
450.0038610.03410.486443
46-0.049089-0.43350.332907
47-0.068201-0.60230.27435
480.2764842.44180.008438


Partial Autocorrelation Function
Time lag kPACF(k)T-STATP-value
1-0.458833-4.05235.9e-05
2-0.220243-1.94510.027681
3-0.211295-1.86610.032893
4-0.051898-0.45840.323988
50.1387751.22560.112013
6-0.279288-2.46660.007917
7-0.31086-2.74540.003749
8-0.134795-1.19050.118735
9-0.228583-2.01880.023473
10-0.149689-1.3220.095012
11-0.48291-4.26492.8e-05
120.1100230.97170.167104
130.1975711.74490.04247
140.0738890.65260.257976
150.0685780.60570.273248
16-0.045736-0.40390.343684
170.0856240.75620.225901
18-0.107708-0.95130.172207
190.044010.38870.349284
20-0.013068-0.11540.454208
210.1140261.00710.158512
22-0.087868-0.7760.220039
23-0.098855-0.87310.192654
240.0613830.54210.294642
25-0.048426-0.42770.335029
26-0.055988-0.49450.311181
27-0.046758-0.4130.340387
280.028550.25210.400797
29-0.209129-1.8470.034272
300.0148390.13110.448035
310.013490.11910.452734
32-0.095098-0.83990.201771
33-0.006816-0.06020.476077
340.0167060.14750.441542
35-0.129634-1.14490.127877
360.0642430.56740.286042
37-0.059149-0.52240.301439
380.0741640.6550.257198
390.0231780.20470.419168
40-0.04114-0.36330.358666
410.0540470.47730.317231
42-0.012638-0.11160.455707
43-0.043788-0.38670.350006
440.0673250.59460.276917
450.0107430.09490.462328
46-0.021942-0.19380.423425
470.0270420.23880.405931
48-0.045782-0.40430.343535

\begin{tabular}{lllllllll}
\hline
Partial Autocorrelation Function \tabularnewline
Time lag k & PACF(k) & T-STAT & P-value \tabularnewline
1 & -0.458833 & -4.0523 & 5.9e-05 \tabularnewline
2 & -0.220243 & -1.9451 & 0.027681 \tabularnewline
3 & -0.211295 & -1.8661 & 0.032893 \tabularnewline
4 & -0.051898 & -0.4584 & 0.323988 \tabularnewline
5 & 0.138775 & 1.2256 & 0.112013 \tabularnewline
6 & -0.279288 & -2.4666 & 0.007917 \tabularnewline
7 & -0.31086 & -2.7454 & 0.003749 \tabularnewline
8 & -0.134795 & -1.1905 & 0.118735 \tabularnewline
9 & -0.228583 & -2.0188 & 0.023473 \tabularnewline
10 & -0.149689 & -1.322 & 0.095012 \tabularnewline
11 & -0.48291 & -4.2649 & 2.8e-05 \tabularnewline
12 & 0.110023 & 0.9717 & 0.167104 \tabularnewline
13 & 0.197571 & 1.7449 & 0.04247 \tabularnewline
14 & 0.073889 & 0.6526 & 0.257976 \tabularnewline
15 & 0.068578 & 0.6057 & 0.273248 \tabularnewline
16 & -0.045736 & -0.4039 & 0.343684 \tabularnewline
17 & 0.085624 & 0.7562 & 0.225901 \tabularnewline
18 & -0.107708 & -0.9513 & 0.172207 \tabularnewline
19 & 0.04401 & 0.3887 & 0.349284 \tabularnewline
20 & -0.013068 & -0.1154 & 0.454208 \tabularnewline
21 & 0.114026 & 1.0071 & 0.158512 \tabularnewline
22 & -0.087868 & -0.776 & 0.220039 \tabularnewline
23 & -0.098855 & -0.8731 & 0.192654 \tabularnewline
24 & 0.061383 & 0.5421 & 0.294642 \tabularnewline
25 & -0.048426 & -0.4277 & 0.335029 \tabularnewline
26 & -0.055988 & -0.4945 & 0.311181 \tabularnewline
27 & -0.046758 & -0.413 & 0.340387 \tabularnewline
28 & 0.02855 & 0.2521 & 0.400797 \tabularnewline
29 & -0.209129 & -1.847 & 0.034272 \tabularnewline
30 & 0.014839 & 0.1311 & 0.448035 \tabularnewline
31 & 0.01349 & 0.1191 & 0.452734 \tabularnewline
32 & -0.095098 & -0.8399 & 0.201771 \tabularnewline
33 & -0.006816 & -0.0602 & 0.476077 \tabularnewline
34 & 0.016706 & 0.1475 & 0.441542 \tabularnewline
35 & -0.129634 & -1.1449 & 0.127877 \tabularnewline
36 & 0.064243 & 0.5674 & 0.286042 \tabularnewline
37 & -0.059149 & -0.5224 & 0.301439 \tabularnewline
38 & 0.074164 & 0.655 & 0.257198 \tabularnewline
39 & 0.023178 & 0.2047 & 0.419168 \tabularnewline
40 & -0.04114 & -0.3633 & 0.358666 \tabularnewline
41 & 0.054047 & 0.4773 & 0.317231 \tabularnewline
42 & -0.012638 & -0.1116 & 0.455707 \tabularnewline
43 & -0.043788 & -0.3867 & 0.350006 \tabularnewline
44 & 0.067325 & 0.5946 & 0.276917 \tabularnewline
45 & 0.010743 & 0.0949 & 0.462328 \tabularnewline
46 & -0.021942 & -0.1938 & 0.423425 \tabularnewline
47 & 0.027042 & 0.2388 & 0.405931 \tabularnewline
48 & -0.045782 & -0.4043 & 0.343535 \tabularnewline
\hline
\end{tabular}
%Source: https://freestatistics.org/blog/index.php?pk=77308&T=2

[TABLE]
[ROW][C]Partial Autocorrelation Function[/C][/ROW]
[ROW][C]Time lag k[/C][C]PACF(k)[/C][C]T-STAT[/C][C]P-value[/C][/ROW]
[ROW][C]1[/C][C]-0.458833[/C][C]-4.0523[/C][C]5.9e-05[/C][/ROW]
[ROW][C]2[/C][C]-0.220243[/C][C]-1.9451[/C][C]0.027681[/C][/ROW]
[ROW][C]3[/C][C]-0.211295[/C][C]-1.8661[/C][C]0.032893[/C][/ROW]
[ROW][C]4[/C][C]-0.051898[/C][C]-0.4584[/C][C]0.323988[/C][/ROW]
[ROW][C]5[/C][C]0.138775[/C][C]1.2256[/C][C]0.112013[/C][/ROW]
[ROW][C]6[/C][C]-0.279288[/C][C]-2.4666[/C][C]0.007917[/C][/ROW]
[ROW][C]7[/C][C]-0.31086[/C][C]-2.7454[/C][C]0.003749[/C][/ROW]
[ROW][C]8[/C][C]-0.134795[/C][C]-1.1905[/C][C]0.118735[/C][/ROW]
[ROW][C]9[/C][C]-0.228583[/C][C]-2.0188[/C][C]0.023473[/C][/ROW]
[ROW][C]10[/C][C]-0.149689[/C][C]-1.322[/C][C]0.095012[/C][/ROW]
[ROW][C]11[/C][C]-0.48291[/C][C]-4.2649[/C][C]2.8e-05[/C][/ROW]
[ROW][C]12[/C][C]0.110023[/C][C]0.9717[/C][C]0.167104[/C][/ROW]
[ROW][C]13[/C][C]0.197571[/C][C]1.7449[/C][C]0.04247[/C][/ROW]
[ROW][C]14[/C][C]0.073889[/C][C]0.6526[/C][C]0.257976[/C][/ROW]
[ROW][C]15[/C][C]0.068578[/C][C]0.6057[/C][C]0.273248[/C][/ROW]
[ROW][C]16[/C][C]-0.045736[/C][C]-0.4039[/C][C]0.343684[/C][/ROW]
[ROW][C]17[/C][C]0.085624[/C][C]0.7562[/C][C]0.225901[/C][/ROW]
[ROW][C]18[/C][C]-0.107708[/C][C]-0.9513[/C][C]0.172207[/C][/ROW]
[ROW][C]19[/C][C]0.04401[/C][C]0.3887[/C][C]0.349284[/C][/ROW]
[ROW][C]20[/C][C]-0.013068[/C][C]-0.1154[/C][C]0.454208[/C][/ROW]
[ROW][C]21[/C][C]0.114026[/C][C]1.0071[/C][C]0.158512[/C][/ROW]
[ROW][C]22[/C][C]-0.087868[/C][C]-0.776[/C][C]0.220039[/C][/ROW]
[ROW][C]23[/C][C]-0.098855[/C][C]-0.8731[/C][C]0.192654[/C][/ROW]
[ROW][C]24[/C][C]0.061383[/C][C]0.5421[/C][C]0.294642[/C][/ROW]
[ROW][C]25[/C][C]-0.048426[/C][C]-0.4277[/C][C]0.335029[/C][/ROW]
[ROW][C]26[/C][C]-0.055988[/C][C]-0.4945[/C][C]0.311181[/C][/ROW]
[ROW][C]27[/C][C]-0.046758[/C][C]-0.413[/C][C]0.340387[/C][/ROW]
[ROW][C]28[/C][C]0.02855[/C][C]0.2521[/C][C]0.400797[/C][/ROW]
[ROW][C]29[/C][C]-0.209129[/C][C]-1.847[/C][C]0.034272[/C][/ROW]
[ROW][C]30[/C][C]0.014839[/C][C]0.1311[/C][C]0.448035[/C][/ROW]
[ROW][C]31[/C][C]0.01349[/C][C]0.1191[/C][C]0.452734[/C][/ROW]
[ROW][C]32[/C][C]-0.095098[/C][C]-0.8399[/C][C]0.201771[/C][/ROW]
[ROW][C]33[/C][C]-0.006816[/C][C]-0.0602[/C][C]0.476077[/C][/ROW]
[ROW][C]34[/C][C]0.016706[/C][C]0.1475[/C][C]0.441542[/C][/ROW]
[ROW][C]35[/C][C]-0.129634[/C][C]-1.1449[/C][C]0.127877[/C][/ROW]
[ROW][C]36[/C][C]0.064243[/C][C]0.5674[/C][C]0.286042[/C][/ROW]
[ROW][C]37[/C][C]-0.059149[/C][C]-0.5224[/C][C]0.301439[/C][/ROW]
[ROW][C]38[/C][C]0.074164[/C][C]0.655[/C][C]0.257198[/C][/ROW]
[ROW][C]39[/C][C]0.023178[/C][C]0.2047[/C][C]0.419168[/C][/ROW]
[ROW][C]40[/C][C]-0.04114[/C][C]-0.3633[/C][C]0.358666[/C][/ROW]
[ROW][C]41[/C][C]0.054047[/C][C]0.4773[/C][C]0.317231[/C][/ROW]
[ROW][C]42[/C][C]-0.012638[/C][C]-0.1116[/C][C]0.455707[/C][/ROW]
[ROW][C]43[/C][C]-0.043788[/C][C]-0.3867[/C][C]0.350006[/C][/ROW]
[ROW][C]44[/C][C]0.067325[/C][C]0.5946[/C][C]0.276917[/C][/ROW]
[ROW][C]45[/C][C]0.010743[/C][C]0.0949[/C][C]0.462328[/C][/ROW]
[ROW][C]46[/C][C]-0.021942[/C][C]-0.1938[/C][C]0.423425[/C][/ROW]
[ROW][C]47[/C][C]0.027042[/C][C]0.2388[/C][C]0.405931[/C][/ROW]
[ROW][C]48[/C][C]-0.045782[/C][C]-0.4043[/C][C]0.343535[/C][/ROW]
[/TABLE]
Source: https://freestatistics.org/blog/index.php?pk=77308&T=2

Globally Unique Identifier (entire table): ba.freestatistics.org/blog/index.php?pk=77308&T=2

As an alternative you can also use a QR Code:  

The GUIDs for individual cells are displayed in the table below:

Partial Autocorrelation Function
Time lag kPACF(k)T-STATP-value
1-0.458833-4.05235.9e-05
2-0.220243-1.94510.027681
3-0.211295-1.86610.032893
4-0.051898-0.45840.323988
50.1387751.22560.112013
6-0.279288-2.46660.007917
7-0.31086-2.74540.003749
8-0.134795-1.19050.118735
9-0.228583-2.01880.023473
10-0.149689-1.3220.095012
11-0.48291-4.26492.8e-05
120.1100230.97170.167104
130.1975711.74490.04247
140.0738890.65260.257976
150.0685780.60570.273248
16-0.045736-0.40390.343684
170.0856240.75620.225901
18-0.107708-0.95130.172207
190.044010.38870.349284
20-0.013068-0.11540.454208
210.1140261.00710.158512
22-0.087868-0.7760.220039
23-0.098855-0.87310.192654
240.0613830.54210.294642
25-0.048426-0.42770.335029
26-0.055988-0.49450.311181
27-0.046758-0.4130.340387
280.028550.25210.400797
29-0.209129-1.8470.034272
300.0148390.13110.448035
310.013490.11910.452734
32-0.095098-0.83990.201771
33-0.006816-0.06020.476077
340.0167060.14750.441542
35-0.129634-1.14490.127877
360.0642430.56740.286042
37-0.059149-0.52240.301439
380.0741640.6550.257198
390.0231780.20470.419168
40-0.04114-0.36330.358666
410.0540470.47730.317231
42-0.012638-0.11160.455707
43-0.043788-0.38670.350006
440.0673250.59460.276917
450.0107430.09490.462328
46-0.021942-0.19380.423425
470.0270420.23880.405931
48-0.045782-0.40430.343535


Parameters (Session):
par2 = grey ; par3 = FALSE ; par4 = Unknown ;
Parameters (R input):
par1 = 48 ; par2 = 1 ; par3 = 1 ; par4 = 0 ; par5 = 12 ; par6 = White Noise ; par7 = 0.95 ;
R code (references can be found in the software module):
if (par1 == 'Default') {
par1 = 10*log10(length(x))
} else {
par1 <- as.numeric(par1)
}
par2 <- as.numeric(par2)
par3 <- as.numeric(par3)
par4 <- as.numeric(par4)
par5 <- as.numeric(par5)
if (par6 == 'White Noise') par6 <- 'white' else par6 <- 'ma'
par7 <- as.numeric(par7)
if (par2 == 0) {
x <- log(x)
} else {
x <- (x ^ par2 - 1) / par2
}
if (par3 > 0) x <- diff(x,lag=1,difference=par3)
if (par4 > 0) x <- diff(x,lag=par5,difference=par4)
bitmap(file='pic1.png')
racf <- acf(x, par1, main='Autocorrelation', xlab='time lag', ylab='ACF', ci.type=par6, ci=par7, sub=paste('(lambda=',par2,', d=',par3,', D=',par4,', CI=', par7, ', CI type=',par6,')',sep=''))
dev.off()
bitmap(file='pic2.png')
rpacf <- pacf(x,par1,main='Partial Autocorrelation',xlab='lags',ylab='PACF')
dev.off()
(myacf <- c(racf$acf))
(mypacf <- c(rpacf$acf))
lengthx <- length(x)
sqrtn <- sqrt(lengthx)
load(file='createtable')
a<-table.start()
a<-table.row.start(a)
a<-table.element(a,'Autocorrelation Function',4,TRUE)
a<-table.row.end(a)
a<-table.row.start(a)
a<-table.element(a,'Time lag k',header=TRUE)
a<-table.element(a,hyperlink('basics.htm','ACF(k)','click here for more information about the Autocorrelation Function'),header=TRUE)
a<-table.element(a,'T-STAT',header=TRUE)
a<-table.element(a,'P-value',header=TRUE)
a<-table.row.end(a)
for (i in 2:(par1+1)) {
a<-table.row.start(a)
a<-table.element(a,i-1,header=TRUE)
a<-table.element(a,round(myacf[i],6))
mytstat <- myacf[i]*sqrtn
a<-table.element(a,round(mytstat,4))
a<-table.element(a,round(1-pt(abs(mytstat),lengthx),6))
a<-table.row.end(a)
}
a<-table.end(a)
table.save(a,file='mytable.tab')
a<-table.start()
a<-table.row.start(a)
a<-table.element(a,'Partial Autocorrelation Function',4,TRUE)
a<-table.row.end(a)
a<-table.row.start(a)
a<-table.element(a,'Time lag k',header=TRUE)
a<-table.element(a,hyperlink('basics.htm','PACF(k)','click here for more information about the Partial Autocorrelation Function'),header=TRUE)
a<-table.element(a,'T-STAT',header=TRUE)
a<-table.element(a,'P-value',header=TRUE)
a<-table.row.end(a)
for (i in 1:par1) {
a<-table.row.start(a)
a<-table.element(a,i,header=TRUE)
a<-table.element(a,round(mypacf[i],6))
mytstat <- mypacf[i]*sqrtn
a<-table.element(a,round(mytstat,4))
a<-table.element(a,round(1-pt(abs(mytstat),lengthx),6))
a<-table.row.end(a)
}
a<-table.end(a)
table.save(a,file='mytable1.tab')