Free Statistics

of Irreproducible Research!

Author's title

Author*Unverified author*
R Software ModulePatrick.Wessarwasp_demand_forecasting_croston.wasp
Title produced by softwareCroston Forecasting
Date of computationThu, 03 Jun 2010 11:31:54 +0000
Cite this page as followsStatistical Computations at FreeStatistics.org, Office for Research Development and Education, URL https://freestatistics.org/blog/index.php?v=date/2010/Jun/03/t1275564813djtde90uk1paxov.htm/, Retrieved Sun, 05 May 2024 16:56:20 +0000
Statistical Computations at FreeStatistics.org, Office for Research Development and Education, URL https://freestatistics.org/blog/index.php?pk=77350, Retrieved Sun, 05 May 2024 16:56:20 +0000
QR Codes:

Original text written by user:
IsPrivate?No (this computation is public)
User-defined keywordsB11A,steven,coomans,thesis,permaand,ets,aangepastebroncode
Estimated Impact185
Family? (F = Feedback message, R = changed R code, M = changed R Module, P = changed Parameters, D = changed Data)
-     [Croston Forecasting] [B28A,steven,cooma...] [2010-05-13 11:28:31] [74be16979710d4c4e7c6647856088456]
-   PD  [Croston Forecasting] [B11A,steven,cooma...] [2010-05-31 09:26:28] [74be16979710d4c4e7c6647856088456]
- R  D      [Croston Forecasting] [B11A,steven,cooma...] [2010-06-03 11:31:54] [d41d8cd98f00b204e9800998ecf8427e] [Current]
Feedback Forum

Post a new message
Dataseries X:
62
30
31
50
33
12
20
30
21.5
23
13.5
0.5
12
10
70.5
30
20.5
12
20
45
11.505
0
10
5.5
27.5
0.5
7
0
2.5
0
0
6.025
1
0
0
0
0
2
0
6
20
0
0
0
7
35
0
0
0
1


Summary of computational transaction
Raw Inputview raw input (R code)
Raw Outputview raw output of R engine
Computing time4 seconds
R Serverwessa.org @ wessa.org

\begin{tabular}{lllllllll}
\hline
Summary of computational transaction \tabularnewline
Raw Input & view raw input (R code)  \tabularnewline
Raw Output & view raw output of R engine  \tabularnewline
Computing time & 4 seconds \tabularnewline
R Server & wessa.org @ wessa.org \tabularnewline
\hline
\end{tabular}
%Source: https://freestatistics.org/blog/index.php?pk=77350&T=0

[TABLE]
[ROW][C]Summary of computational transaction[/C][/ROW]
[ROW][C]Raw Input[/C][C]view raw input (R code) [/C][/ROW]
[ROW][C]Raw Output[/C][C]view raw output of R engine [/C][/ROW]
[ROW][C]Computing time[/C][C]4 seconds[/C][/ROW]
[ROW][C]R Server[/C][C]wessa.org @ wessa.org[/C][/ROW]
[/TABLE]
Source: https://freestatistics.org/blog/index.php?pk=77350&T=0

Globally Unique Identifier (entire table): ba.freestatistics.org/blog/index.php?pk=77350&T=0

As an alternative you can also use a QR Code:  

The GUIDs for individual cells are displayed in the table below:

Summary of computational transaction
Raw Inputview raw input (R code)
Raw Outputview raw output of R engine
Computing time4 seconds
R Serverwessa.org @ wessa.org


Demand Forecast
PointForecast95% LB80% LB80% UB95% UB
513.88029461125816-21.4416733718269-12.67685029924320.437439521759329.2022625943432
523.82687967221445-21.4951216171418-12.730287016086920.384046360515829.1488809615707
533.77793517618638-21.5441213579153-12.779267634712420.335137987085129.0999917102880
543.73308697951463-21.589049749093-12.824168267753120.290342226782329.0552237081222
553.69199225165074-21.630251602923-12.865333041521220.249317544822729.0142361062245
563.65433685447688-21.6680422204792-12.903076854550720.211750563504528.9767159294330
573.61983294095742-21.7027099662161-12.937687892199220.17735377411428.9423758481309
583.58821675476605-21.7345186102682-12.969429919821720.145863429353728.9109521198003
593.55924661406814-21.7637094606230-12.998544374807320.117037602943528.8822026887593
603.53270106404587-21.7905033050139-13.025252275790720.090654403882528.8559054331056
613.50837718404359-21.8151021803545-13.049755965579920.066510333667028.8318565484416
623.4860890363929-21.8376909857416-13.072240702757620.044418775543428.8098690585274
633.46566624505975-21.8584389534558-13.092876115497920.024208605617428.7897714435754
643.44695269324854-21.8775009909679-13.111817529861220.005722916358328.771406377465
653.42980533000722-21.8950189056890-13.129207183691919.988817843706328.7546295657034
663.41409307671101-21.9111225230707-13.145175336208919.973361489630928.7393086764927
673.39969582506537-21.9259307076462-13.159841282454919.959232932585728.7253223577769
683.38650351896898-21.9395522956923-13.173314280930919.946321318868828.7125593336302
693.374415313218-21.9520869473793-13.185694401988919.934525028424928.7009175738153
703.36333880262082-21.9636259255408-13.197073303872719.923750909114328.6903035307824
713.35318931563021-21.9742528075334-13.207534942676819.913913573937228.6806314387938
723.34388926709336-21.9840441360668-13.217156221937219.904934756123928.6718226702536
733.33536756517211-21.9930700143426-13.226007587057119.896742717401328.6638051446868
743.32755906789954-22.0013946503594-13.234153569314619.889271705113628.6565127861585

\begin{tabular}{lllllllll}
\hline
Demand Forecast \tabularnewline
Point & Forecast & 95% LB & 80% LB & 80% UB & 95% UB \tabularnewline
51 & 3.88029461125816 & -21.4416733718269 & -12.676850299243 & 20.4374395217593 & 29.2022625943432 \tabularnewline
52 & 3.82687967221445 & -21.4951216171418 & -12.7302870160869 & 20.3840463605158 & 29.1488809615707 \tabularnewline
53 & 3.77793517618638 & -21.5441213579153 & -12.7792676347124 & 20.3351379870851 & 29.0999917102880 \tabularnewline
54 & 3.73308697951463 & -21.589049749093 & -12.8241682677531 & 20.2903422267823 & 29.0552237081222 \tabularnewline
55 & 3.69199225165074 & -21.630251602923 & -12.8653330415212 & 20.2493175448227 & 29.0142361062245 \tabularnewline
56 & 3.65433685447688 & -21.6680422204792 & -12.9030768545507 & 20.2117505635045 & 28.9767159294330 \tabularnewline
57 & 3.61983294095742 & -21.7027099662161 & -12.9376878921992 & 20.177353774114 & 28.9423758481309 \tabularnewline
58 & 3.58821675476605 & -21.7345186102682 & -12.9694299198217 & 20.1458634293537 & 28.9109521198003 \tabularnewline
59 & 3.55924661406814 & -21.7637094606230 & -12.9985443748073 & 20.1170376029435 & 28.8822026887593 \tabularnewline
60 & 3.53270106404587 & -21.7905033050139 & -13.0252522757907 & 20.0906544038825 & 28.8559054331056 \tabularnewline
61 & 3.50837718404359 & -21.8151021803545 & -13.0497559655799 & 20.0665103336670 & 28.8318565484416 \tabularnewline
62 & 3.4860890363929 & -21.8376909857416 & -13.0722407027576 & 20.0444187755434 & 28.8098690585274 \tabularnewline
63 & 3.46566624505975 & -21.8584389534558 & -13.0928761154979 & 20.0242086056174 & 28.7897714435754 \tabularnewline
64 & 3.44695269324854 & -21.8775009909679 & -13.1118175298612 & 20.0057229163583 & 28.771406377465 \tabularnewline
65 & 3.42980533000722 & -21.8950189056890 & -13.1292071836919 & 19.9888178437063 & 28.7546295657034 \tabularnewline
66 & 3.41409307671101 & -21.9111225230707 & -13.1451753362089 & 19.9733614896309 & 28.7393086764927 \tabularnewline
67 & 3.39969582506537 & -21.9259307076462 & -13.1598412824549 & 19.9592329325857 & 28.7253223577769 \tabularnewline
68 & 3.38650351896898 & -21.9395522956923 & -13.1733142809309 & 19.9463213188688 & 28.7125593336302 \tabularnewline
69 & 3.374415313218 & -21.9520869473793 & -13.1856944019889 & 19.9345250284249 & 28.7009175738153 \tabularnewline
70 & 3.36333880262082 & -21.9636259255408 & -13.1970733038727 & 19.9237509091143 & 28.6903035307824 \tabularnewline
71 & 3.35318931563021 & -21.9742528075334 & -13.2075349426768 & 19.9139135739372 & 28.6806314387938 \tabularnewline
72 & 3.34388926709336 & -21.9840441360668 & -13.2171562219372 & 19.9049347561239 & 28.6718226702536 \tabularnewline
73 & 3.33536756517211 & -21.9930700143426 & -13.2260075870571 & 19.8967427174013 & 28.6638051446868 \tabularnewline
74 & 3.32755906789954 & -22.0013946503594 & -13.2341535693146 & 19.8892717051136 & 28.6565127861585 \tabularnewline
\hline
\end{tabular}
%Source: https://freestatistics.org/blog/index.php?pk=77350&T=1

[TABLE]
[ROW][C]Demand Forecast[/C][/ROW]
[ROW][C]Point[/C][C]Forecast[/C][C]95% LB[/C][C]80% LB[/C][C]80% UB[/C][C]95% UB[/C][/ROW]
[ROW][C]51[/C][C]3.88029461125816[/C][C]-21.4416733718269[/C][C]-12.676850299243[/C][C]20.4374395217593[/C][C]29.2022625943432[/C][/ROW]
[ROW][C]52[/C][C]3.82687967221445[/C][C]-21.4951216171418[/C][C]-12.7302870160869[/C][C]20.3840463605158[/C][C]29.1488809615707[/C][/ROW]
[ROW][C]53[/C][C]3.77793517618638[/C][C]-21.5441213579153[/C][C]-12.7792676347124[/C][C]20.3351379870851[/C][C]29.0999917102880[/C][/ROW]
[ROW][C]54[/C][C]3.73308697951463[/C][C]-21.589049749093[/C][C]-12.8241682677531[/C][C]20.2903422267823[/C][C]29.0552237081222[/C][/ROW]
[ROW][C]55[/C][C]3.69199225165074[/C][C]-21.630251602923[/C][C]-12.8653330415212[/C][C]20.2493175448227[/C][C]29.0142361062245[/C][/ROW]
[ROW][C]56[/C][C]3.65433685447688[/C][C]-21.6680422204792[/C][C]-12.9030768545507[/C][C]20.2117505635045[/C][C]28.9767159294330[/C][/ROW]
[ROW][C]57[/C][C]3.61983294095742[/C][C]-21.7027099662161[/C][C]-12.9376878921992[/C][C]20.177353774114[/C][C]28.9423758481309[/C][/ROW]
[ROW][C]58[/C][C]3.58821675476605[/C][C]-21.7345186102682[/C][C]-12.9694299198217[/C][C]20.1458634293537[/C][C]28.9109521198003[/C][/ROW]
[ROW][C]59[/C][C]3.55924661406814[/C][C]-21.7637094606230[/C][C]-12.9985443748073[/C][C]20.1170376029435[/C][C]28.8822026887593[/C][/ROW]
[ROW][C]60[/C][C]3.53270106404587[/C][C]-21.7905033050139[/C][C]-13.0252522757907[/C][C]20.0906544038825[/C][C]28.8559054331056[/C][/ROW]
[ROW][C]61[/C][C]3.50837718404359[/C][C]-21.8151021803545[/C][C]-13.0497559655799[/C][C]20.0665103336670[/C][C]28.8318565484416[/C][/ROW]
[ROW][C]62[/C][C]3.4860890363929[/C][C]-21.8376909857416[/C][C]-13.0722407027576[/C][C]20.0444187755434[/C][C]28.8098690585274[/C][/ROW]
[ROW][C]63[/C][C]3.46566624505975[/C][C]-21.8584389534558[/C][C]-13.0928761154979[/C][C]20.0242086056174[/C][C]28.7897714435754[/C][/ROW]
[ROW][C]64[/C][C]3.44695269324854[/C][C]-21.8775009909679[/C][C]-13.1118175298612[/C][C]20.0057229163583[/C][C]28.771406377465[/C][/ROW]
[ROW][C]65[/C][C]3.42980533000722[/C][C]-21.8950189056890[/C][C]-13.1292071836919[/C][C]19.9888178437063[/C][C]28.7546295657034[/C][/ROW]
[ROW][C]66[/C][C]3.41409307671101[/C][C]-21.9111225230707[/C][C]-13.1451753362089[/C][C]19.9733614896309[/C][C]28.7393086764927[/C][/ROW]
[ROW][C]67[/C][C]3.39969582506537[/C][C]-21.9259307076462[/C][C]-13.1598412824549[/C][C]19.9592329325857[/C][C]28.7253223577769[/C][/ROW]
[ROW][C]68[/C][C]3.38650351896898[/C][C]-21.9395522956923[/C][C]-13.1733142809309[/C][C]19.9463213188688[/C][C]28.7125593336302[/C][/ROW]
[ROW][C]69[/C][C]3.374415313218[/C][C]-21.9520869473793[/C][C]-13.1856944019889[/C][C]19.9345250284249[/C][C]28.7009175738153[/C][/ROW]
[ROW][C]70[/C][C]3.36333880262082[/C][C]-21.9636259255408[/C][C]-13.1970733038727[/C][C]19.9237509091143[/C][C]28.6903035307824[/C][/ROW]
[ROW][C]71[/C][C]3.35318931563021[/C][C]-21.9742528075334[/C][C]-13.2075349426768[/C][C]19.9139135739372[/C][C]28.6806314387938[/C][/ROW]
[ROW][C]72[/C][C]3.34388926709336[/C][C]-21.9840441360668[/C][C]-13.2171562219372[/C][C]19.9049347561239[/C][C]28.6718226702536[/C][/ROW]
[ROW][C]73[/C][C]3.33536756517211[/C][C]-21.9930700143426[/C][C]-13.2260075870571[/C][C]19.8967427174013[/C][C]28.6638051446868[/C][/ROW]
[ROW][C]74[/C][C]3.32755906789954[/C][C]-22.0013946503594[/C][C]-13.2341535693146[/C][C]19.8892717051136[/C][C]28.6565127861585[/C][/ROW]
[/TABLE]
Source: https://freestatistics.org/blog/index.php?pk=77350&T=1

Globally Unique Identifier (entire table): ba.freestatistics.org/blog/index.php?pk=77350&T=1

As an alternative you can also use a QR Code:  

The GUIDs for individual cells are displayed in the table below:

Demand Forecast
PointForecast95% LB80% LB80% UB95% UB
513.88029461125816-21.4416733718269-12.67685029924320.437439521759329.2022625943432
523.82687967221445-21.4951216171418-12.730287016086920.384046360515829.1488809615707
533.77793517618638-21.5441213579153-12.779267634712420.335137987085129.0999917102880
543.73308697951463-21.589049749093-12.824168267753120.290342226782329.0552237081222
553.69199225165074-21.630251602923-12.865333041521220.249317544822729.0142361062245
563.65433685447688-21.6680422204792-12.903076854550720.211750563504528.9767159294330
573.61983294095742-21.7027099662161-12.937687892199220.17735377411428.9423758481309
583.58821675476605-21.7345186102682-12.969429919821720.145863429353728.9109521198003
593.55924661406814-21.7637094606230-12.998544374807320.117037602943528.8822026887593
603.53270106404587-21.7905033050139-13.025252275790720.090654403882528.8559054331056
613.50837718404359-21.8151021803545-13.049755965579920.066510333667028.8318565484416
623.4860890363929-21.8376909857416-13.072240702757620.044418775543428.8098690585274
633.46566624505975-21.8584389534558-13.092876115497920.024208605617428.7897714435754
643.44695269324854-21.8775009909679-13.111817529861220.005722916358328.771406377465
653.42980533000722-21.8950189056890-13.129207183691919.988817843706328.7546295657034
663.41409307671101-21.9111225230707-13.145175336208919.973361489630928.7393086764927
673.39969582506537-21.9259307076462-13.159841282454919.959232932585728.7253223577769
683.38650351896898-21.9395522956923-13.173314280930919.946321318868828.7125593336302
693.374415313218-21.9520869473793-13.185694401988919.934525028424928.7009175738153
703.36333880262082-21.9636259255408-13.197073303872719.923750909114328.6903035307824
713.35318931563021-21.9742528075334-13.207534942676819.913913573937228.6806314387938
723.34388926709336-21.9840441360668-13.217156221937219.904934756123928.6718226702536
733.33536756517211-21.9930700143426-13.226007587057119.896742717401328.6638051446868
743.32755906789954-22.0013946503594-13.234153569314619.889271705113628.6565127861585


Actuals and Interpolation
TimeActualForecast
16249.1485946234278
23045.3349835319040
33141.8176511556289
45038.5909798541646
53335.6520298034287
61232.9504078576450
72030.4539152863161
83028.1658962839276
921.526.0766501187039
102324.156446356987
1113.522.3980495637221
120.520.7779239031914
131219.2763140211818
141017.9029571235767
1570.516.6398256486149
163015.5438391587265
1720.514.5275375931142
181213.5952912424967
192012.7363232603913
204511.9577990661807
2111.50511.2759453783387
22010.6345631046696
231010.0354091488450
245.59.491781865029
2527.58.98941596678817
260.58.55085675842196
2778.1309880805476
2807.74915685785539
292.57.39159969411268
3007.06270326550288
3106.75629871592574
326.0256.47193662930408
3316.21434038969776
3405.97297356764721
3505.74809890698749
3605.53896241148096
3705.34435520194198
3825.16316210918967
3904.99648594330416
4064.84004626539840
41204.70048199890951
4204.58831288025937
4304.4728445018471
4404.36461125530118
4574.26306411947283
46354.17515697240404
4704.12606441076908
4804.06097419798148
4903.99910621856815
5013.94022356081926

\begin{tabular}{lllllllll}
\hline
Actuals and Interpolation \tabularnewline
Time & Actual & Forecast \tabularnewline
1 & 62 & 49.1485946234278 \tabularnewline
2 & 30 & 45.3349835319040 \tabularnewline
3 & 31 & 41.8176511556289 \tabularnewline
4 & 50 & 38.5909798541646 \tabularnewline
5 & 33 & 35.6520298034287 \tabularnewline
6 & 12 & 32.9504078576450 \tabularnewline
7 & 20 & 30.4539152863161 \tabularnewline
8 & 30 & 28.1658962839276 \tabularnewline
9 & 21.5 & 26.0766501187039 \tabularnewline
10 & 23 & 24.156446356987 \tabularnewline
11 & 13.5 & 22.3980495637221 \tabularnewline
12 & 0.5 & 20.7779239031914 \tabularnewline
13 & 12 & 19.2763140211818 \tabularnewline
14 & 10 & 17.9029571235767 \tabularnewline
15 & 70.5 & 16.6398256486149 \tabularnewline
16 & 30 & 15.5438391587265 \tabularnewline
17 & 20.5 & 14.5275375931142 \tabularnewline
18 & 12 & 13.5952912424967 \tabularnewline
19 & 20 & 12.7363232603913 \tabularnewline
20 & 45 & 11.9577990661807 \tabularnewline
21 & 11.505 & 11.2759453783387 \tabularnewline
22 & 0 & 10.6345631046696 \tabularnewline
23 & 10 & 10.0354091488450 \tabularnewline
24 & 5.5 & 9.491781865029 \tabularnewline
25 & 27.5 & 8.98941596678817 \tabularnewline
26 & 0.5 & 8.55085675842196 \tabularnewline
27 & 7 & 8.1309880805476 \tabularnewline
28 & 0 & 7.74915685785539 \tabularnewline
29 & 2.5 & 7.39159969411268 \tabularnewline
30 & 0 & 7.06270326550288 \tabularnewline
31 & 0 & 6.75629871592574 \tabularnewline
32 & 6.025 & 6.47193662930408 \tabularnewline
33 & 1 & 6.21434038969776 \tabularnewline
34 & 0 & 5.97297356764721 \tabularnewline
35 & 0 & 5.74809890698749 \tabularnewline
36 & 0 & 5.53896241148096 \tabularnewline
37 & 0 & 5.34435520194198 \tabularnewline
38 & 2 & 5.16316210918967 \tabularnewline
39 & 0 & 4.99648594330416 \tabularnewline
40 & 6 & 4.84004626539840 \tabularnewline
41 & 20 & 4.70048199890951 \tabularnewline
42 & 0 & 4.58831288025937 \tabularnewline
43 & 0 & 4.4728445018471 \tabularnewline
44 & 0 & 4.36461125530118 \tabularnewline
45 & 7 & 4.26306411947283 \tabularnewline
46 & 35 & 4.17515697240404 \tabularnewline
47 & 0 & 4.12606441076908 \tabularnewline
48 & 0 & 4.06097419798148 \tabularnewline
49 & 0 & 3.99910621856815 \tabularnewline
50 & 1 & 3.94022356081926 \tabularnewline
\hline
\end{tabular}
%Source: https://freestatistics.org/blog/index.php?pk=77350&T=2

[TABLE]
[ROW][C]Actuals and Interpolation[/C][/ROW]
[ROW][C]Time[/C][C]Actual[/C][C]Forecast[/C][/ROW]
[ROW][C]1[/C][C]62[/C][C]49.1485946234278[/C][/ROW]
[ROW][C]2[/C][C]30[/C][C]45.3349835319040[/C][/ROW]
[ROW][C]3[/C][C]31[/C][C]41.8176511556289[/C][/ROW]
[ROW][C]4[/C][C]50[/C][C]38.5909798541646[/C][/ROW]
[ROW][C]5[/C][C]33[/C][C]35.6520298034287[/C][/ROW]
[ROW][C]6[/C][C]12[/C][C]32.9504078576450[/C][/ROW]
[ROW][C]7[/C][C]20[/C][C]30.4539152863161[/C][/ROW]
[ROW][C]8[/C][C]30[/C][C]28.1658962839276[/C][/ROW]
[ROW][C]9[/C][C]21.5[/C][C]26.0766501187039[/C][/ROW]
[ROW][C]10[/C][C]23[/C][C]24.156446356987[/C][/ROW]
[ROW][C]11[/C][C]13.5[/C][C]22.3980495637221[/C][/ROW]
[ROW][C]12[/C][C]0.5[/C][C]20.7779239031914[/C][/ROW]
[ROW][C]13[/C][C]12[/C][C]19.2763140211818[/C][/ROW]
[ROW][C]14[/C][C]10[/C][C]17.9029571235767[/C][/ROW]
[ROW][C]15[/C][C]70.5[/C][C]16.6398256486149[/C][/ROW]
[ROW][C]16[/C][C]30[/C][C]15.5438391587265[/C][/ROW]
[ROW][C]17[/C][C]20.5[/C][C]14.5275375931142[/C][/ROW]
[ROW][C]18[/C][C]12[/C][C]13.5952912424967[/C][/ROW]
[ROW][C]19[/C][C]20[/C][C]12.7363232603913[/C][/ROW]
[ROW][C]20[/C][C]45[/C][C]11.9577990661807[/C][/ROW]
[ROW][C]21[/C][C]11.505[/C][C]11.2759453783387[/C][/ROW]
[ROW][C]22[/C][C]0[/C][C]10.6345631046696[/C][/ROW]
[ROW][C]23[/C][C]10[/C][C]10.0354091488450[/C][/ROW]
[ROW][C]24[/C][C]5.5[/C][C]9.491781865029[/C][/ROW]
[ROW][C]25[/C][C]27.5[/C][C]8.98941596678817[/C][/ROW]
[ROW][C]26[/C][C]0.5[/C][C]8.55085675842196[/C][/ROW]
[ROW][C]27[/C][C]7[/C][C]8.1309880805476[/C][/ROW]
[ROW][C]28[/C][C]0[/C][C]7.74915685785539[/C][/ROW]
[ROW][C]29[/C][C]2.5[/C][C]7.39159969411268[/C][/ROW]
[ROW][C]30[/C][C]0[/C][C]7.06270326550288[/C][/ROW]
[ROW][C]31[/C][C]0[/C][C]6.75629871592574[/C][/ROW]
[ROW][C]32[/C][C]6.025[/C][C]6.47193662930408[/C][/ROW]
[ROW][C]33[/C][C]1[/C][C]6.21434038969776[/C][/ROW]
[ROW][C]34[/C][C]0[/C][C]5.97297356764721[/C][/ROW]
[ROW][C]35[/C][C]0[/C][C]5.74809890698749[/C][/ROW]
[ROW][C]36[/C][C]0[/C][C]5.53896241148096[/C][/ROW]
[ROW][C]37[/C][C]0[/C][C]5.34435520194198[/C][/ROW]
[ROW][C]38[/C][C]2[/C][C]5.16316210918967[/C][/ROW]
[ROW][C]39[/C][C]0[/C][C]4.99648594330416[/C][/ROW]
[ROW][C]40[/C][C]6[/C][C]4.84004626539840[/C][/ROW]
[ROW][C]41[/C][C]20[/C][C]4.70048199890951[/C][/ROW]
[ROW][C]42[/C][C]0[/C][C]4.58831288025937[/C][/ROW]
[ROW][C]43[/C][C]0[/C][C]4.4728445018471[/C][/ROW]
[ROW][C]44[/C][C]0[/C][C]4.36461125530118[/C][/ROW]
[ROW][C]45[/C][C]7[/C][C]4.26306411947283[/C][/ROW]
[ROW][C]46[/C][C]35[/C][C]4.17515697240404[/C][/ROW]
[ROW][C]47[/C][C]0[/C][C]4.12606441076908[/C][/ROW]
[ROW][C]48[/C][C]0[/C][C]4.06097419798148[/C][/ROW]
[ROW][C]49[/C][C]0[/C][C]3.99910621856815[/C][/ROW]
[ROW][C]50[/C][C]1[/C][C]3.94022356081926[/C][/ROW]
[/TABLE]
Source: https://freestatistics.org/blog/index.php?pk=77350&T=2

Globally Unique Identifier (entire table): ba.freestatistics.org/blog/index.php?pk=77350&T=2

As an alternative you can also use a QR Code:  

The GUIDs for individual cells are displayed in the table below:

Actuals and Interpolation
TimeActualForecast
16249.1485946234278
23045.3349835319040
33141.8176511556289
45038.5909798541646
53335.6520298034287
61232.9504078576450
72030.4539152863161
83028.1658962839276
921.526.0766501187039
102324.156446356987
1113.522.3980495637221
120.520.7779239031914
131219.2763140211818
141017.9029571235767
1570.516.6398256486149
163015.5438391587265
1720.514.5275375931142
181213.5952912424967
192012.7363232603913
204511.9577990661807
2111.50511.2759453783387
22010.6345631046696
231010.0354091488450
245.59.491781865029
2527.58.98941596678817
260.58.55085675842196
2778.1309880805476
2807.74915685785539
292.57.39159969411268
3007.06270326550288
3106.75629871592574
326.0256.47193662930408
3316.21434038969776
3405.97297356764721
3505.74809890698749
3605.53896241148096
3705.34435520194198
3825.16316210918967
3904.99648594330416
4064.84004626539840
41204.70048199890951
4204.58831288025937
4304.4728445018471
4404.36461125530118
4574.26306411947283
46354.17515697240404
4704.12606441076908
4804.06097419798148
4903.99910621856815
5013.94022356081926


\begin{tabular}{lllllllll}
\hline
What is next? \tabularnewline
Simulate Time Series \tabularnewline
Generate Forecasts \tabularnewline
Forecast Analysis \tabularnewline
\hline
\end{tabular}
%Source: https://freestatistics.org/blog/index.php?pk=77350&T=3

[TABLE]
[ROW][C]What is next?[/C][/ROW]
[ROW][C]Simulate Time Series[/C][/ROW]
[ROW][C]Generate Forecasts[/C][/ROW]
[ROW][C]Forecast Analysis[/C][/ROW]
[/TABLE]
Source: https://freestatistics.org/blog/index.php?pk=77350&T=3

Globally Unique Identifier (entire table): ba.freestatistics.org/blog/index.php?pk=77350&T=3

As an alternative you can also use a QR Code:  

The GUIDs for individual cells are displayed in the table below:

What is next?
Simulate Time Series
Generate Forecasts
Forecast Analysis


Parameters (Session):
par1 = Input box ; par2 = ETS ; par3 = NA ; par4 = NA ; par5 = ZZZ ; par6 = 12 ; par7 = dum ; par8 = B11AEM ; par9 = 3 ; par10 = 0.1 ;
Parameters (R input):
par1 = Input box ; par2 = ETS ; par3 = NA ; par4 = NA ; par5 = ZZZ ; par6 = 12 ; par7 = dum ; par8 = B11AEM ; par9 = 3 ; par10 = 0.1 ;
R code (references can be found in the software module):
if(par3!='NA') par3 <- as.numeric(par3) else par3 <- NA
if(par4!='NA') par4 <- as.numeric(par4) else par4 <- NA
par6 <- as.numeric(par6) #Seasonal Period
par9 <- as.numeric(par9) #Forecast Horizon
par10 <- as.numeric(par10) #Alpha
library(forecast)
if (par1 == 'CSV') {
xarr <- read.csv(file=paste('tmp/',par7,'.csv',sep=''),header=T)
numseries <- length(xarr[1,])-1
n <- length(xarr[,1])
nmh <- n - par9
nmhp1 <- nmh + 1
rarr <- array(NA,dim=c(n,numseries))
farr <- array(NA,dim=c(n,numseries))
parr <- array(NA,dim=c(numseries,8))
colnames(parr) = list('ME','RMSE','MAE','MPE','MAPE','MASE','ACF1','TheilU')
for(i in 1:numseries) {
sindex <- i+1
x <- xarr[,sindex]
if(par2=='Croston') {
if (i==1) m <- croston(x,alpha=par10)
if (i==1) mydemand <- m$model$demand[]
fit <- croston(x[1:nmh],h=par9,alpha=par10)
}
if(par2=='ARIMA') {
m <- auto.arima(ts(x,freq=par6),d=par3,D=par4)
mydemand <- forecast(m)
fit <- auto.arima(ts(x[1:nmh],freq=par6),d=par3,D=par4)
}
if(par2=='ETS') {
m <- ets(ts(x,freq=par6),model=par5)
mydemand <- forecast(m)
fit <- ets(ts(x[1:nmh],freq=par6),model=par5)
}
try(rarr[,i] <- mydemand$resid,silent=T)
try(farr[,i] <- mydemand$mean,silent=T)
if (par2!='Croston') parr[i,] <- accuracy(forecast(fit,par9),x[nmhp1:n])
if (par2=='Croston') parr[i,] <- accuracy(fit,x[nmhp1:n])
}
write.csv(farr,file=paste('tmp/',par8,'_f.csv',sep=''))
write.csv(rarr,file=paste('tmp/',par8,'_r.csv',sep=''))
write.csv(parr,file=paste('tmp/',par8,'_p.csv',sep=''))
}
if (par1 == 'Input box') {
numseries <- 1
n <- length(x)
if(par2=='Croston') {
m <- croston(x)
mydemand <- m$model$demand[]
}
if(par2=='ARIMA') {
m <- auto.arima(ts(x,freq=par6),d=par3,D=par4)
mydemand <- forecast(m)
}
if(par2=='ETS') {
m <- ets(ts(x,freq=par6),model=par5)
mydemand <- forecast(m)
}
summary(m)
}
bitmap(file='test1.png')
op <- par(mfrow=c(2,1))
if (par2=='Croston') plot(m)
if ((par2=='ARIMA') | par2=='ETS') plot(forecast(m))
plot(mydemand$resid,type='l',main='Residuals', ylab='residual value', xlab='time')
par(op)
dev.off()
bitmap(file='pic2.png')
op <- par(mfrow=c(2,2))
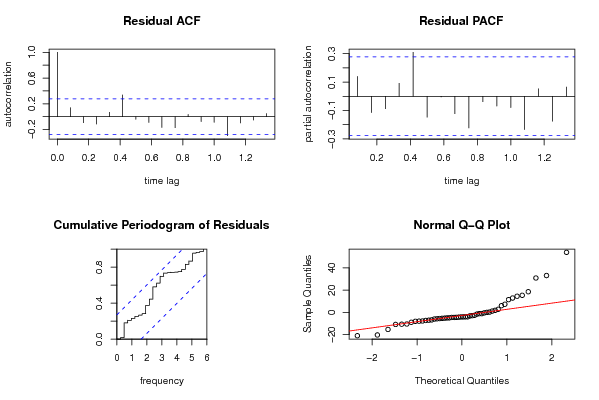
acf(mydemand$resid, lag.max=n/3, main='Residual ACF', ylab='autocorrelation', xlab='time lag')
pacf(mydemand$resid,lag.max=n/3, main='Residual PACF', ylab='partial autocorrelation', xlab='time lag')
cpgram(mydemand$resid, main='Cumulative Periodogram of Residuals')
qqnorm(mydemand$resid); qqline(mydemand$resid, col=2)
par(op)
dev.off()
load(file='createtable')
a<-table.start()
a<-table.row.start(a)
a<-table.element(a,'Demand Forecast',6,TRUE)
a<-table.row.end(a)
a<-table.row.start(a)
a<-table.element(a,'Point',header=TRUE)
a<-table.element(a,'Forecast',header=TRUE)
a<-table.element(a,'95% LB',header=TRUE)
a<-table.element(a,'80% LB',header=TRUE)
a<-table.element(a,'80% UB',header=TRUE)
a<-table.element(a,'95% UB',header=TRUE)
a<-table.row.end(a)
for (i in 1:length(mydemand$mean)) {
a<-table.row.start(a)
a<-table.element(a,i+n,header=TRUE)
a<-table.element(a,as.numeric(mydemand$mean[i]))
a<-table.element(a,as.numeric(mydemand$lower[i,2]))
a<-table.element(a,as.numeric(mydemand$lower[i,1]))
a<-table.element(a,as.numeric(mydemand$upper[i,1]))
a<-table.element(a,as.numeric(mydemand$upper[i,2]))
a<-table.row.end(a)
}
a<-table.end(a)
table.save(a,file='mytable.tab')
a<-table.start()
a<-table.row.start(a)
a<-table.element(a,'Actuals and Interpolation',3,TRUE)
a<-table.row.end(a)
a<-table.row.start(a)
a<-table.element(a,'Time',header=TRUE)
a<-table.element(a,'Actual',header=TRUE)
a<-table.element(a,'Forecast',header=TRUE)
a<-table.row.end(a)
for (i in 1:n) {
a<-table.row.start(a)
a<-table.element(a,i,header=TRUE)
a<-table.element(a,x[i])
a<-table.element(a,x[i] - as.numeric(m$resid[i]))
a<-table.row.end(a)
}
a<-table.end(a)
table.save(a,file='mytable1.tab')
a<-table.start()
a<-table.row.start(a)
a<-table.element(a,'What is next?',1,TRUE)
a<-table.row.end(a)
a<-table.row.start(a)
a<-table.element(a,hyperlink(paste('https://automated.biganalytics.eu/Patrick.Wessa/rwasp_demand_forecasting_simulate.wasp',sep=''),'Simulate Time Series','',target=''))
a<-table.row.end(a)
a<-table.row.start(a)
a<-table.element(a,hyperlink(paste('https://automated.biganalytics.eu/Patrick.Wessa/rwasp_demand_forecasting_croston.wasp',sep=''),'Generate Forecasts','',target=''))
a<-table.row.end(a)
a<-table.row.start(a)
a<-table.element(a,hyperlink(paste('https://automated.biganalytics.eu/Patrick.Wessa/rwasp_demand_forecasting_analysis.wasp',sep=''),'Forecast Analysis','',target=''))
a<-table.row.end(a)
a<-table.end(a)
table.save(a,file='mytable0.tab')
-SERVER-wessa.org