Free Statistics

of Irreproducible Research!

Author's title

Author*Unverified author*
R Software Modulerwasp_autocorrelation.wasp
Title produced by software(Partial) Autocorrelation Function
Date of computationSun, 06 Jun 2010 09:33:20 +0000
Cite this page as followsStatistical Computations at FreeStatistics.org, Office for Research Development and Education, URL https://freestatistics.org/blog/index.php?v=date/2010/Jun/06/t1275816892trix11orsn9nkel.htm/, Retrieved Sun, 28 Apr 2024 17:07:47 +0000
Statistical Computations at FreeStatistics.org, Office for Research Development and Education, URL https://freestatistics.org/blog/index.php?pk=77637, Retrieved Sun, 28 Apr 2024 17:07:47 +0000
QR Codes:

Original text written by user:
IsPrivate?No (this computation is public)
User-defined keywords
Estimated Impact155
Family? (F = Feedback message, R = changed R code, M = changed R Module, P = changed Parameters, D = changed Data)
-       [(Partial) Autocorrelation Function] [IKO opgave 6bis oe 3] [2010-06-06 09:33:20] [bf0252597522c891d765285c82c7204e] [Current]
Feedback Forum

Post a new message
Dataseries X:
278,1
283,3
287
287,9
279,7
273,2
272,6
274,8
277,2
277,5
278,7
279
280,1
280,8
280,1
270,5
260
258,2
260,1
262,2
263,4
264,7
267,4
266,8
265,2
262,5
255
252,8
249,6
254,2
259,4
260,8
261,6
257,2
249,8
235,2
227,4
223,1
221,6
218,5
220,1
222,1
222,9
222,8
222,1
209
201,7
204,5
208,7
213
218,6
221,9
224,6
226,8
229,6
231,4
229,1
232,7
236,6
242,2
251,5
261,5
266,4
280,9
294,4
308,8
328,8
348,2
365,9
387,5
395,9
395,8


Summary of computational transaction
Raw Inputview raw input (R code)
Raw Outputview raw output of R engine
Computing time1 seconds
R Server'Gwilym Jenkins' @ 72.249.127.135

\begin{tabular}{lllllllll}
\hline
Summary of computational transaction \tabularnewline
Raw Input & view raw input (R code)  \tabularnewline
Raw Output & view raw output of R engine  \tabularnewline
Computing time & 1 seconds \tabularnewline
R Server & 'Gwilym Jenkins' @ 72.249.127.135 \tabularnewline
\hline
\end{tabular}
%Source: https://freestatistics.org/blog/index.php?pk=77637&T=0

[TABLE]
[ROW][C]Summary of computational transaction[/C][/ROW]
[ROW][C]Raw Input[/C][C]view raw input (R code) [/C][/ROW]
[ROW][C]Raw Output[/C][C]view raw output of R engine [/C][/ROW]
[ROW][C]Computing time[/C][C]1 seconds[/C][/ROW]
[ROW][C]R Server[/C][C]'Gwilym Jenkins' @ 72.249.127.135[/C][/ROW]
[/TABLE]
Source: https://freestatistics.org/blog/index.php?pk=77637&T=0

Globally Unique Identifier (entire table): ba.freestatistics.org/blog/index.php?pk=77637&T=0

As an alternative you can also use a QR Code:  

The GUIDs for individual cells are displayed in the table below:

Summary of computational transaction
Raw Inputview raw input (R code)
Raw Outputview raw output of R engine
Computing time1 seconds
R Server'Gwilym Jenkins' @ 72.249.127.135


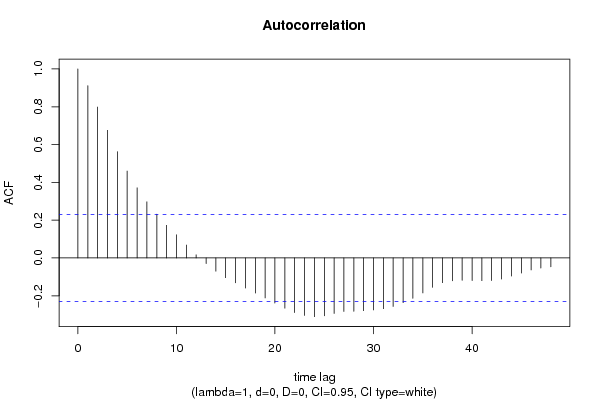
Autocorrelation Function
Time lag kACF(k)T-STATP-value
10.9116767.73580
20.7983246.7740
30.6755645.73240
40.56254.7735e-06
50.4598583.9020.000106
60.3713453.1510.001186
70.2970672.52070.006964
80.2313911.96340.02673
90.1731031.46880.073117
100.122491.03940.151057
110.0681580.57830.282419
120.0165960.14080.444202
13-0.029381-0.24930.401918
14-0.069856-0.59270.277604
15-0.104217-0.88430.189737
16-0.13142-1.11510.13425
17-0.159074-1.34980.090656
18-0.18582-1.57670.05962
19-0.211634-1.79580.038363
20-0.238761-2.0260.023238
21-0.265456-2.25250.013671
22-0.288632-2.44910.008378
23-0.303995-2.57950.005968
24-0.310375-2.63360.005167
25-0.306103-2.59740.005692
26-0.293167-2.48760.007589
27-0.282724-2.3990.009516
28-0.282231-2.39480.009616
29-0.279015-2.36750.010299
30-0.274656-2.33050.011292
31-0.268302-2.27660.012892
32-0.256275-2.17460.016475
33-0.236703-2.00850.024171
34-0.213353-1.81040.037206
35-0.184733-1.56750.06069
36-0.15497-1.3150.096348
37-0.130885-1.11060.135219
38-0.121034-1.0270.153928
39-0.118222-1.00310.159575
40-0.119583-1.01470.156824
41-0.120436-1.02190.155117
42-0.119641-1.01520.156708
43-0.111516-0.94620.173594
44-0.095453-0.80990.210321
45-0.079976-0.67860.249778
46-0.063539-0.53910.295726
47-0.053659-0.45530.325129
48-0.04676-0.39680.346354

\begin{tabular}{lllllllll}
\hline
Autocorrelation Function \tabularnewline
Time lag k & ACF(k) & T-STAT & P-value \tabularnewline
1 & 0.911676 & 7.7358 & 0 \tabularnewline
2 & 0.798324 & 6.774 & 0 \tabularnewline
3 & 0.675564 & 5.7324 & 0 \tabularnewline
4 & 0.5625 & 4.773 & 5e-06 \tabularnewline
5 & 0.459858 & 3.902 & 0.000106 \tabularnewline
6 & 0.371345 & 3.151 & 0.001186 \tabularnewline
7 & 0.297067 & 2.5207 & 0.006964 \tabularnewline
8 & 0.231391 & 1.9634 & 0.02673 \tabularnewline
9 & 0.173103 & 1.4688 & 0.073117 \tabularnewline
10 & 0.12249 & 1.0394 & 0.151057 \tabularnewline
11 & 0.068158 & 0.5783 & 0.282419 \tabularnewline
12 & 0.016596 & 0.1408 & 0.444202 \tabularnewline
13 & -0.029381 & -0.2493 & 0.401918 \tabularnewline
14 & -0.069856 & -0.5927 & 0.277604 \tabularnewline
15 & -0.104217 & -0.8843 & 0.189737 \tabularnewline
16 & -0.13142 & -1.1151 & 0.13425 \tabularnewline
17 & -0.159074 & -1.3498 & 0.090656 \tabularnewline
18 & -0.18582 & -1.5767 & 0.05962 \tabularnewline
19 & -0.211634 & -1.7958 & 0.038363 \tabularnewline
20 & -0.238761 & -2.026 & 0.023238 \tabularnewline
21 & -0.265456 & -2.2525 & 0.013671 \tabularnewline
22 & -0.288632 & -2.4491 & 0.008378 \tabularnewline
23 & -0.303995 & -2.5795 & 0.005968 \tabularnewline
24 & -0.310375 & -2.6336 & 0.005167 \tabularnewline
25 & -0.306103 & -2.5974 & 0.005692 \tabularnewline
26 & -0.293167 & -2.4876 & 0.007589 \tabularnewline
27 & -0.282724 & -2.399 & 0.009516 \tabularnewline
28 & -0.282231 & -2.3948 & 0.009616 \tabularnewline
29 & -0.279015 & -2.3675 & 0.010299 \tabularnewline
30 & -0.274656 & -2.3305 & 0.011292 \tabularnewline
31 & -0.268302 & -2.2766 & 0.012892 \tabularnewline
32 & -0.256275 & -2.1746 & 0.016475 \tabularnewline
33 & -0.236703 & -2.0085 & 0.024171 \tabularnewline
34 & -0.213353 & -1.8104 & 0.037206 \tabularnewline
35 & -0.184733 & -1.5675 & 0.06069 \tabularnewline
36 & -0.15497 & -1.315 & 0.096348 \tabularnewline
37 & -0.130885 & -1.1106 & 0.135219 \tabularnewline
38 & -0.121034 & -1.027 & 0.153928 \tabularnewline
39 & -0.118222 & -1.0031 & 0.159575 \tabularnewline
40 & -0.119583 & -1.0147 & 0.156824 \tabularnewline
41 & -0.120436 & -1.0219 & 0.155117 \tabularnewline
42 & -0.119641 & -1.0152 & 0.156708 \tabularnewline
43 & -0.111516 & -0.9462 & 0.173594 \tabularnewline
44 & -0.095453 & -0.8099 & 0.210321 \tabularnewline
45 & -0.079976 & -0.6786 & 0.249778 \tabularnewline
46 & -0.063539 & -0.5391 & 0.295726 \tabularnewline
47 & -0.053659 & -0.4553 & 0.325129 \tabularnewline
48 & -0.04676 & -0.3968 & 0.346354 \tabularnewline
\hline
\end{tabular}
%Source: https://freestatistics.org/blog/index.php?pk=77637&T=1

[TABLE]
[ROW][C]Autocorrelation Function[/C][/ROW]
[ROW][C]Time lag k[/C][C]ACF(k)[/C][C]T-STAT[/C][C]P-value[/C][/ROW]
[ROW][C]1[/C][C]0.911676[/C][C]7.7358[/C][C]0[/C][/ROW]
[ROW][C]2[/C][C]0.798324[/C][C]6.774[/C][C]0[/C][/ROW]
[ROW][C]3[/C][C]0.675564[/C][C]5.7324[/C][C]0[/C][/ROW]
[ROW][C]4[/C][C]0.5625[/C][C]4.773[/C][C]5e-06[/C][/ROW]
[ROW][C]5[/C][C]0.459858[/C][C]3.902[/C][C]0.000106[/C][/ROW]
[ROW][C]6[/C][C]0.371345[/C][C]3.151[/C][C]0.001186[/C][/ROW]
[ROW][C]7[/C][C]0.297067[/C][C]2.5207[/C][C]0.006964[/C][/ROW]
[ROW][C]8[/C][C]0.231391[/C][C]1.9634[/C][C]0.02673[/C][/ROW]
[ROW][C]9[/C][C]0.173103[/C][C]1.4688[/C][C]0.073117[/C][/ROW]
[ROW][C]10[/C][C]0.12249[/C][C]1.0394[/C][C]0.151057[/C][/ROW]
[ROW][C]11[/C][C]0.068158[/C][C]0.5783[/C][C]0.282419[/C][/ROW]
[ROW][C]12[/C][C]0.016596[/C][C]0.1408[/C][C]0.444202[/C][/ROW]
[ROW][C]13[/C][C]-0.029381[/C][C]-0.2493[/C][C]0.401918[/C][/ROW]
[ROW][C]14[/C][C]-0.069856[/C][C]-0.5927[/C][C]0.277604[/C][/ROW]
[ROW][C]15[/C][C]-0.104217[/C][C]-0.8843[/C][C]0.189737[/C][/ROW]
[ROW][C]16[/C][C]-0.13142[/C][C]-1.1151[/C][C]0.13425[/C][/ROW]
[ROW][C]17[/C][C]-0.159074[/C][C]-1.3498[/C][C]0.090656[/C][/ROW]
[ROW][C]18[/C][C]-0.18582[/C][C]-1.5767[/C][C]0.05962[/C][/ROW]
[ROW][C]19[/C][C]-0.211634[/C][C]-1.7958[/C][C]0.038363[/C][/ROW]
[ROW][C]20[/C][C]-0.238761[/C][C]-2.026[/C][C]0.023238[/C][/ROW]
[ROW][C]21[/C][C]-0.265456[/C][C]-2.2525[/C][C]0.013671[/C][/ROW]
[ROW][C]22[/C][C]-0.288632[/C][C]-2.4491[/C][C]0.008378[/C][/ROW]
[ROW][C]23[/C][C]-0.303995[/C][C]-2.5795[/C][C]0.005968[/C][/ROW]
[ROW][C]24[/C][C]-0.310375[/C][C]-2.6336[/C][C]0.005167[/C][/ROW]
[ROW][C]25[/C][C]-0.306103[/C][C]-2.5974[/C][C]0.005692[/C][/ROW]
[ROW][C]26[/C][C]-0.293167[/C][C]-2.4876[/C][C]0.007589[/C][/ROW]
[ROW][C]27[/C][C]-0.282724[/C][C]-2.399[/C][C]0.009516[/C][/ROW]
[ROW][C]28[/C][C]-0.282231[/C][C]-2.3948[/C][C]0.009616[/C][/ROW]
[ROW][C]29[/C][C]-0.279015[/C][C]-2.3675[/C][C]0.010299[/C][/ROW]
[ROW][C]30[/C][C]-0.274656[/C][C]-2.3305[/C][C]0.011292[/C][/ROW]
[ROW][C]31[/C][C]-0.268302[/C][C]-2.2766[/C][C]0.012892[/C][/ROW]
[ROW][C]32[/C][C]-0.256275[/C][C]-2.1746[/C][C]0.016475[/C][/ROW]
[ROW][C]33[/C][C]-0.236703[/C][C]-2.0085[/C][C]0.024171[/C][/ROW]
[ROW][C]34[/C][C]-0.213353[/C][C]-1.8104[/C][C]0.037206[/C][/ROW]
[ROW][C]35[/C][C]-0.184733[/C][C]-1.5675[/C][C]0.06069[/C][/ROW]
[ROW][C]36[/C][C]-0.15497[/C][C]-1.315[/C][C]0.096348[/C][/ROW]
[ROW][C]37[/C][C]-0.130885[/C][C]-1.1106[/C][C]0.135219[/C][/ROW]
[ROW][C]38[/C][C]-0.121034[/C][C]-1.027[/C][C]0.153928[/C][/ROW]
[ROW][C]39[/C][C]-0.118222[/C][C]-1.0031[/C][C]0.159575[/C][/ROW]
[ROW][C]40[/C][C]-0.119583[/C][C]-1.0147[/C][C]0.156824[/C][/ROW]
[ROW][C]41[/C][C]-0.120436[/C][C]-1.0219[/C][C]0.155117[/C][/ROW]
[ROW][C]42[/C][C]-0.119641[/C][C]-1.0152[/C][C]0.156708[/C][/ROW]
[ROW][C]43[/C][C]-0.111516[/C][C]-0.9462[/C][C]0.173594[/C][/ROW]
[ROW][C]44[/C][C]-0.095453[/C][C]-0.8099[/C][C]0.210321[/C][/ROW]
[ROW][C]45[/C][C]-0.079976[/C][C]-0.6786[/C][C]0.249778[/C][/ROW]
[ROW][C]46[/C][C]-0.063539[/C][C]-0.5391[/C][C]0.295726[/C][/ROW]
[ROW][C]47[/C][C]-0.053659[/C][C]-0.4553[/C][C]0.325129[/C][/ROW]
[ROW][C]48[/C][C]-0.04676[/C][C]-0.3968[/C][C]0.346354[/C][/ROW]
[/TABLE]
Source: https://freestatistics.org/blog/index.php?pk=77637&T=1

Globally Unique Identifier (entire table): ba.freestatistics.org/blog/index.php?pk=77637&T=1

As an alternative you can also use a QR Code:  

The GUIDs for individual cells are displayed in the table below:

Autocorrelation Function
Time lag kACF(k)T-STATP-value
10.9116767.73580
20.7983246.7740
30.6755645.73240
40.56254.7735e-06
50.4598583.9020.000106
60.3713453.1510.001186
70.2970672.52070.006964
80.2313911.96340.02673
90.1731031.46880.073117
100.122491.03940.151057
110.0681580.57830.282419
120.0165960.14080.444202
13-0.029381-0.24930.401918
14-0.069856-0.59270.277604
15-0.104217-0.88430.189737
16-0.13142-1.11510.13425
17-0.159074-1.34980.090656
18-0.18582-1.57670.05962
19-0.211634-1.79580.038363
20-0.238761-2.0260.023238
21-0.265456-2.25250.013671
22-0.288632-2.44910.008378
23-0.303995-2.57950.005968
24-0.310375-2.63360.005167
25-0.306103-2.59740.005692
26-0.293167-2.48760.007589
27-0.282724-2.3990.009516
28-0.282231-2.39480.009616
29-0.279015-2.36750.010299
30-0.274656-2.33050.011292
31-0.268302-2.27660.012892
32-0.256275-2.17460.016475
33-0.236703-2.00850.024171
34-0.213353-1.81040.037206
35-0.184733-1.56750.06069
36-0.15497-1.3150.096348
37-0.130885-1.11060.135219
38-0.121034-1.0270.153928
39-0.118222-1.00310.159575
40-0.119583-1.01470.156824
41-0.120436-1.02190.155117
42-0.119641-1.01520.156708
43-0.111516-0.94620.173594
44-0.095453-0.80990.210321
45-0.079976-0.67860.249778
46-0.063539-0.53910.295726
47-0.053659-0.45530.325129
48-0.04676-0.39680.346354


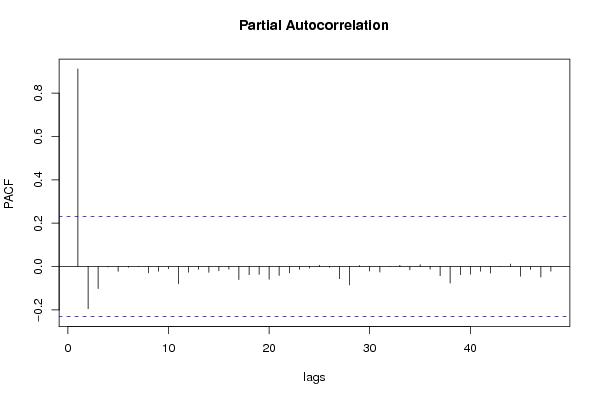
Partial Autocorrelation Function
Time lag kPACF(k)T-STATP-value
10.9116767.73580
2-0.194426-1.64980.051675
3-0.101565-0.86180.195828
4-0.001768-0.0150.494037
5-0.022017-0.18680.426165
6-0.002955-0.02510.490032
70.0013960.01180.49529
8-0.028538-0.24220.404676
9-0.021561-0.1830.427674
10-0.010513-0.08920.464582
11-0.079599-0.67540.250786
12-0.025828-0.21920.413575
13-0.012534-0.10640.457797
14-0.02673-0.22680.410605
15-0.019327-0.1640.435097
16-0.011776-0.09990.460341
17-0.059958-0.50880.306237
18-0.03745-0.31780.375788
19-0.035437-0.30070.382259
20-0.058077-0.49280.311826
21-0.041083-0.34860.364202
22-0.028904-0.24530.403478
23-0.013173-0.11180.455655
24-0.006695-0.05680.477429
250.0056650.04810.480895
26-0.003151-0.02670.489373
27-0.055825-0.47370.318578
28-0.084695-0.71870.237337
290.0045310.03840.484719
30-0.020769-0.17620.430302
31-0.025123-0.21320.415895
320.000740.00630.497502
330.00590.05010.480104
34-0.014851-0.1260.450035
350.0087280.07410.470584
36-0.012289-0.10430.458621
37-0.041749-0.35430.362093
38-0.075903-0.64410.260793
39-0.037619-0.31920.375245
40-0.034829-0.29550.384217
41-0.02139-0.18150.428241
42-0.029876-0.25350.400301
430.001090.00920.496324
440.0115510.0980.461098
45-0.044167-0.37480.354467
46-0.013655-0.11590.45404
47-0.048572-0.41210.340729
48-0.02104-0.17850.429403

\begin{tabular}{lllllllll}
\hline
Partial Autocorrelation Function \tabularnewline
Time lag k & PACF(k) & T-STAT & P-value \tabularnewline
1 & 0.911676 & 7.7358 & 0 \tabularnewline
2 & -0.194426 & -1.6498 & 0.051675 \tabularnewline
3 & -0.101565 & -0.8618 & 0.195828 \tabularnewline
4 & -0.001768 & -0.015 & 0.494037 \tabularnewline
5 & -0.022017 & -0.1868 & 0.426165 \tabularnewline
6 & -0.002955 & -0.0251 & 0.490032 \tabularnewline
7 & 0.001396 & 0.0118 & 0.49529 \tabularnewline
8 & -0.028538 & -0.2422 & 0.404676 \tabularnewline
9 & -0.021561 & -0.183 & 0.427674 \tabularnewline
10 & -0.010513 & -0.0892 & 0.464582 \tabularnewline
11 & -0.079599 & -0.6754 & 0.250786 \tabularnewline
12 & -0.025828 & -0.2192 & 0.413575 \tabularnewline
13 & -0.012534 & -0.1064 & 0.457797 \tabularnewline
14 & -0.02673 & -0.2268 & 0.410605 \tabularnewline
15 & -0.019327 & -0.164 & 0.435097 \tabularnewline
16 & -0.011776 & -0.0999 & 0.460341 \tabularnewline
17 & -0.059958 & -0.5088 & 0.306237 \tabularnewline
18 & -0.03745 & -0.3178 & 0.375788 \tabularnewline
19 & -0.035437 & -0.3007 & 0.382259 \tabularnewline
20 & -0.058077 & -0.4928 & 0.311826 \tabularnewline
21 & -0.041083 & -0.3486 & 0.364202 \tabularnewline
22 & -0.028904 & -0.2453 & 0.403478 \tabularnewline
23 & -0.013173 & -0.1118 & 0.455655 \tabularnewline
24 & -0.006695 & -0.0568 & 0.477429 \tabularnewline
25 & 0.005665 & 0.0481 & 0.480895 \tabularnewline
26 & -0.003151 & -0.0267 & 0.489373 \tabularnewline
27 & -0.055825 & -0.4737 & 0.318578 \tabularnewline
28 & -0.084695 & -0.7187 & 0.237337 \tabularnewline
29 & 0.004531 & 0.0384 & 0.484719 \tabularnewline
30 & -0.020769 & -0.1762 & 0.430302 \tabularnewline
31 & -0.025123 & -0.2132 & 0.415895 \tabularnewline
32 & 0.00074 & 0.0063 & 0.497502 \tabularnewline
33 & 0.0059 & 0.0501 & 0.480104 \tabularnewline
34 & -0.014851 & -0.126 & 0.450035 \tabularnewline
35 & 0.008728 & 0.0741 & 0.470584 \tabularnewline
36 & -0.012289 & -0.1043 & 0.458621 \tabularnewline
37 & -0.041749 & -0.3543 & 0.362093 \tabularnewline
38 & -0.075903 & -0.6441 & 0.260793 \tabularnewline
39 & -0.037619 & -0.3192 & 0.375245 \tabularnewline
40 & -0.034829 & -0.2955 & 0.384217 \tabularnewline
41 & -0.02139 & -0.1815 & 0.428241 \tabularnewline
42 & -0.029876 & -0.2535 & 0.400301 \tabularnewline
43 & 0.00109 & 0.0092 & 0.496324 \tabularnewline
44 & 0.011551 & 0.098 & 0.461098 \tabularnewline
45 & -0.044167 & -0.3748 & 0.354467 \tabularnewline
46 & -0.013655 & -0.1159 & 0.45404 \tabularnewline
47 & -0.048572 & -0.4121 & 0.340729 \tabularnewline
48 & -0.02104 & -0.1785 & 0.429403 \tabularnewline
\hline
\end{tabular}
%Source: https://freestatistics.org/blog/index.php?pk=77637&T=2

[TABLE]
[ROW][C]Partial Autocorrelation Function[/C][/ROW]
[ROW][C]Time lag k[/C][C]PACF(k)[/C][C]T-STAT[/C][C]P-value[/C][/ROW]
[ROW][C]1[/C][C]0.911676[/C][C]7.7358[/C][C]0[/C][/ROW]
[ROW][C]2[/C][C]-0.194426[/C][C]-1.6498[/C][C]0.051675[/C][/ROW]
[ROW][C]3[/C][C]-0.101565[/C][C]-0.8618[/C][C]0.195828[/C][/ROW]
[ROW][C]4[/C][C]-0.001768[/C][C]-0.015[/C][C]0.494037[/C][/ROW]
[ROW][C]5[/C][C]-0.022017[/C][C]-0.1868[/C][C]0.426165[/C][/ROW]
[ROW][C]6[/C][C]-0.002955[/C][C]-0.0251[/C][C]0.490032[/C][/ROW]
[ROW][C]7[/C][C]0.001396[/C][C]0.0118[/C][C]0.49529[/C][/ROW]
[ROW][C]8[/C][C]-0.028538[/C][C]-0.2422[/C][C]0.404676[/C][/ROW]
[ROW][C]9[/C][C]-0.021561[/C][C]-0.183[/C][C]0.427674[/C][/ROW]
[ROW][C]10[/C][C]-0.010513[/C][C]-0.0892[/C][C]0.464582[/C][/ROW]
[ROW][C]11[/C][C]-0.079599[/C][C]-0.6754[/C][C]0.250786[/C][/ROW]
[ROW][C]12[/C][C]-0.025828[/C][C]-0.2192[/C][C]0.413575[/C][/ROW]
[ROW][C]13[/C][C]-0.012534[/C][C]-0.1064[/C][C]0.457797[/C][/ROW]
[ROW][C]14[/C][C]-0.02673[/C][C]-0.2268[/C][C]0.410605[/C][/ROW]
[ROW][C]15[/C][C]-0.019327[/C][C]-0.164[/C][C]0.435097[/C][/ROW]
[ROW][C]16[/C][C]-0.011776[/C][C]-0.0999[/C][C]0.460341[/C][/ROW]
[ROW][C]17[/C][C]-0.059958[/C][C]-0.5088[/C][C]0.306237[/C][/ROW]
[ROW][C]18[/C][C]-0.03745[/C][C]-0.3178[/C][C]0.375788[/C][/ROW]
[ROW][C]19[/C][C]-0.035437[/C][C]-0.3007[/C][C]0.382259[/C][/ROW]
[ROW][C]20[/C][C]-0.058077[/C][C]-0.4928[/C][C]0.311826[/C][/ROW]
[ROW][C]21[/C][C]-0.041083[/C][C]-0.3486[/C][C]0.364202[/C][/ROW]
[ROW][C]22[/C][C]-0.028904[/C][C]-0.2453[/C][C]0.403478[/C][/ROW]
[ROW][C]23[/C][C]-0.013173[/C][C]-0.1118[/C][C]0.455655[/C][/ROW]
[ROW][C]24[/C][C]-0.006695[/C][C]-0.0568[/C][C]0.477429[/C][/ROW]
[ROW][C]25[/C][C]0.005665[/C][C]0.0481[/C][C]0.480895[/C][/ROW]
[ROW][C]26[/C][C]-0.003151[/C][C]-0.0267[/C][C]0.489373[/C][/ROW]
[ROW][C]27[/C][C]-0.055825[/C][C]-0.4737[/C][C]0.318578[/C][/ROW]
[ROW][C]28[/C][C]-0.084695[/C][C]-0.7187[/C][C]0.237337[/C][/ROW]
[ROW][C]29[/C][C]0.004531[/C][C]0.0384[/C][C]0.484719[/C][/ROW]
[ROW][C]30[/C][C]-0.020769[/C][C]-0.1762[/C][C]0.430302[/C][/ROW]
[ROW][C]31[/C][C]-0.025123[/C][C]-0.2132[/C][C]0.415895[/C][/ROW]
[ROW][C]32[/C][C]0.00074[/C][C]0.0063[/C][C]0.497502[/C][/ROW]
[ROW][C]33[/C][C]0.0059[/C][C]0.0501[/C][C]0.480104[/C][/ROW]
[ROW][C]34[/C][C]-0.014851[/C][C]-0.126[/C][C]0.450035[/C][/ROW]
[ROW][C]35[/C][C]0.008728[/C][C]0.0741[/C][C]0.470584[/C][/ROW]
[ROW][C]36[/C][C]-0.012289[/C][C]-0.1043[/C][C]0.458621[/C][/ROW]
[ROW][C]37[/C][C]-0.041749[/C][C]-0.3543[/C][C]0.362093[/C][/ROW]
[ROW][C]38[/C][C]-0.075903[/C][C]-0.6441[/C][C]0.260793[/C][/ROW]
[ROW][C]39[/C][C]-0.037619[/C][C]-0.3192[/C][C]0.375245[/C][/ROW]
[ROW][C]40[/C][C]-0.034829[/C][C]-0.2955[/C][C]0.384217[/C][/ROW]
[ROW][C]41[/C][C]-0.02139[/C][C]-0.1815[/C][C]0.428241[/C][/ROW]
[ROW][C]42[/C][C]-0.029876[/C][C]-0.2535[/C][C]0.400301[/C][/ROW]
[ROW][C]43[/C][C]0.00109[/C][C]0.0092[/C][C]0.496324[/C][/ROW]
[ROW][C]44[/C][C]0.011551[/C][C]0.098[/C][C]0.461098[/C][/ROW]
[ROW][C]45[/C][C]-0.044167[/C][C]-0.3748[/C][C]0.354467[/C][/ROW]
[ROW][C]46[/C][C]-0.013655[/C][C]-0.1159[/C][C]0.45404[/C][/ROW]
[ROW][C]47[/C][C]-0.048572[/C][C]-0.4121[/C][C]0.340729[/C][/ROW]
[ROW][C]48[/C][C]-0.02104[/C][C]-0.1785[/C][C]0.429403[/C][/ROW]
[/TABLE]
Source: https://freestatistics.org/blog/index.php?pk=77637&T=2

Globally Unique Identifier (entire table): ba.freestatistics.org/blog/index.php?pk=77637&T=2

As an alternative you can also use a QR Code:  

The GUIDs for individual cells are displayed in the table below:

Partial Autocorrelation Function
Time lag kPACF(k)T-STATP-value
10.9116767.73580
2-0.194426-1.64980.051675
3-0.101565-0.86180.195828
4-0.001768-0.0150.494037
5-0.022017-0.18680.426165
6-0.002955-0.02510.490032
70.0013960.01180.49529
8-0.028538-0.24220.404676
9-0.021561-0.1830.427674
10-0.010513-0.08920.464582
11-0.079599-0.67540.250786
12-0.025828-0.21920.413575
13-0.012534-0.10640.457797
14-0.02673-0.22680.410605
15-0.019327-0.1640.435097
16-0.011776-0.09990.460341
17-0.059958-0.50880.306237
18-0.03745-0.31780.375788
19-0.035437-0.30070.382259
20-0.058077-0.49280.311826
21-0.041083-0.34860.364202
22-0.028904-0.24530.403478
23-0.013173-0.11180.455655
24-0.006695-0.05680.477429
250.0056650.04810.480895
26-0.003151-0.02670.489373
27-0.055825-0.47370.318578
28-0.084695-0.71870.237337
290.0045310.03840.484719
30-0.020769-0.17620.430302
31-0.025123-0.21320.415895
320.000740.00630.497502
330.00590.05010.480104
34-0.014851-0.1260.450035
350.0087280.07410.470584
36-0.012289-0.10430.458621
37-0.041749-0.35430.362093
38-0.075903-0.64410.260793
39-0.037619-0.31920.375245
40-0.034829-0.29550.384217
41-0.02139-0.18150.428241
42-0.029876-0.25350.400301
430.001090.00920.496324
440.0115510.0980.461098
45-0.044167-0.37480.354467
46-0.013655-0.11590.45404
47-0.048572-0.41210.340729
48-0.02104-0.17850.429403


Parameters (Session):
par1 = 48 ; par2 = 1 ; par3 = 0 ; par4 = 0 ; par5 = 12 ; par6 = White Noise ; par7 = 0.95 ;
Parameters (R input):
par1 = 48 ; par2 = 1 ; par3 = 0 ; par4 = 0 ; par5 = 12 ; par6 = White Noise ; par7 = 0.95 ;
R code (references can be found in the software module):
if (par1 == 'Default') {
par1 = 10*log10(length(x))
} else {
par1 <- as.numeric(par1)
}
par2 <- as.numeric(par2)
par3 <- as.numeric(par3)
par4 <- as.numeric(par4)
par5 <- as.numeric(par5)
if (par6 == 'White Noise') par6 <- 'white' else par6 <- 'ma'
par7 <- as.numeric(par7)
if (par2 == 0) {
x <- log(x)
} else {
x <- (x ^ par2 - 1) / par2
}
if (par3 > 0) x <- diff(x,lag=1,difference=par3)
if (par4 > 0) x <- diff(x,lag=par5,difference=par4)
bitmap(file='pic1.png')
racf <- acf(x, par1, main='Autocorrelation', xlab='time lag', ylab='ACF', ci.type=par6, ci=par7, sub=paste('(lambda=',par2,', d=',par3,', D=',par4,', CI=', par7, ', CI type=',par6,')',sep=''))
dev.off()
bitmap(file='pic2.png')
rpacf <- pacf(x,par1,main='Partial Autocorrelation',xlab='lags',ylab='PACF')
dev.off()
(myacf <- c(racf$acf))
(mypacf <- c(rpacf$acf))
lengthx <- length(x)
sqrtn <- sqrt(lengthx)
load(file='createtable')
a<-table.start()
a<-table.row.start(a)
a<-table.element(a,'Autocorrelation Function',4,TRUE)
a<-table.row.end(a)
a<-table.row.start(a)
a<-table.element(a,'Time lag k',header=TRUE)
a<-table.element(a,hyperlink('basics.htm','ACF(k)','click here for more information about the Autocorrelation Function'),header=TRUE)
a<-table.element(a,'T-STAT',header=TRUE)
a<-table.element(a,'P-value',header=TRUE)
a<-table.row.end(a)
for (i in 2:(par1+1)) {
a<-table.row.start(a)
a<-table.element(a,i-1,header=TRUE)
a<-table.element(a,round(myacf[i],6))
mytstat <- myacf[i]*sqrtn
a<-table.element(a,round(mytstat,4))
a<-table.element(a,round(1-pt(abs(mytstat),lengthx),6))
a<-table.row.end(a)
}
a<-table.end(a)
table.save(a,file='mytable.tab')
a<-table.start()
a<-table.row.start(a)
a<-table.element(a,'Partial Autocorrelation Function',4,TRUE)
a<-table.row.end(a)
a<-table.row.start(a)
a<-table.element(a,'Time lag k',header=TRUE)
a<-table.element(a,hyperlink('basics.htm','PACF(k)','click here for more information about the Partial Autocorrelation Function'),header=TRUE)
a<-table.element(a,'T-STAT',header=TRUE)
a<-table.element(a,'P-value',header=TRUE)
a<-table.row.end(a)
for (i in 1:par1) {
a<-table.row.start(a)
a<-table.element(a,i,header=TRUE)
a<-table.element(a,round(mypacf[i],6))
mytstat <- mypacf[i]*sqrtn
a<-table.element(a,round(mytstat,4))
a<-table.element(a,round(1-pt(abs(mytstat),lengthx),6))
a<-table.row.end(a)
}
a<-table.end(a)
table.save(a,file='mytable1.tab')