Free Statistics

of Irreproducible Research!

Author's title

Author*Unverified author*
R Software Modulerwasp_autocorrelation.wasp
Title produced by software(Partial) Autocorrelation Function
Date of computationSun, 06 Jun 2010 09:38:10 +0000
Cite this page as followsStatistical Computations at FreeStatistics.org, Office for Research Development and Education, URL https://freestatistics.org/blog/index.php?v=date/2010/Jun/06/t1275817159jzwxti0xyyub7nr.htm/, Retrieved Sat, 27 Apr 2024 20:24:55 +0000
Statistical Computations at FreeStatistics.org, Office for Research Development and Education, URL https://freestatistics.org/blog/index.php?pk=77638, Retrieved Sat, 27 Apr 2024 20:24:55 +0000
QR Codes:

Original text written by user:
IsPrivate?No (this computation is public)
User-defined keywords
Estimated Impact150
Family? (F = Feedback message, R = changed R code, M = changed R Module, P = changed Parameters, D = changed Data)
-       [(Partial) Autocorrelation Function] [IKO opgave 6bis oe 4] [2010-06-06 09:38:10] [bf0252597522c891d765285c82c7204e] [Current]
Feedback Forum

Post a new message
Dataseries X:
278.1
283.3
287
287.9
279.7
273.2
272.6
274.8
277.2
277.5
278.7
279
280.1
280.8
280.1
270.5
260
258.2
260.1
262.2
263.4
264.7
267.4
266.8
265.2
262.5
255
252.8
249.6
254.2
259.4
260.8
261.6
257.2
249.8
235.2
227.4
223.1
221.6
218.5
220.1
222.1
222.9
222.8
222.1
209
201.7
204.5
208.7
213
218.6
221.9
224.6
226.8
229.6
231.4
229.1
232.7
236.6
242.2
251.5
261.5
266.4
280.9
294.4
308.8
328.8
348.2
365.9
387.5
395.9
395.8


Summary of computational transaction
Raw Inputview raw input (R code)
Raw Outputview raw output of R engine
Computing time3 seconds
R Server'George Udny Yule' @ 72.249.76.132

\begin{tabular}{lllllllll}
\hline
Summary of computational transaction \tabularnewline
Raw Input & view raw input (R code)  \tabularnewline
Raw Output & view raw output of R engine  \tabularnewline
Computing time & 3 seconds \tabularnewline
R Server & 'George Udny Yule' @ 72.249.76.132 \tabularnewline
\hline
\end{tabular}
%Source: https://freestatistics.org/blog/index.php?pk=77638&T=0

[TABLE]
[ROW][C]Summary of computational transaction[/C][/ROW]
[ROW][C]Raw Input[/C][C]view raw input (R code) [/C][/ROW]
[ROW][C]Raw Output[/C][C]view raw output of R engine [/C][/ROW]
[ROW][C]Computing time[/C][C]3 seconds[/C][/ROW]
[ROW][C]R Server[/C][C]'George Udny Yule' @ 72.249.76.132[/C][/ROW]
[/TABLE]
Source: https://freestatistics.org/blog/index.php?pk=77638&T=0

Globally Unique Identifier (entire table): ba.freestatistics.org/blog/index.php?pk=77638&T=0

As an alternative you can also use a QR Code:  

The GUIDs for individual cells are displayed in the table below:

Summary of computational transaction
Raw Inputview raw input (R code)
Raw Outputview raw output of R engine
Computing time3 seconds
R Server'George Udny Yule' @ 72.249.76.132


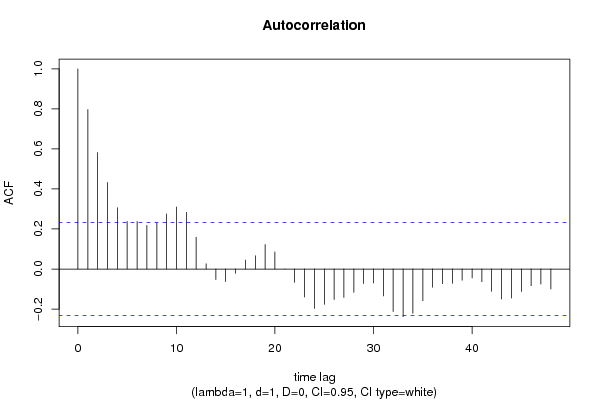
Autocorrelation Function
Time lag kACF(k)T-STATP-value
10.7966826.7130
20.5817524.90193e-06
30.4329763.64830.00025
40.3058652.57730.006018
50.2374312.00060.024629
60.2374652.00090.024613
70.2175251.83290.035505
80.2318031.95320.027368
90.2754162.32070.01159
100.3102832.61450.005452
110.2835552.38930.00977
120.1587351.33750.09266
130.0259260.21850.41385
14-0.052597-0.44320.329488
15-0.063008-0.53090.298568
16-0.02165-0.18240.427884
170.0446650.37640.353886
180.0659250.55550.290151
190.1223321.03080.153069
200.0851630.71760.237679
210.000550.00460.498158
22-0.066647-0.56160.288087
23-0.140488-1.18380.120226
24-0.197841-1.6670.049957
25-0.176622-1.48820.070558
26-0.152332-1.28360.101732
27-0.142253-1.19860.117326
28-0.116358-0.98040.165097
29-0.072943-0.61460.270381
30-0.069574-0.58620.279785
31-0.134859-1.13630.129817
32-0.212575-1.79120.038762
33-0.238193-2.0070.024276
34-0.221233-1.86410.033218
35-0.158564-1.33610.092894
36-0.090972-0.76650.222946
37-0.073559-0.61980.268681
38-0.071745-0.60450.273708
39-0.055856-0.47070.319666
40-0.044996-0.37910.352858
41-0.063291-0.53330.297745
42-0.111478-0.93930.175373
43-0.150043-1.26430.105132
44-0.145482-1.22590.112152
45-0.112614-0.94890.172944
46-0.08364-0.70480.241633
47-0.075073-0.63260.264521
48-0.100487-0.84670.199999

\begin{tabular}{lllllllll}
\hline
Autocorrelation Function \tabularnewline
Time lag k & ACF(k) & T-STAT & P-value \tabularnewline
1 & 0.796682 & 6.713 & 0 \tabularnewline
2 & 0.581752 & 4.9019 & 3e-06 \tabularnewline
3 & 0.432976 & 3.6483 & 0.00025 \tabularnewline
4 & 0.305865 & 2.5773 & 0.006018 \tabularnewline
5 & 0.237431 & 2.0006 & 0.024629 \tabularnewline
6 & 0.237465 & 2.0009 & 0.024613 \tabularnewline
7 & 0.217525 & 1.8329 & 0.035505 \tabularnewline
8 & 0.231803 & 1.9532 & 0.027368 \tabularnewline
9 & 0.275416 & 2.3207 & 0.01159 \tabularnewline
10 & 0.310283 & 2.6145 & 0.005452 \tabularnewline
11 & 0.283555 & 2.3893 & 0.00977 \tabularnewline
12 & 0.158735 & 1.3375 & 0.09266 \tabularnewline
13 & 0.025926 & 0.2185 & 0.41385 \tabularnewline
14 & -0.052597 & -0.4432 & 0.329488 \tabularnewline
15 & -0.063008 & -0.5309 & 0.298568 \tabularnewline
16 & -0.02165 & -0.1824 & 0.427884 \tabularnewline
17 & 0.044665 & 0.3764 & 0.353886 \tabularnewline
18 & 0.065925 & 0.5555 & 0.290151 \tabularnewline
19 & 0.122332 & 1.0308 & 0.153069 \tabularnewline
20 & 0.085163 & 0.7176 & 0.237679 \tabularnewline
21 & 0.00055 & 0.0046 & 0.498158 \tabularnewline
22 & -0.066647 & -0.5616 & 0.288087 \tabularnewline
23 & -0.140488 & -1.1838 & 0.120226 \tabularnewline
24 & -0.197841 & -1.667 & 0.049957 \tabularnewline
25 & -0.176622 & -1.4882 & 0.070558 \tabularnewline
26 & -0.152332 & -1.2836 & 0.101732 \tabularnewline
27 & -0.142253 & -1.1986 & 0.117326 \tabularnewline
28 & -0.116358 & -0.9804 & 0.165097 \tabularnewline
29 & -0.072943 & -0.6146 & 0.270381 \tabularnewline
30 & -0.069574 & -0.5862 & 0.279785 \tabularnewline
31 & -0.134859 & -1.1363 & 0.129817 \tabularnewline
32 & -0.212575 & -1.7912 & 0.038762 \tabularnewline
33 & -0.238193 & -2.007 & 0.024276 \tabularnewline
34 & -0.221233 & -1.8641 & 0.033218 \tabularnewline
35 & -0.158564 & -1.3361 & 0.092894 \tabularnewline
36 & -0.090972 & -0.7665 & 0.222946 \tabularnewline
37 & -0.073559 & -0.6198 & 0.268681 \tabularnewline
38 & -0.071745 & -0.6045 & 0.273708 \tabularnewline
39 & -0.055856 & -0.4707 & 0.319666 \tabularnewline
40 & -0.044996 & -0.3791 & 0.352858 \tabularnewline
41 & -0.063291 & -0.5333 & 0.297745 \tabularnewline
42 & -0.111478 & -0.9393 & 0.175373 \tabularnewline
43 & -0.150043 & -1.2643 & 0.105132 \tabularnewline
44 & -0.145482 & -1.2259 & 0.112152 \tabularnewline
45 & -0.112614 & -0.9489 & 0.172944 \tabularnewline
46 & -0.08364 & -0.7048 & 0.241633 \tabularnewline
47 & -0.075073 & -0.6326 & 0.264521 \tabularnewline
48 & -0.100487 & -0.8467 & 0.199999 \tabularnewline
\hline
\end{tabular}
%Source: https://freestatistics.org/blog/index.php?pk=77638&T=1

[TABLE]
[ROW][C]Autocorrelation Function[/C][/ROW]
[ROW][C]Time lag k[/C][C]ACF(k)[/C][C]T-STAT[/C][C]P-value[/C][/ROW]
[ROW][C]1[/C][C]0.796682[/C][C]6.713[/C][C]0[/C][/ROW]
[ROW][C]2[/C][C]0.581752[/C][C]4.9019[/C][C]3e-06[/C][/ROW]
[ROW][C]3[/C][C]0.432976[/C][C]3.6483[/C][C]0.00025[/C][/ROW]
[ROW][C]4[/C][C]0.305865[/C][C]2.5773[/C][C]0.006018[/C][/ROW]
[ROW][C]5[/C][C]0.237431[/C][C]2.0006[/C][C]0.024629[/C][/ROW]
[ROW][C]6[/C][C]0.237465[/C][C]2.0009[/C][C]0.024613[/C][/ROW]
[ROW][C]7[/C][C]0.217525[/C][C]1.8329[/C][C]0.035505[/C][/ROW]
[ROW][C]8[/C][C]0.231803[/C][C]1.9532[/C][C]0.027368[/C][/ROW]
[ROW][C]9[/C][C]0.275416[/C][C]2.3207[/C][C]0.01159[/C][/ROW]
[ROW][C]10[/C][C]0.310283[/C][C]2.6145[/C][C]0.005452[/C][/ROW]
[ROW][C]11[/C][C]0.283555[/C][C]2.3893[/C][C]0.00977[/C][/ROW]
[ROW][C]12[/C][C]0.158735[/C][C]1.3375[/C][C]0.09266[/C][/ROW]
[ROW][C]13[/C][C]0.025926[/C][C]0.2185[/C][C]0.41385[/C][/ROW]
[ROW][C]14[/C][C]-0.052597[/C][C]-0.4432[/C][C]0.329488[/C][/ROW]
[ROW][C]15[/C][C]-0.063008[/C][C]-0.5309[/C][C]0.298568[/C][/ROW]
[ROW][C]16[/C][C]-0.02165[/C][C]-0.1824[/C][C]0.427884[/C][/ROW]
[ROW][C]17[/C][C]0.044665[/C][C]0.3764[/C][C]0.353886[/C][/ROW]
[ROW][C]18[/C][C]0.065925[/C][C]0.5555[/C][C]0.290151[/C][/ROW]
[ROW][C]19[/C][C]0.122332[/C][C]1.0308[/C][C]0.153069[/C][/ROW]
[ROW][C]20[/C][C]0.085163[/C][C]0.7176[/C][C]0.237679[/C][/ROW]
[ROW][C]21[/C][C]0.00055[/C][C]0.0046[/C][C]0.498158[/C][/ROW]
[ROW][C]22[/C][C]-0.066647[/C][C]-0.5616[/C][C]0.288087[/C][/ROW]
[ROW][C]23[/C][C]-0.140488[/C][C]-1.1838[/C][C]0.120226[/C][/ROW]
[ROW][C]24[/C][C]-0.197841[/C][C]-1.667[/C][C]0.049957[/C][/ROW]
[ROW][C]25[/C][C]-0.176622[/C][C]-1.4882[/C][C]0.070558[/C][/ROW]
[ROW][C]26[/C][C]-0.152332[/C][C]-1.2836[/C][C]0.101732[/C][/ROW]
[ROW][C]27[/C][C]-0.142253[/C][C]-1.1986[/C][C]0.117326[/C][/ROW]
[ROW][C]28[/C][C]-0.116358[/C][C]-0.9804[/C][C]0.165097[/C][/ROW]
[ROW][C]29[/C][C]-0.072943[/C][C]-0.6146[/C][C]0.270381[/C][/ROW]
[ROW][C]30[/C][C]-0.069574[/C][C]-0.5862[/C][C]0.279785[/C][/ROW]
[ROW][C]31[/C][C]-0.134859[/C][C]-1.1363[/C][C]0.129817[/C][/ROW]
[ROW][C]32[/C][C]-0.212575[/C][C]-1.7912[/C][C]0.038762[/C][/ROW]
[ROW][C]33[/C][C]-0.238193[/C][C]-2.007[/C][C]0.024276[/C][/ROW]
[ROW][C]34[/C][C]-0.221233[/C][C]-1.8641[/C][C]0.033218[/C][/ROW]
[ROW][C]35[/C][C]-0.158564[/C][C]-1.3361[/C][C]0.092894[/C][/ROW]
[ROW][C]36[/C][C]-0.090972[/C][C]-0.7665[/C][C]0.222946[/C][/ROW]
[ROW][C]37[/C][C]-0.073559[/C][C]-0.6198[/C][C]0.268681[/C][/ROW]
[ROW][C]38[/C][C]-0.071745[/C][C]-0.6045[/C][C]0.273708[/C][/ROW]
[ROW][C]39[/C][C]-0.055856[/C][C]-0.4707[/C][C]0.319666[/C][/ROW]
[ROW][C]40[/C][C]-0.044996[/C][C]-0.3791[/C][C]0.352858[/C][/ROW]
[ROW][C]41[/C][C]-0.063291[/C][C]-0.5333[/C][C]0.297745[/C][/ROW]
[ROW][C]42[/C][C]-0.111478[/C][C]-0.9393[/C][C]0.175373[/C][/ROW]
[ROW][C]43[/C][C]-0.150043[/C][C]-1.2643[/C][C]0.105132[/C][/ROW]
[ROW][C]44[/C][C]-0.145482[/C][C]-1.2259[/C][C]0.112152[/C][/ROW]
[ROW][C]45[/C][C]-0.112614[/C][C]-0.9489[/C][C]0.172944[/C][/ROW]
[ROW][C]46[/C][C]-0.08364[/C][C]-0.7048[/C][C]0.241633[/C][/ROW]
[ROW][C]47[/C][C]-0.075073[/C][C]-0.6326[/C][C]0.264521[/C][/ROW]
[ROW][C]48[/C][C]-0.100487[/C][C]-0.8467[/C][C]0.199999[/C][/ROW]
[/TABLE]
Source: https://freestatistics.org/blog/index.php?pk=77638&T=1

Globally Unique Identifier (entire table): ba.freestatistics.org/blog/index.php?pk=77638&T=1

As an alternative you can also use a QR Code:  

The GUIDs for individual cells are displayed in the table below:

Autocorrelation Function
Time lag kACF(k)T-STATP-value
10.7966826.7130
20.5817524.90193e-06
30.4329763.64830.00025
40.3058652.57730.006018
50.2374312.00060.024629
60.2374652.00090.024613
70.2175251.83290.035505
80.2318031.95320.027368
90.2754162.32070.01159
100.3102832.61450.005452
110.2835552.38930.00977
120.1587351.33750.09266
130.0259260.21850.41385
14-0.052597-0.44320.329488
15-0.063008-0.53090.298568
16-0.02165-0.18240.427884
170.0446650.37640.353886
180.0659250.55550.290151
190.1223321.03080.153069
200.0851630.71760.237679
210.000550.00460.498158
22-0.066647-0.56160.288087
23-0.140488-1.18380.120226
24-0.197841-1.6670.049957
25-0.176622-1.48820.070558
26-0.152332-1.28360.101732
27-0.142253-1.19860.117326
28-0.116358-0.98040.165097
29-0.072943-0.61460.270381
30-0.069574-0.58620.279785
31-0.134859-1.13630.129817
32-0.212575-1.79120.038762
33-0.238193-2.0070.024276
34-0.221233-1.86410.033218
35-0.158564-1.33610.092894
36-0.090972-0.76650.222946
37-0.073559-0.61980.268681
38-0.071745-0.60450.273708
39-0.055856-0.47070.319666
40-0.044996-0.37910.352858
41-0.063291-0.53330.297745
42-0.111478-0.93930.175373
43-0.150043-1.26430.105132
44-0.145482-1.22590.112152
45-0.112614-0.94890.172944
46-0.08364-0.70480.241633
47-0.075073-0.63260.264521
48-0.100487-0.84670.199999


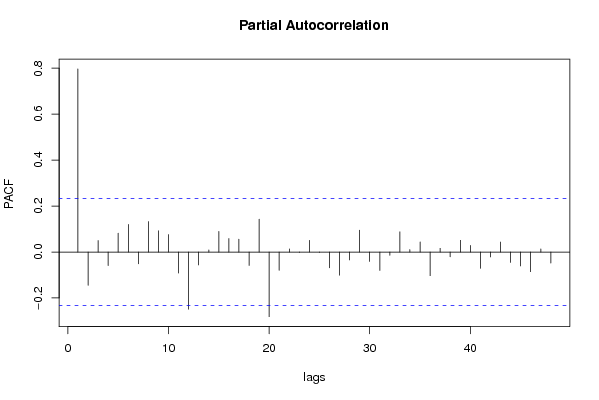
Partial Autocorrelation Function
Time lag kPACF(k)T-STATP-value
10.7966826.7130
2-0.14495-1.22140.112994
30.0497850.41950.33806
4-0.05921-0.49890.30969
50.0820480.69130.245801
60.1201581.01250.157377
7-0.051526-0.43420.332742
80.1325331.11670.133935
90.0921860.77680.219936
100.0759180.63970.262215
11-0.091772-0.77330.22096
12-0.249099-2.09890.019689
13-0.056392-0.47520.318063
140.0091670.07720.469324
150.0897520.75630.225997
160.0586190.49390.311439
170.0559330.47130.319437
18-0.058687-0.49450.311239
190.1430591.20540.116018
20-0.281345-2.37070.010237
21-0.079879-0.67310.251543
220.0134890.11370.454915
23-0.001247-0.01050.495821
240.0506260.42660.335487
25-0.001491-0.01260.495005
26-0.069028-0.58160.281325
27-0.100824-0.84960.199212
28-0.034437-0.29020.386265
290.0949640.80020.213139
30-0.041233-0.34740.364645
31-0.080162-0.67550.250791
32-0.014365-0.1210.452
330.0877360.73930.231089
340.0103860.08750.465256
350.0436410.36770.357085
36-0.103324-0.87060.193446
370.0159980.13480.446576
38-0.020906-0.17620.430334
390.0507340.42750.335156
400.0286810.24170.404867
41-0.07081-0.59670.276319
42-0.021268-0.17920.429144
430.0430590.36280.358907
44-0.045688-0.3850.350704
45-0.060442-0.50930.306062
46-0.08589-0.72370.235807
470.0131340.11070.456096
48-0.048011-0.40450.343514

\begin{tabular}{lllllllll}
\hline
Partial Autocorrelation Function \tabularnewline
Time lag k & PACF(k) & T-STAT & P-value \tabularnewline
1 & 0.796682 & 6.713 & 0 \tabularnewline
2 & -0.14495 & -1.2214 & 0.112994 \tabularnewline
3 & 0.049785 & 0.4195 & 0.33806 \tabularnewline
4 & -0.05921 & -0.4989 & 0.30969 \tabularnewline
5 & 0.082048 & 0.6913 & 0.245801 \tabularnewline
6 & 0.120158 & 1.0125 & 0.157377 \tabularnewline
7 & -0.051526 & -0.4342 & 0.332742 \tabularnewline
8 & 0.132533 & 1.1167 & 0.133935 \tabularnewline
9 & 0.092186 & 0.7768 & 0.219936 \tabularnewline
10 & 0.075918 & 0.6397 & 0.262215 \tabularnewline
11 & -0.091772 & -0.7733 & 0.22096 \tabularnewline
12 & -0.249099 & -2.0989 & 0.019689 \tabularnewline
13 & -0.056392 & -0.4752 & 0.318063 \tabularnewline
14 & 0.009167 & 0.0772 & 0.469324 \tabularnewline
15 & 0.089752 & 0.7563 & 0.225997 \tabularnewline
16 & 0.058619 & 0.4939 & 0.311439 \tabularnewline
17 & 0.055933 & 0.4713 & 0.319437 \tabularnewline
18 & -0.058687 & -0.4945 & 0.311239 \tabularnewline
19 & 0.143059 & 1.2054 & 0.116018 \tabularnewline
20 & -0.281345 & -2.3707 & 0.010237 \tabularnewline
21 & -0.079879 & -0.6731 & 0.251543 \tabularnewline
22 & 0.013489 & 0.1137 & 0.454915 \tabularnewline
23 & -0.001247 & -0.0105 & 0.495821 \tabularnewline
24 & 0.050626 & 0.4266 & 0.335487 \tabularnewline
25 & -0.001491 & -0.0126 & 0.495005 \tabularnewline
26 & -0.069028 & -0.5816 & 0.281325 \tabularnewline
27 & -0.100824 & -0.8496 & 0.199212 \tabularnewline
28 & -0.034437 & -0.2902 & 0.386265 \tabularnewline
29 & 0.094964 & 0.8002 & 0.213139 \tabularnewline
30 & -0.041233 & -0.3474 & 0.364645 \tabularnewline
31 & -0.080162 & -0.6755 & 0.250791 \tabularnewline
32 & -0.014365 & -0.121 & 0.452 \tabularnewline
33 & 0.087736 & 0.7393 & 0.231089 \tabularnewline
34 & 0.010386 & 0.0875 & 0.465256 \tabularnewline
35 & 0.043641 & 0.3677 & 0.357085 \tabularnewline
36 & -0.103324 & -0.8706 & 0.193446 \tabularnewline
37 & 0.015998 & 0.1348 & 0.446576 \tabularnewline
38 & -0.020906 & -0.1762 & 0.430334 \tabularnewline
39 & 0.050734 & 0.4275 & 0.335156 \tabularnewline
40 & 0.028681 & 0.2417 & 0.404867 \tabularnewline
41 & -0.07081 & -0.5967 & 0.276319 \tabularnewline
42 & -0.021268 & -0.1792 & 0.429144 \tabularnewline
43 & 0.043059 & 0.3628 & 0.358907 \tabularnewline
44 & -0.045688 & -0.385 & 0.350704 \tabularnewline
45 & -0.060442 & -0.5093 & 0.306062 \tabularnewline
46 & -0.08589 & -0.7237 & 0.235807 \tabularnewline
47 & 0.013134 & 0.1107 & 0.456096 \tabularnewline
48 & -0.048011 & -0.4045 & 0.343514 \tabularnewline
\hline
\end{tabular}
%Source: https://freestatistics.org/blog/index.php?pk=77638&T=2

[TABLE]
[ROW][C]Partial Autocorrelation Function[/C][/ROW]
[ROW][C]Time lag k[/C][C]PACF(k)[/C][C]T-STAT[/C][C]P-value[/C][/ROW]
[ROW][C]1[/C][C]0.796682[/C][C]6.713[/C][C]0[/C][/ROW]
[ROW][C]2[/C][C]-0.14495[/C][C]-1.2214[/C][C]0.112994[/C][/ROW]
[ROW][C]3[/C][C]0.049785[/C][C]0.4195[/C][C]0.33806[/C][/ROW]
[ROW][C]4[/C][C]-0.05921[/C][C]-0.4989[/C][C]0.30969[/C][/ROW]
[ROW][C]5[/C][C]0.082048[/C][C]0.6913[/C][C]0.245801[/C][/ROW]
[ROW][C]6[/C][C]0.120158[/C][C]1.0125[/C][C]0.157377[/C][/ROW]
[ROW][C]7[/C][C]-0.051526[/C][C]-0.4342[/C][C]0.332742[/C][/ROW]
[ROW][C]8[/C][C]0.132533[/C][C]1.1167[/C][C]0.133935[/C][/ROW]
[ROW][C]9[/C][C]0.092186[/C][C]0.7768[/C][C]0.219936[/C][/ROW]
[ROW][C]10[/C][C]0.075918[/C][C]0.6397[/C][C]0.262215[/C][/ROW]
[ROW][C]11[/C][C]-0.091772[/C][C]-0.7733[/C][C]0.22096[/C][/ROW]
[ROW][C]12[/C][C]-0.249099[/C][C]-2.0989[/C][C]0.019689[/C][/ROW]
[ROW][C]13[/C][C]-0.056392[/C][C]-0.4752[/C][C]0.318063[/C][/ROW]
[ROW][C]14[/C][C]0.009167[/C][C]0.0772[/C][C]0.469324[/C][/ROW]
[ROW][C]15[/C][C]0.089752[/C][C]0.7563[/C][C]0.225997[/C][/ROW]
[ROW][C]16[/C][C]0.058619[/C][C]0.4939[/C][C]0.311439[/C][/ROW]
[ROW][C]17[/C][C]0.055933[/C][C]0.4713[/C][C]0.319437[/C][/ROW]
[ROW][C]18[/C][C]-0.058687[/C][C]-0.4945[/C][C]0.311239[/C][/ROW]
[ROW][C]19[/C][C]0.143059[/C][C]1.2054[/C][C]0.116018[/C][/ROW]
[ROW][C]20[/C][C]-0.281345[/C][C]-2.3707[/C][C]0.010237[/C][/ROW]
[ROW][C]21[/C][C]-0.079879[/C][C]-0.6731[/C][C]0.251543[/C][/ROW]
[ROW][C]22[/C][C]0.013489[/C][C]0.1137[/C][C]0.454915[/C][/ROW]
[ROW][C]23[/C][C]-0.001247[/C][C]-0.0105[/C][C]0.495821[/C][/ROW]
[ROW][C]24[/C][C]0.050626[/C][C]0.4266[/C][C]0.335487[/C][/ROW]
[ROW][C]25[/C][C]-0.001491[/C][C]-0.0126[/C][C]0.495005[/C][/ROW]
[ROW][C]26[/C][C]-0.069028[/C][C]-0.5816[/C][C]0.281325[/C][/ROW]
[ROW][C]27[/C][C]-0.100824[/C][C]-0.8496[/C][C]0.199212[/C][/ROW]
[ROW][C]28[/C][C]-0.034437[/C][C]-0.2902[/C][C]0.386265[/C][/ROW]
[ROW][C]29[/C][C]0.094964[/C][C]0.8002[/C][C]0.213139[/C][/ROW]
[ROW][C]30[/C][C]-0.041233[/C][C]-0.3474[/C][C]0.364645[/C][/ROW]
[ROW][C]31[/C][C]-0.080162[/C][C]-0.6755[/C][C]0.250791[/C][/ROW]
[ROW][C]32[/C][C]-0.014365[/C][C]-0.121[/C][C]0.452[/C][/ROW]
[ROW][C]33[/C][C]0.087736[/C][C]0.7393[/C][C]0.231089[/C][/ROW]
[ROW][C]34[/C][C]0.010386[/C][C]0.0875[/C][C]0.465256[/C][/ROW]
[ROW][C]35[/C][C]0.043641[/C][C]0.3677[/C][C]0.357085[/C][/ROW]
[ROW][C]36[/C][C]-0.103324[/C][C]-0.8706[/C][C]0.193446[/C][/ROW]
[ROW][C]37[/C][C]0.015998[/C][C]0.1348[/C][C]0.446576[/C][/ROW]
[ROW][C]38[/C][C]-0.020906[/C][C]-0.1762[/C][C]0.430334[/C][/ROW]
[ROW][C]39[/C][C]0.050734[/C][C]0.4275[/C][C]0.335156[/C][/ROW]
[ROW][C]40[/C][C]0.028681[/C][C]0.2417[/C][C]0.404867[/C][/ROW]
[ROW][C]41[/C][C]-0.07081[/C][C]-0.5967[/C][C]0.276319[/C][/ROW]
[ROW][C]42[/C][C]-0.021268[/C][C]-0.1792[/C][C]0.429144[/C][/ROW]
[ROW][C]43[/C][C]0.043059[/C][C]0.3628[/C][C]0.358907[/C][/ROW]
[ROW][C]44[/C][C]-0.045688[/C][C]-0.385[/C][C]0.350704[/C][/ROW]
[ROW][C]45[/C][C]-0.060442[/C][C]-0.5093[/C][C]0.306062[/C][/ROW]
[ROW][C]46[/C][C]-0.08589[/C][C]-0.7237[/C][C]0.235807[/C][/ROW]
[ROW][C]47[/C][C]0.013134[/C][C]0.1107[/C][C]0.456096[/C][/ROW]
[ROW][C]48[/C][C]-0.048011[/C][C]-0.4045[/C][C]0.343514[/C][/ROW]
[/TABLE]
Source: https://freestatistics.org/blog/index.php?pk=77638&T=2

Globally Unique Identifier (entire table): ba.freestatistics.org/blog/index.php?pk=77638&T=2

As an alternative you can also use a QR Code:  

The GUIDs for individual cells are displayed in the table below:

Partial Autocorrelation Function
Time lag kPACF(k)T-STATP-value
10.7966826.7130
2-0.14495-1.22140.112994
30.0497850.41950.33806
4-0.05921-0.49890.30969
50.0820480.69130.245801
60.1201581.01250.157377
7-0.051526-0.43420.332742
80.1325331.11670.133935
90.0921860.77680.219936
100.0759180.63970.262215
11-0.091772-0.77330.22096
12-0.249099-2.09890.019689
13-0.056392-0.47520.318063
140.0091670.07720.469324
150.0897520.75630.225997
160.0586190.49390.311439
170.0559330.47130.319437
18-0.058687-0.49450.311239
190.1430591.20540.116018
20-0.281345-2.37070.010237
21-0.079879-0.67310.251543
220.0134890.11370.454915
23-0.001247-0.01050.495821
240.0506260.42660.335487
25-0.001491-0.01260.495005
26-0.069028-0.58160.281325
27-0.100824-0.84960.199212
28-0.034437-0.29020.386265
290.0949640.80020.213139
30-0.041233-0.34740.364645
31-0.080162-0.67550.250791
32-0.014365-0.1210.452
330.0877360.73930.231089
340.0103860.08750.465256
350.0436410.36770.357085
36-0.103324-0.87060.193446
370.0159980.13480.446576
38-0.020906-0.17620.430334
390.0507340.42750.335156
400.0286810.24170.404867
41-0.07081-0.59670.276319
42-0.021268-0.17920.429144
430.0430590.36280.358907
44-0.045688-0.3850.350704
45-0.060442-0.50930.306062
46-0.08589-0.72370.235807
470.0131340.11070.456096
48-0.048011-0.40450.343514


Parameters (Session):
par1 = 48 ; par2 = 1 ; par3 = 1 ; par4 = 0 ; par5 = 12 ; par6 = White Noise ; par7 = 0.95 ;
Parameters (R input):
par1 = 48 ; par2 = 1 ; par3 = 1 ; par4 = 0 ; par5 = 12 ; par6 = White Noise ; par7 = 0.95 ;
R code (references can be found in the software module):
if (par1 == 'Default') {
par1 = 10*log10(length(x))
} else {
par1 <- as.numeric(par1)
}
par2 <- as.numeric(par2)
par3 <- as.numeric(par3)
par4 <- as.numeric(par4)
par5 <- as.numeric(par5)
if (par6 == 'White Noise') par6 <- 'white' else par6 <- 'ma'
par7 <- as.numeric(par7)
if (par2 == 0) {
x <- log(x)
} else {
x <- (x ^ par2 - 1) / par2
}
if (par3 > 0) x <- diff(x,lag=1,difference=par3)
if (par4 > 0) x <- diff(x,lag=par5,difference=par4)
bitmap(file='pic1.png')
racf <- acf(x, par1, main='Autocorrelation', xlab='time lag', ylab='ACF', ci.type=par6, ci=par7, sub=paste('(lambda=',par2,', d=',par3,', D=',par4,', CI=', par7, ', CI type=',par6,')',sep=''))
dev.off()
bitmap(file='pic2.png')
rpacf <- pacf(x,par1,main='Partial Autocorrelation',xlab='lags',ylab='PACF')
dev.off()
(myacf <- c(racf$acf))
(mypacf <- c(rpacf$acf))
lengthx <- length(x)
sqrtn <- sqrt(lengthx)
load(file='createtable')
a<-table.start()
a<-table.row.start(a)
a<-table.element(a,'Autocorrelation Function',4,TRUE)
a<-table.row.end(a)
a<-table.row.start(a)
a<-table.element(a,'Time lag k',header=TRUE)
a<-table.element(a,hyperlink('basics.htm','ACF(k)','click here for more information about the Autocorrelation Function'),header=TRUE)
a<-table.element(a,'T-STAT',header=TRUE)
a<-table.element(a,'P-value',header=TRUE)
a<-table.row.end(a)
for (i in 2:(par1+1)) {
a<-table.row.start(a)
a<-table.element(a,i-1,header=TRUE)
a<-table.element(a,round(myacf[i],6))
mytstat <- myacf[i]*sqrtn
a<-table.element(a,round(mytstat,4))
a<-table.element(a,round(1-pt(abs(mytstat),lengthx),6))
a<-table.row.end(a)
}
a<-table.end(a)
table.save(a,file='mytable.tab')
a<-table.start()
a<-table.row.start(a)
a<-table.element(a,'Partial Autocorrelation Function',4,TRUE)
a<-table.row.end(a)
a<-table.row.start(a)
a<-table.element(a,'Time lag k',header=TRUE)
a<-table.element(a,hyperlink('basics.htm','PACF(k)','click here for more information about the Partial Autocorrelation Function'),header=TRUE)
a<-table.element(a,'T-STAT',header=TRUE)
a<-table.element(a,'P-value',header=TRUE)
a<-table.row.end(a)
for (i in 1:par1) {
a<-table.row.start(a)
a<-table.element(a,i,header=TRUE)
a<-table.element(a,round(mypacf[i],6))
mytstat <- mypacf[i]*sqrtn
a<-table.element(a,round(mytstat,4))
a<-table.element(a,round(1-pt(abs(mytstat),lengthx),6))
a<-table.row.end(a)
}
a<-table.end(a)
table.save(a,file='mytable1.tab')