Free Statistics

of Irreproducible Research!

Author's title

Author*Unverified author*
R Software Modulerwasp_autocorrelation.wasp
Title produced by software(Partial) Autocorrelation Function
Date of computationSun, 06 Jun 2010 14:20:13 +0000
Cite this page as followsStatistical Computations at FreeStatistics.org, Office for Research Development and Education, URL https://freestatistics.org/blog/index.php?v=date/2010/Jun/06/t1275834078igtt37wavrxzs3i.htm/, Retrieved Sun, 28 Apr 2024 00:00:10 +0000
Statistical Computations at FreeStatistics.org, Office for Research Development and Education, URL https://freestatistics.org/blog/index.php?pk=77696, Retrieved Sun, 28 Apr 2024 00:00:10 +0000
QR Codes:

Original text written by user:
IsPrivate?No (this computation is public)
User-defined keywordsKDGP2W21
Estimated Impact107
Family? (F = Feedback message, R = changed R code, M = changed R Module, P = changed Parameters, D = changed Data)
-       [(Partial) Autocorrelation Function] [Opgave 6 bis Oefe...] [2010-06-06 14:20:13] [5a7cbdb73d36823522b207a888c6ba9b] [Current]
Feedback Forum

Post a new message
Dataseries X:
0.9383
0.9217
0.9095
0.8920
0.8742
0.8607
0.8607
0.9005
0.9111
0.9059
0.8883
0.8924
0.8833
0.8700
0.8758
0.8858
0.9170
0.9554
0.9922
0.9778
0.9808
0.9811
1.0014
1.0183
1.0622
1.0773
1.0807
1.0848
1.1582
1.1663
1.1372
1.1139
1.1222
1.1692
1.1702
1.2286
1.2613
1.2646
1.2262
1.1985
1.2007
1.2138
1.2266
1.2176
1.2218
1.2490
1.2991
1.3408
1.3119
1.3014
1.3201
1.2938
1.2694
1.2165
1.2037
1.2292
1.2256
1.2015
1.1786
1.1856
1.2103
1.1938
1.2020
1.2271
1.2770
1.2650
1.2684
1.2811
1.2727
1.2611
1.2881
1.3213
1.2999
1.3074
1.3242
1.3516
1.3511
1.3419
1.3716
1.3622
1.3896
1.4227
1.4684
1.4570
1.4718
1.4748
1.5527
1.5751
1.5557
1.5553
1.5770
1.4975
1.4370
1.3322
1.2732
1.3449
1.3239
1.2785
1.3050
1.3190
1.3650
1.4016
1.4088
1.4268
1.4562
1.4816
1.4914
1.4614


Summary of computational transaction
Raw Inputview raw input (R code)
Raw Outputview raw output of R engine
Computing time1 seconds
R Server'Gwilym Jenkins' @ 72.249.127.135

\begin{tabular}{lllllllll}
\hline
Summary of computational transaction \tabularnewline
Raw Input & view raw input (R code)  \tabularnewline
Raw Output & view raw output of R engine  \tabularnewline
Computing time & 1 seconds \tabularnewline
R Server & 'Gwilym Jenkins' @ 72.249.127.135 \tabularnewline
\hline
\end{tabular}
%Source: https://freestatistics.org/blog/index.php?pk=77696&T=0

[TABLE]
[ROW][C]Summary of computational transaction[/C][/ROW]
[ROW][C]Raw Input[/C][C]view raw input (R code) [/C][/ROW]
[ROW][C]Raw Output[/C][C]view raw output of R engine [/C][/ROW]
[ROW][C]Computing time[/C][C]1 seconds[/C][/ROW]
[ROW][C]R Server[/C][C]'Gwilym Jenkins' @ 72.249.127.135[/C][/ROW]
[/TABLE]
Source: https://freestatistics.org/blog/index.php?pk=77696&T=0

Globally Unique Identifier (entire table): ba.freestatistics.org/blog/index.php?pk=77696&T=0

As an alternative you can also use a QR Code:  

The GUIDs for individual cells are displayed in the table below:

Summary of computational transaction
Raw Inputview raw input (R code)
Raw Outputview raw output of R engine
Computing time1 seconds
R Server'Gwilym Jenkins' @ 72.249.127.135


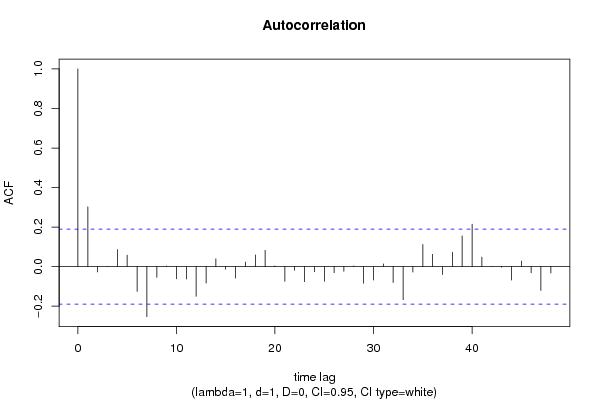
Autocorrelation Function
Time lag kACF(k)T-STATP-value
10.3021923.12590.001141
2-0.026827-0.27750.390965
30.0013920.01440.494268
40.0862640.89230.187112
50.0575120.59490.276579
6-0.12544-1.29760.098614
7-0.253243-2.61960.005041
8-0.054297-0.56170.287763
90.0027880.02880.488524
10-0.062058-0.64190.261144
11-0.062817-0.64980.258612
12-0.150573-1.55750.061148
13-0.083067-0.85930.196061
140.0393040.40660.342571
15-0.013153-0.13610.446017
16-0.057937-0.59930.275116
170.0230530.23850.405991
180.0592490.61290.270629
190.0827370.85580.197
200.0035770.0370.485275
21-0.074159-0.76710.222354
22-0.018819-0.19470.42301
23-0.07603-0.78650.216668
24-0.026594-0.27510.391887
25-0.074385-0.76940.221661
26-0.030752-0.31810.375513
27-0.024-0.24830.402206
280.0031970.03310.486841
29-0.084579-0.87490.191795
30-0.068223-0.70570.240952
310.01320.13650.445827
32-0.080806-0.83590.202548
33-0.167154-1.72910.043341
34-0.027735-0.28690.387376
350.1119861.15840.124642
360.0623080.64450.260309
37-0.040493-0.41890.338079
380.0730280.75540.225833
390.1549881.60320.055918
400.2146742.22060.014243
410.0479520.4960.310448
420.0001920.0020.499208
43-0.002929-0.03030.487942
44-0.067961-0.7030.241792
450.0283160.29290.38508
46-0.031206-0.32280.373738
47-0.120889-1.25050.106924
48-0.032627-0.33750.368202

\begin{tabular}{lllllllll}
\hline
Autocorrelation Function \tabularnewline
Time lag k & ACF(k) & T-STAT & P-value \tabularnewline
1 & 0.302192 & 3.1259 & 0.001141 \tabularnewline
2 & -0.026827 & -0.2775 & 0.390965 \tabularnewline
3 & 0.001392 & 0.0144 & 0.494268 \tabularnewline
4 & 0.086264 & 0.8923 & 0.187112 \tabularnewline
5 & 0.057512 & 0.5949 & 0.276579 \tabularnewline
6 & -0.12544 & -1.2976 & 0.098614 \tabularnewline
7 & -0.253243 & -2.6196 & 0.005041 \tabularnewline
8 & -0.054297 & -0.5617 & 0.287763 \tabularnewline
9 & 0.002788 & 0.0288 & 0.488524 \tabularnewline
10 & -0.062058 & -0.6419 & 0.261144 \tabularnewline
11 & -0.062817 & -0.6498 & 0.258612 \tabularnewline
12 & -0.150573 & -1.5575 & 0.061148 \tabularnewline
13 & -0.083067 & -0.8593 & 0.196061 \tabularnewline
14 & 0.039304 & 0.4066 & 0.342571 \tabularnewline
15 & -0.013153 & -0.1361 & 0.446017 \tabularnewline
16 & -0.057937 & -0.5993 & 0.275116 \tabularnewline
17 & 0.023053 & 0.2385 & 0.405991 \tabularnewline
18 & 0.059249 & 0.6129 & 0.270629 \tabularnewline
19 & 0.082737 & 0.8558 & 0.197 \tabularnewline
20 & 0.003577 & 0.037 & 0.485275 \tabularnewline
21 & -0.074159 & -0.7671 & 0.222354 \tabularnewline
22 & -0.018819 & -0.1947 & 0.42301 \tabularnewline
23 & -0.07603 & -0.7865 & 0.216668 \tabularnewline
24 & -0.026594 & -0.2751 & 0.391887 \tabularnewline
25 & -0.074385 & -0.7694 & 0.221661 \tabularnewline
26 & -0.030752 & -0.3181 & 0.375513 \tabularnewline
27 & -0.024 & -0.2483 & 0.402206 \tabularnewline
28 & 0.003197 & 0.0331 & 0.486841 \tabularnewline
29 & -0.084579 & -0.8749 & 0.191795 \tabularnewline
30 & -0.068223 & -0.7057 & 0.240952 \tabularnewline
31 & 0.0132 & 0.1365 & 0.445827 \tabularnewline
32 & -0.080806 & -0.8359 & 0.202548 \tabularnewline
33 & -0.167154 & -1.7291 & 0.043341 \tabularnewline
34 & -0.027735 & -0.2869 & 0.387376 \tabularnewline
35 & 0.111986 & 1.1584 & 0.124642 \tabularnewline
36 & 0.062308 & 0.6445 & 0.260309 \tabularnewline
37 & -0.040493 & -0.4189 & 0.338079 \tabularnewline
38 & 0.073028 & 0.7554 & 0.225833 \tabularnewline
39 & 0.154988 & 1.6032 & 0.055918 \tabularnewline
40 & 0.214674 & 2.2206 & 0.014243 \tabularnewline
41 & 0.047952 & 0.496 & 0.310448 \tabularnewline
42 & 0.000192 & 0.002 & 0.499208 \tabularnewline
43 & -0.002929 & -0.0303 & 0.487942 \tabularnewline
44 & -0.067961 & -0.703 & 0.241792 \tabularnewline
45 & 0.028316 & 0.2929 & 0.38508 \tabularnewline
46 & -0.031206 & -0.3228 & 0.373738 \tabularnewline
47 & -0.120889 & -1.2505 & 0.106924 \tabularnewline
48 & -0.032627 & -0.3375 & 0.368202 \tabularnewline
\hline
\end{tabular}
%Source: https://freestatistics.org/blog/index.php?pk=77696&T=1

[TABLE]
[ROW][C]Autocorrelation Function[/C][/ROW]
[ROW][C]Time lag k[/C][C]ACF(k)[/C][C]T-STAT[/C][C]P-value[/C][/ROW]
[ROW][C]1[/C][C]0.302192[/C][C]3.1259[/C][C]0.001141[/C][/ROW]
[ROW][C]2[/C][C]-0.026827[/C][C]-0.2775[/C][C]0.390965[/C][/ROW]
[ROW][C]3[/C][C]0.001392[/C][C]0.0144[/C][C]0.494268[/C][/ROW]
[ROW][C]4[/C][C]0.086264[/C][C]0.8923[/C][C]0.187112[/C][/ROW]
[ROW][C]5[/C][C]0.057512[/C][C]0.5949[/C][C]0.276579[/C][/ROW]
[ROW][C]6[/C][C]-0.12544[/C][C]-1.2976[/C][C]0.098614[/C][/ROW]
[ROW][C]7[/C][C]-0.253243[/C][C]-2.6196[/C][C]0.005041[/C][/ROW]
[ROW][C]8[/C][C]-0.054297[/C][C]-0.5617[/C][C]0.287763[/C][/ROW]
[ROW][C]9[/C][C]0.002788[/C][C]0.0288[/C][C]0.488524[/C][/ROW]
[ROW][C]10[/C][C]-0.062058[/C][C]-0.6419[/C][C]0.261144[/C][/ROW]
[ROW][C]11[/C][C]-0.062817[/C][C]-0.6498[/C][C]0.258612[/C][/ROW]
[ROW][C]12[/C][C]-0.150573[/C][C]-1.5575[/C][C]0.061148[/C][/ROW]
[ROW][C]13[/C][C]-0.083067[/C][C]-0.8593[/C][C]0.196061[/C][/ROW]
[ROW][C]14[/C][C]0.039304[/C][C]0.4066[/C][C]0.342571[/C][/ROW]
[ROW][C]15[/C][C]-0.013153[/C][C]-0.1361[/C][C]0.446017[/C][/ROW]
[ROW][C]16[/C][C]-0.057937[/C][C]-0.5993[/C][C]0.275116[/C][/ROW]
[ROW][C]17[/C][C]0.023053[/C][C]0.2385[/C][C]0.405991[/C][/ROW]
[ROW][C]18[/C][C]0.059249[/C][C]0.6129[/C][C]0.270629[/C][/ROW]
[ROW][C]19[/C][C]0.082737[/C][C]0.8558[/C][C]0.197[/C][/ROW]
[ROW][C]20[/C][C]0.003577[/C][C]0.037[/C][C]0.485275[/C][/ROW]
[ROW][C]21[/C][C]-0.074159[/C][C]-0.7671[/C][C]0.222354[/C][/ROW]
[ROW][C]22[/C][C]-0.018819[/C][C]-0.1947[/C][C]0.42301[/C][/ROW]
[ROW][C]23[/C][C]-0.07603[/C][C]-0.7865[/C][C]0.216668[/C][/ROW]
[ROW][C]24[/C][C]-0.026594[/C][C]-0.2751[/C][C]0.391887[/C][/ROW]
[ROW][C]25[/C][C]-0.074385[/C][C]-0.7694[/C][C]0.221661[/C][/ROW]
[ROW][C]26[/C][C]-0.030752[/C][C]-0.3181[/C][C]0.375513[/C][/ROW]
[ROW][C]27[/C][C]-0.024[/C][C]-0.2483[/C][C]0.402206[/C][/ROW]
[ROW][C]28[/C][C]0.003197[/C][C]0.0331[/C][C]0.486841[/C][/ROW]
[ROW][C]29[/C][C]-0.084579[/C][C]-0.8749[/C][C]0.191795[/C][/ROW]
[ROW][C]30[/C][C]-0.068223[/C][C]-0.7057[/C][C]0.240952[/C][/ROW]
[ROW][C]31[/C][C]0.0132[/C][C]0.1365[/C][C]0.445827[/C][/ROW]
[ROW][C]32[/C][C]-0.080806[/C][C]-0.8359[/C][C]0.202548[/C][/ROW]
[ROW][C]33[/C][C]-0.167154[/C][C]-1.7291[/C][C]0.043341[/C][/ROW]
[ROW][C]34[/C][C]-0.027735[/C][C]-0.2869[/C][C]0.387376[/C][/ROW]
[ROW][C]35[/C][C]0.111986[/C][C]1.1584[/C][C]0.124642[/C][/ROW]
[ROW][C]36[/C][C]0.062308[/C][C]0.6445[/C][C]0.260309[/C][/ROW]
[ROW][C]37[/C][C]-0.040493[/C][C]-0.4189[/C][C]0.338079[/C][/ROW]
[ROW][C]38[/C][C]0.073028[/C][C]0.7554[/C][C]0.225833[/C][/ROW]
[ROW][C]39[/C][C]0.154988[/C][C]1.6032[/C][C]0.055918[/C][/ROW]
[ROW][C]40[/C][C]0.214674[/C][C]2.2206[/C][C]0.014243[/C][/ROW]
[ROW][C]41[/C][C]0.047952[/C][C]0.496[/C][C]0.310448[/C][/ROW]
[ROW][C]42[/C][C]0.000192[/C][C]0.002[/C][C]0.499208[/C][/ROW]
[ROW][C]43[/C][C]-0.002929[/C][C]-0.0303[/C][C]0.487942[/C][/ROW]
[ROW][C]44[/C][C]-0.067961[/C][C]-0.703[/C][C]0.241792[/C][/ROW]
[ROW][C]45[/C][C]0.028316[/C][C]0.2929[/C][C]0.38508[/C][/ROW]
[ROW][C]46[/C][C]-0.031206[/C][C]-0.3228[/C][C]0.373738[/C][/ROW]
[ROW][C]47[/C][C]-0.120889[/C][C]-1.2505[/C][C]0.106924[/C][/ROW]
[ROW][C]48[/C][C]-0.032627[/C][C]-0.3375[/C][C]0.368202[/C][/ROW]
[/TABLE]
Source: https://freestatistics.org/blog/index.php?pk=77696&T=1

Globally Unique Identifier (entire table): ba.freestatistics.org/blog/index.php?pk=77696&T=1

As an alternative you can also use a QR Code:  

The GUIDs for individual cells are displayed in the table below:

Autocorrelation Function
Time lag kACF(k)T-STATP-value
10.3021923.12590.001141
2-0.026827-0.27750.390965
30.0013920.01440.494268
40.0862640.89230.187112
50.0575120.59490.276579
6-0.12544-1.29760.098614
7-0.253243-2.61960.005041
8-0.054297-0.56170.287763
90.0027880.02880.488524
10-0.062058-0.64190.261144
11-0.062817-0.64980.258612
12-0.150573-1.55750.061148
13-0.083067-0.85930.196061
140.0393040.40660.342571
15-0.013153-0.13610.446017
16-0.057937-0.59930.275116
170.0230530.23850.405991
180.0592490.61290.270629
190.0827370.85580.197
200.0035770.0370.485275
21-0.074159-0.76710.222354
22-0.018819-0.19470.42301
23-0.07603-0.78650.216668
24-0.026594-0.27510.391887
25-0.074385-0.76940.221661
26-0.030752-0.31810.375513
27-0.024-0.24830.402206
280.0031970.03310.486841
29-0.084579-0.87490.191795
30-0.068223-0.70570.240952
310.01320.13650.445827
32-0.080806-0.83590.202548
33-0.167154-1.72910.043341
34-0.027735-0.28690.387376
350.1119861.15840.124642
360.0623080.64450.260309
37-0.040493-0.41890.338079
380.0730280.75540.225833
390.1549881.60320.055918
400.2146742.22060.014243
410.0479520.4960.310448
420.0001920.0020.499208
43-0.002929-0.03030.487942
44-0.067961-0.7030.241792
450.0283160.29290.38508
46-0.031206-0.32280.373738
47-0.120889-1.25050.106924
48-0.032627-0.33750.368202


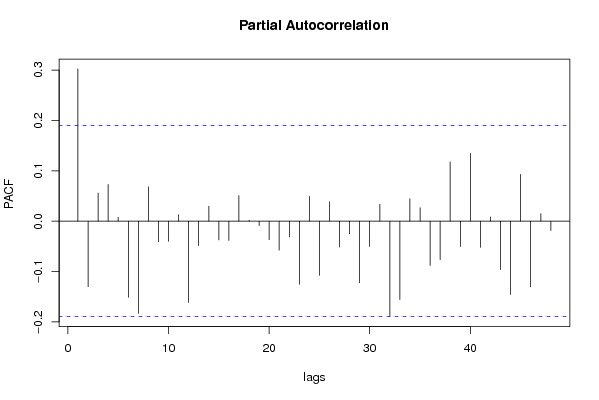
Partial Autocorrelation Function
Time lag kPACF(k)T-STATP-value
10.3021923.12590.001141
2-0.130021-1.34490.090743
30.0557970.57720.282518
40.0728970.75410.226236
50.0076290.07890.468623
6-0.151005-1.5620.06062
7-0.183165-1.89470.030418
80.0681220.70470.241278
9-0.040648-0.42050.337494
10-0.040026-0.4140.33984
110.0128330.13270.447322
12-0.161253-1.6680.049118
13-0.048491-0.50160.308493
140.0295370.30550.380276
15-0.037337-0.38620.35005
16-0.038259-0.39580.346537
170.0507620.52510.300303
180.0016590.01720.49317
19-0.008784-0.09090.463886
20-0.036685-0.37950.352544
21-0.057633-0.59620.276162
22-0.031249-0.32320.37357
23-0.125265-1.29580.098924
240.0491670.50860.306045
25-0.107407-1.1110.134523
260.0384970.39820.345631
27-0.05133-0.5310.298271
28-0.025039-0.2590.398063
29-0.12202-1.26220.104813
30-0.050093-0.51820.302707
310.0334150.34560.365143
32-0.188575-1.95060.026858
33-0.155206-1.60550.055669
340.0445550.46090.322908
350.0265760.27490.391962
36-0.087854-0.90880.182757
37-0.076141-0.78760.216333
380.1176041.21650.113235
39-0.050312-0.52040.301918
400.1345251.39150.083475
41-0.05185-0.53630.296419
420.0084910.08780.465087
43-0.096049-0.99350.161344
44-0.145353-1.50350.067823
450.0927710.95960.169701
46-0.130223-1.3470.090407
470.0148660.15380.439039
48-0.018371-0.190.424821

\begin{tabular}{lllllllll}
\hline
Partial Autocorrelation Function \tabularnewline
Time lag k & PACF(k) & T-STAT & P-value \tabularnewline
1 & 0.302192 & 3.1259 & 0.001141 \tabularnewline
2 & -0.130021 & -1.3449 & 0.090743 \tabularnewline
3 & 0.055797 & 0.5772 & 0.282518 \tabularnewline
4 & 0.072897 & 0.7541 & 0.226236 \tabularnewline
5 & 0.007629 & 0.0789 & 0.468623 \tabularnewline
6 & -0.151005 & -1.562 & 0.06062 \tabularnewline
7 & -0.183165 & -1.8947 & 0.030418 \tabularnewline
8 & 0.068122 & 0.7047 & 0.241278 \tabularnewline
9 & -0.040648 & -0.4205 & 0.337494 \tabularnewline
10 & -0.040026 & -0.414 & 0.33984 \tabularnewline
11 & 0.012833 & 0.1327 & 0.447322 \tabularnewline
12 & -0.161253 & -1.668 & 0.049118 \tabularnewline
13 & -0.048491 & -0.5016 & 0.308493 \tabularnewline
14 & 0.029537 & 0.3055 & 0.380276 \tabularnewline
15 & -0.037337 & -0.3862 & 0.35005 \tabularnewline
16 & -0.038259 & -0.3958 & 0.346537 \tabularnewline
17 & 0.050762 & 0.5251 & 0.300303 \tabularnewline
18 & 0.001659 & 0.0172 & 0.49317 \tabularnewline
19 & -0.008784 & -0.0909 & 0.463886 \tabularnewline
20 & -0.036685 & -0.3795 & 0.352544 \tabularnewline
21 & -0.057633 & -0.5962 & 0.276162 \tabularnewline
22 & -0.031249 & -0.3232 & 0.37357 \tabularnewline
23 & -0.125265 & -1.2958 & 0.098924 \tabularnewline
24 & 0.049167 & 0.5086 & 0.306045 \tabularnewline
25 & -0.107407 & -1.111 & 0.134523 \tabularnewline
26 & 0.038497 & 0.3982 & 0.345631 \tabularnewline
27 & -0.05133 & -0.531 & 0.298271 \tabularnewline
28 & -0.025039 & -0.259 & 0.398063 \tabularnewline
29 & -0.12202 & -1.2622 & 0.104813 \tabularnewline
30 & -0.050093 & -0.5182 & 0.302707 \tabularnewline
31 & 0.033415 & 0.3456 & 0.365143 \tabularnewline
32 & -0.188575 & -1.9506 & 0.026858 \tabularnewline
33 & -0.155206 & -1.6055 & 0.055669 \tabularnewline
34 & 0.044555 & 0.4609 & 0.322908 \tabularnewline
35 & 0.026576 & 0.2749 & 0.391962 \tabularnewline
36 & -0.087854 & -0.9088 & 0.182757 \tabularnewline
37 & -0.076141 & -0.7876 & 0.216333 \tabularnewline
38 & 0.117604 & 1.2165 & 0.113235 \tabularnewline
39 & -0.050312 & -0.5204 & 0.301918 \tabularnewline
40 & 0.134525 & 1.3915 & 0.083475 \tabularnewline
41 & -0.05185 & -0.5363 & 0.296419 \tabularnewline
42 & 0.008491 & 0.0878 & 0.465087 \tabularnewline
43 & -0.096049 & -0.9935 & 0.161344 \tabularnewline
44 & -0.145353 & -1.5035 & 0.067823 \tabularnewline
45 & 0.092771 & 0.9596 & 0.169701 \tabularnewline
46 & -0.130223 & -1.347 & 0.090407 \tabularnewline
47 & 0.014866 & 0.1538 & 0.439039 \tabularnewline
48 & -0.018371 & -0.19 & 0.424821 \tabularnewline
\hline
\end{tabular}
%Source: https://freestatistics.org/blog/index.php?pk=77696&T=2

[TABLE]
[ROW][C]Partial Autocorrelation Function[/C][/ROW]
[ROW][C]Time lag k[/C][C]PACF(k)[/C][C]T-STAT[/C][C]P-value[/C][/ROW]
[ROW][C]1[/C][C]0.302192[/C][C]3.1259[/C][C]0.001141[/C][/ROW]
[ROW][C]2[/C][C]-0.130021[/C][C]-1.3449[/C][C]0.090743[/C][/ROW]
[ROW][C]3[/C][C]0.055797[/C][C]0.5772[/C][C]0.282518[/C][/ROW]
[ROW][C]4[/C][C]0.072897[/C][C]0.7541[/C][C]0.226236[/C][/ROW]
[ROW][C]5[/C][C]0.007629[/C][C]0.0789[/C][C]0.468623[/C][/ROW]
[ROW][C]6[/C][C]-0.151005[/C][C]-1.562[/C][C]0.06062[/C][/ROW]
[ROW][C]7[/C][C]-0.183165[/C][C]-1.8947[/C][C]0.030418[/C][/ROW]
[ROW][C]8[/C][C]0.068122[/C][C]0.7047[/C][C]0.241278[/C][/ROW]
[ROW][C]9[/C][C]-0.040648[/C][C]-0.4205[/C][C]0.337494[/C][/ROW]
[ROW][C]10[/C][C]-0.040026[/C][C]-0.414[/C][C]0.33984[/C][/ROW]
[ROW][C]11[/C][C]0.012833[/C][C]0.1327[/C][C]0.447322[/C][/ROW]
[ROW][C]12[/C][C]-0.161253[/C][C]-1.668[/C][C]0.049118[/C][/ROW]
[ROW][C]13[/C][C]-0.048491[/C][C]-0.5016[/C][C]0.308493[/C][/ROW]
[ROW][C]14[/C][C]0.029537[/C][C]0.3055[/C][C]0.380276[/C][/ROW]
[ROW][C]15[/C][C]-0.037337[/C][C]-0.3862[/C][C]0.35005[/C][/ROW]
[ROW][C]16[/C][C]-0.038259[/C][C]-0.3958[/C][C]0.346537[/C][/ROW]
[ROW][C]17[/C][C]0.050762[/C][C]0.5251[/C][C]0.300303[/C][/ROW]
[ROW][C]18[/C][C]0.001659[/C][C]0.0172[/C][C]0.49317[/C][/ROW]
[ROW][C]19[/C][C]-0.008784[/C][C]-0.0909[/C][C]0.463886[/C][/ROW]
[ROW][C]20[/C][C]-0.036685[/C][C]-0.3795[/C][C]0.352544[/C][/ROW]
[ROW][C]21[/C][C]-0.057633[/C][C]-0.5962[/C][C]0.276162[/C][/ROW]
[ROW][C]22[/C][C]-0.031249[/C][C]-0.3232[/C][C]0.37357[/C][/ROW]
[ROW][C]23[/C][C]-0.125265[/C][C]-1.2958[/C][C]0.098924[/C][/ROW]
[ROW][C]24[/C][C]0.049167[/C][C]0.5086[/C][C]0.306045[/C][/ROW]
[ROW][C]25[/C][C]-0.107407[/C][C]-1.111[/C][C]0.134523[/C][/ROW]
[ROW][C]26[/C][C]0.038497[/C][C]0.3982[/C][C]0.345631[/C][/ROW]
[ROW][C]27[/C][C]-0.05133[/C][C]-0.531[/C][C]0.298271[/C][/ROW]
[ROW][C]28[/C][C]-0.025039[/C][C]-0.259[/C][C]0.398063[/C][/ROW]
[ROW][C]29[/C][C]-0.12202[/C][C]-1.2622[/C][C]0.104813[/C][/ROW]
[ROW][C]30[/C][C]-0.050093[/C][C]-0.5182[/C][C]0.302707[/C][/ROW]
[ROW][C]31[/C][C]0.033415[/C][C]0.3456[/C][C]0.365143[/C][/ROW]
[ROW][C]32[/C][C]-0.188575[/C][C]-1.9506[/C][C]0.026858[/C][/ROW]
[ROW][C]33[/C][C]-0.155206[/C][C]-1.6055[/C][C]0.055669[/C][/ROW]
[ROW][C]34[/C][C]0.044555[/C][C]0.4609[/C][C]0.322908[/C][/ROW]
[ROW][C]35[/C][C]0.026576[/C][C]0.2749[/C][C]0.391962[/C][/ROW]
[ROW][C]36[/C][C]-0.087854[/C][C]-0.9088[/C][C]0.182757[/C][/ROW]
[ROW][C]37[/C][C]-0.076141[/C][C]-0.7876[/C][C]0.216333[/C][/ROW]
[ROW][C]38[/C][C]0.117604[/C][C]1.2165[/C][C]0.113235[/C][/ROW]
[ROW][C]39[/C][C]-0.050312[/C][C]-0.5204[/C][C]0.301918[/C][/ROW]
[ROW][C]40[/C][C]0.134525[/C][C]1.3915[/C][C]0.083475[/C][/ROW]
[ROW][C]41[/C][C]-0.05185[/C][C]-0.5363[/C][C]0.296419[/C][/ROW]
[ROW][C]42[/C][C]0.008491[/C][C]0.0878[/C][C]0.465087[/C][/ROW]
[ROW][C]43[/C][C]-0.096049[/C][C]-0.9935[/C][C]0.161344[/C][/ROW]
[ROW][C]44[/C][C]-0.145353[/C][C]-1.5035[/C][C]0.067823[/C][/ROW]
[ROW][C]45[/C][C]0.092771[/C][C]0.9596[/C][C]0.169701[/C][/ROW]
[ROW][C]46[/C][C]-0.130223[/C][C]-1.347[/C][C]0.090407[/C][/ROW]
[ROW][C]47[/C][C]0.014866[/C][C]0.1538[/C][C]0.439039[/C][/ROW]
[ROW][C]48[/C][C]-0.018371[/C][C]-0.19[/C][C]0.424821[/C][/ROW]
[/TABLE]
Source: https://freestatistics.org/blog/index.php?pk=77696&T=2

Globally Unique Identifier (entire table): ba.freestatistics.org/blog/index.php?pk=77696&T=2

As an alternative you can also use a QR Code:  

The GUIDs for individual cells are displayed in the table below:

Partial Autocorrelation Function
Time lag kPACF(k)T-STATP-value
10.3021923.12590.001141
2-0.130021-1.34490.090743
30.0557970.57720.282518
40.0728970.75410.226236
50.0076290.07890.468623
6-0.151005-1.5620.06062
7-0.183165-1.89470.030418
80.0681220.70470.241278
9-0.040648-0.42050.337494
10-0.040026-0.4140.33984
110.0128330.13270.447322
12-0.161253-1.6680.049118
13-0.048491-0.50160.308493
140.0295370.30550.380276
15-0.037337-0.38620.35005
16-0.038259-0.39580.346537
170.0507620.52510.300303
180.0016590.01720.49317
19-0.008784-0.09090.463886
20-0.036685-0.37950.352544
21-0.057633-0.59620.276162
22-0.031249-0.32320.37357
23-0.125265-1.29580.098924
240.0491670.50860.306045
25-0.107407-1.1110.134523
260.0384970.39820.345631
27-0.05133-0.5310.298271
28-0.025039-0.2590.398063
29-0.12202-1.26220.104813
30-0.050093-0.51820.302707
310.0334150.34560.365143
32-0.188575-1.95060.026858
33-0.155206-1.60550.055669
340.0445550.46090.322908
350.0265760.27490.391962
36-0.087854-0.90880.182757
37-0.076141-0.78760.216333
380.1176041.21650.113235
39-0.050312-0.52040.301918
400.1345251.39150.083475
41-0.05185-0.53630.296419
420.0084910.08780.465087
43-0.096049-0.99350.161344
44-0.145353-1.50350.067823
450.0927710.95960.169701
46-0.130223-1.3470.090407
470.0148660.15380.439039
48-0.018371-0.190.424821


Parameters (Session):
par1 = 48 ; par2 = 1 ; par3 = 1 ; par4 = 0 ; par5 = 12 ; par6 = White Noise ; par7 = 0.95 ;
Parameters (R input):
par1 = 48 ; par2 = 1 ; par3 = 1 ; par4 = 0 ; par5 = 12 ; par6 = White Noise ; par7 = 0.95 ;
R code (references can be found in the software module):
if (par1 == 'Default') {
par1 = 10*log10(length(x))
} else {
par1 <- as.numeric(par1)
}
par2 <- as.numeric(par2)
par3 <- as.numeric(par3)
par4 <- as.numeric(par4)
par5 <- as.numeric(par5)
if (par6 == 'White Noise') par6 <- 'white' else par6 <- 'ma'
par7 <- as.numeric(par7)
if (par2 == 0) {
x <- log(x)
} else {
x <- (x ^ par2 - 1) / par2
}
if (par3 > 0) x <- diff(x,lag=1,difference=par3)
if (par4 > 0) x <- diff(x,lag=par5,difference=par4)
bitmap(file='pic1.png')
racf <- acf(x, par1, main='Autocorrelation', xlab='time lag', ylab='ACF', ci.type=par6, ci=par7, sub=paste('(lambda=',par2,', d=',par3,', D=',par4,', CI=', par7, ', CI type=',par6,')',sep=''))
dev.off()
bitmap(file='pic2.png')
rpacf <- pacf(x,par1,main='Partial Autocorrelation',xlab='lags',ylab='PACF')
dev.off()
(myacf <- c(racf$acf))
(mypacf <- c(rpacf$acf))
lengthx <- length(x)
sqrtn <- sqrt(lengthx)
load(file='createtable')
a<-table.start()
a<-table.row.start(a)
a<-table.element(a,'Autocorrelation Function',4,TRUE)
a<-table.row.end(a)
a<-table.row.start(a)
a<-table.element(a,'Time lag k',header=TRUE)
a<-table.element(a,hyperlink('basics.htm','ACF(k)','click here for more information about the Autocorrelation Function'),header=TRUE)
a<-table.element(a,'T-STAT',header=TRUE)
a<-table.element(a,'P-value',header=TRUE)
a<-table.row.end(a)
for (i in 2:(par1+1)) {
a<-table.row.start(a)
a<-table.element(a,i-1,header=TRUE)
a<-table.element(a,round(myacf[i],6))
mytstat <- myacf[i]*sqrtn
a<-table.element(a,round(mytstat,4))
a<-table.element(a,round(1-pt(abs(mytstat),lengthx),6))
a<-table.row.end(a)
}
a<-table.end(a)
table.save(a,file='mytable.tab')
a<-table.start()
a<-table.row.start(a)
a<-table.element(a,'Partial Autocorrelation Function',4,TRUE)
a<-table.row.end(a)
a<-table.row.start(a)
a<-table.element(a,'Time lag k',header=TRUE)
a<-table.element(a,hyperlink('basics.htm','PACF(k)','click here for more information about the Partial Autocorrelation Function'),header=TRUE)
a<-table.element(a,'T-STAT',header=TRUE)
a<-table.element(a,'P-value',header=TRUE)
a<-table.row.end(a)
for (i in 1:par1) {
a<-table.row.start(a)
a<-table.element(a,i,header=TRUE)
a<-table.element(a,round(mypacf[i],6))
mytstat <- mypacf[i]*sqrtn
a<-table.element(a,round(mytstat,4))
a<-table.element(a,round(1-pt(abs(mytstat),lengthx),6))
a<-table.row.end(a)
}
a<-table.end(a)
table.save(a,file='mytable1.tab')