Free Statistics

of Irreproducible Research!

Author's title

Author*Unverified author*
R Software Modulerwasp_autocorrelation.wasp
Title produced by software(Partial) Autocorrelation Function
Date of computationWed, 05 May 2010 14:39:53 +0000
Cite this page as followsStatistical Computations at FreeStatistics.org, Office for Research Development and Education, URL https://freestatistics.org/blog/index.php?v=date/2010/May/05/t12730704409ccc9jgxiylfkri.htm/, Retrieved Sat, 27 Apr 2024 13:28:56 +0000
Statistical Computations at FreeStatistics.org, Office for Research Development and Education, URL https://freestatistics.org/blog/index.php?pk=75527, Retrieved Sat, 27 Apr 2024 13:28:56 +0000
QR Codes:

Original text written by user:
IsPrivate?No (this computation is public)
User-defined keywordsKDGP2W21
Estimated Impact182
Family? (F = Feedback message, R = changed R code, M = changed R Module, P = changed Parameters, D = changed Data)
-       [(Partial) Autocorrelation Function] [Wisselkoersen] [2010-05-05 14:39:53] [518b58fa2b091d980a743b3df0de830f] [Current]
Feedback Forum

Post a new message
Dataseries X:
1.4272
1.4614
1.4914
1.4816
1.4562
1.4268
1.4088
1.4016
1.365
1.319
1.305
1.2785
1.3239
1.3449
1.2732
1.3322
1.4369
1.4975
1.577
1.5553
1.5557
1.575
1.5527
1.4748
1.4718
1.457
1.4684
1.4227
1.3896
1.3622
1.3716
1.3419
1.3511
1.3516
1.3242
1.3074
1.2999
1.3213
1.2881
1.2611
1.2727
1.2811
1.2684
1.265
1.277
1.2271
1.202
1.1938
1.2103
1.1856
1.1786
1.2015
1.2256
1.2292
1.2037
1.2165
1.2694
1.2938
1.3201
1.3014
1.3119
1.3408
1.2991
1.249
1.2218
1.2176
1.2266
1.2138
1.2007
1.1985
1.2262
1.2646


Summary of computational transaction
Raw Inputview raw input (R code)
Raw Outputview raw output of R engine
Computing time1 seconds
R Server'Gwilym Jenkins' @ 72.249.127.135

\begin{tabular}{lllllllll}
\hline
Summary of computational transaction \tabularnewline
Raw Input & view raw input (R code)  \tabularnewline
Raw Output & view raw output of R engine  \tabularnewline
Computing time & 1 seconds \tabularnewline
R Server & 'Gwilym Jenkins' @ 72.249.127.135 \tabularnewline
\hline
\end{tabular}
%Source: https://freestatistics.org/blog/index.php?pk=75527&T=0

[TABLE]
[ROW][C]Summary of computational transaction[/C][/ROW]
[ROW][C]Raw Input[/C][C]view raw input (R code) [/C][/ROW]
[ROW][C]Raw Output[/C][C]view raw output of R engine [/C][/ROW]
[ROW][C]Computing time[/C][C]1 seconds[/C][/ROW]
[ROW][C]R Server[/C][C]'Gwilym Jenkins' @ 72.249.127.135[/C][/ROW]
[/TABLE]
Source: https://freestatistics.org/blog/index.php?pk=75527&T=0

Globally Unique Identifier (entire table): ba.freestatistics.org/blog/index.php?pk=75527&T=0

As an alternative you can also use a QR Code:  

The GUIDs for individual cells are displayed in the table below:

Summary of computational transaction
Raw Inputview raw input (R code)
Raw Outputview raw output of R engine
Computing time1 seconds
R Server'Gwilym Jenkins' @ 72.249.127.135


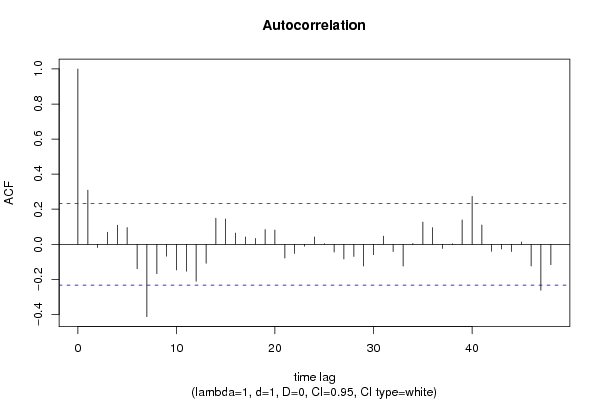
Autocorrelation Function
Time lag kACF(k)T-STATP-value
10.3084482.5990.005681
2-0.018559-0.15640.43809
30.0687770.57950.282036
40.1091990.92010.18031
50.0956720.80610.211425
6-0.139045-1.17160.122634
7-0.412794-3.47830.000433
8-0.167549-1.41180.081189
9-0.068098-0.57380.283958
10-0.146405-1.23360.110705
11-0.153287-1.29160.100339
12-0.211192-1.77950.039716
13-0.10883-0.9170.18112
140.1487571.25340.107078
150.1442951.21590.114034
160.0640590.53980.295521
170.0418450.35260.362721
180.0333540.2810.389745
190.0836780.70510.241533
200.0812690.68480.247854
21-0.078698-0.66310.254701
22-0.052419-0.44170.330027
23-0.010628-0.08960.464447
240.041770.3520.362955
250.0032810.02760.489011
26-0.044252-0.37290.355175
27-0.08381-0.70620.24119
28-0.069128-0.58250.281044
29-0.124013-1.04490.149796
30-0.059489-0.50130.308867
310.0465040.39190.34817
32-0.041666-0.35110.363282
33-0.124517-1.04920.148822
340.0046310.0390.484493
350.1266591.06720.144738
360.0943290.79480.21468
37-0.023975-0.2020.420242
380.0024350.02050.491845
390.1389631.17090.122773
400.2727272.2980.012254
410.1101130.92780.178319
42-0.040368-0.34010.367374
43-0.026243-0.22110.412813
44-0.041558-0.35020.363624
450.013140.11070.456076
46-0.123232-1.03840.15131
47-0.262232-2.20960.015179
48-0.116723-0.98350.164345

\begin{tabular}{lllllllll}
\hline
Autocorrelation Function \tabularnewline
Time lag k & ACF(k) & T-STAT & P-value \tabularnewline
1 & 0.308448 & 2.599 & 0.005681 \tabularnewline
2 & -0.018559 & -0.1564 & 0.43809 \tabularnewline
3 & 0.068777 & 0.5795 & 0.282036 \tabularnewline
4 & 0.109199 & 0.9201 & 0.18031 \tabularnewline
5 & 0.095672 & 0.8061 & 0.211425 \tabularnewline
6 & -0.139045 & -1.1716 & 0.122634 \tabularnewline
7 & -0.412794 & -3.4783 & 0.000433 \tabularnewline
8 & -0.167549 & -1.4118 & 0.081189 \tabularnewline
9 & -0.068098 & -0.5738 & 0.283958 \tabularnewline
10 & -0.146405 & -1.2336 & 0.110705 \tabularnewline
11 & -0.153287 & -1.2916 & 0.100339 \tabularnewline
12 & -0.211192 & -1.7795 & 0.039716 \tabularnewline
13 & -0.10883 & -0.917 & 0.18112 \tabularnewline
14 & 0.148757 & 1.2534 & 0.107078 \tabularnewline
15 & 0.144295 & 1.2159 & 0.114034 \tabularnewline
16 & 0.064059 & 0.5398 & 0.295521 \tabularnewline
17 & 0.041845 & 0.3526 & 0.362721 \tabularnewline
18 & 0.033354 & 0.281 & 0.389745 \tabularnewline
19 & 0.083678 & 0.7051 & 0.241533 \tabularnewline
20 & 0.081269 & 0.6848 & 0.247854 \tabularnewline
21 & -0.078698 & -0.6631 & 0.254701 \tabularnewline
22 & -0.052419 & -0.4417 & 0.330027 \tabularnewline
23 & -0.010628 & -0.0896 & 0.464447 \tabularnewline
24 & 0.04177 & 0.352 & 0.362955 \tabularnewline
25 & 0.003281 & 0.0276 & 0.489011 \tabularnewline
26 & -0.044252 & -0.3729 & 0.355175 \tabularnewline
27 & -0.08381 & -0.7062 & 0.24119 \tabularnewline
28 & -0.069128 & -0.5825 & 0.281044 \tabularnewline
29 & -0.124013 & -1.0449 & 0.149796 \tabularnewline
30 & -0.059489 & -0.5013 & 0.308867 \tabularnewline
31 & 0.046504 & 0.3919 & 0.34817 \tabularnewline
32 & -0.041666 & -0.3511 & 0.363282 \tabularnewline
33 & -0.124517 & -1.0492 & 0.148822 \tabularnewline
34 & 0.004631 & 0.039 & 0.484493 \tabularnewline
35 & 0.126659 & 1.0672 & 0.144738 \tabularnewline
36 & 0.094329 & 0.7948 & 0.21468 \tabularnewline
37 & -0.023975 & -0.202 & 0.420242 \tabularnewline
38 & 0.002435 & 0.0205 & 0.491845 \tabularnewline
39 & 0.138963 & 1.1709 & 0.122773 \tabularnewline
40 & 0.272727 & 2.298 & 0.012254 \tabularnewline
41 & 0.110113 & 0.9278 & 0.178319 \tabularnewline
42 & -0.040368 & -0.3401 & 0.367374 \tabularnewline
43 & -0.026243 & -0.2211 & 0.412813 \tabularnewline
44 & -0.041558 & -0.3502 & 0.363624 \tabularnewline
45 & 0.01314 & 0.1107 & 0.456076 \tabularnewline
46 & -0.123232 & -1.0384 & 0.15131 \tabularnewline
47 & -0.262232 & -2.2096 & 0.015179 \tabularnewline
48 & -0.116723 & -0.9835 & 0.164345 \tabularnewline
\hline
\end{tabular}
%Source: https://freestatistics.org/blog/index.php?pk=75527&T=1

[TABLE]
[ROW][C]Autocorrelation Function[/C][/ROW]
[ROW][C]Time lag k[/C][C]ACF(k)[/C][C]T-STAT[/C][C]P-value[/C][/ROW]
[ROW][C]1[/C][C]0.308448[/C][C]2.599[/C][C]0.005681[/C][/ROW]
[ROW][C]2[/C][C]-0.018559[/C][C]-0.1564[/C][C]0.43809[/C][/ROW]
[ROW][C]3[/C][C]0.068777[/C][C]0.5795[/C][C]0.282036[/C][/ROW]
[ROW][C]4[/C][C]0.109199[/C][C]0.9201[/C][C]0.18031[/C][/ROW]
[ROW][C]5[/C][C]0.095672[/C][C]0.8061[/C][C]0.211425[/C][/ROW]
[ROW][C]6[/C][C]-0.139045[/C][C]-1.1716[/C][C]0.122634[/C][/ROW]
[ROW][C]7[/C][C]-0.412794[/C][C]-3.4783[/C][C]0.000433[/C][/ROW]
[ROW][C]8[/C][C]-0.167549[/C][C]-1.4118[/C][C]0.081189[/C][/ROW]
[ROW][C]9[/C][C]-0.068098[/C][C]-0.5738[/C][C]0.283958[/C][/ROW]
[ROW][C]10[/C][C]-0.146405[/C][C]-1.2336[/C][C]0.110705[/C][/ROW]
[ROW][C]11[/C][C]-0.153287[/C][C]-1.2916[/C][C]0.100339[/C][/ROW]
[ROW][C]12[/C][C]-0.211192[/C][C]-1.7795[/C][C]0.039716[/C][/ROW]
[ROW][C]13[/C][C]-0.10883[/C][C]-0.917[/C][C]0.18112[/C][/ROW]
[ROW][C]14[/C][C]0.148757[/C][C]1.2534[/C][C]0.107078[/C][/ROW]
[ROW][C]15[/C][C]0.144295[/C][C]1.2159[/C][C]0.114034[/C][/ROW]
[ROW][C]16[/C][C]0.064059[/C][C]0.5398[/C][C]0.295521[/C][/ROW]
[ROW][C]17[/C][C]0.041845[/C][C]0.3526[/C][C]0.362721[/C][/ROW]
[ROW][C]18[/C][C]0.033354[/C][C]0.281[/C][C]0.389745[/C][/ROW]
[ROW][C]19[/C][C]0.083678[/C][C]0.7051[/C][C]0.241533[/C][/ROW]
[ROW][C]20[/C][C]0.081269[/C][C]0.6848[/C][C]0.247854[/C][/ROW]
[ROW][C]21[/C][C]-0.078698[/C][C]-0.6631[/C][C]0.254701[/C][/ROW]
[ROW][C]22[/C][C]-0.052419[/C][C]-0.4417[/C][C]0.330027[/C][/ROW]
[ROW][C]23[/C][C]-0.010628[/C][C]-0.0896[/C][C]0.464447[/C][/ROW]
[ROW][C]24[/C][C]0.04177[/C][C]0.352[/C][C]0.362955[/C][/ROW]
[ROW][C]25[/C][C]0.003281[/C][C]0.0276[/C][C]0.489011[/C][/ROW]
[ROW][C]26[/C][C]-0.044252[/C][C]-0.3729[/C][C]0.355175[/C][/ROW]
[ROW][C]27[/C][C]-0.08381[/C][C]-0.7062[/C][C]0.24119[/C][/ROW]
[ROW][C]28[/C][C]-0.069128[/C][C]-0.5825[/C][C]0.281044[/C][/ROW]
[ROW][C]29[/C][C]-0.124013[/C][C]-1.0449[/C][C]0.149796[/C][/ROW]
[ROW][C]30[/C][C]-0.059489[/C][C]-0.5013[/C][C]0.308867[/C][/ROW]
[ROW][C]31[/C][C]0.046504[/C][C]0.3919[/C][C]0.34817[/C][/ROW]
[ROW][C]32[/C][C]-0.041666[/C][C]-0.3511[/C][C]0.363282[/C][/ROW]
[ROW][C]33[/C][C]-0.124517[/C][C]-1.0492[/C][C]0.148822[/C][/ROW]
[ROW][C]34[/C][C]0.004631[/C][C]0.039[/C][C]0.484493[/C][/ROW]
[ROW][C]35[/C][C]0.126659[/C][C]1.0672[/C][C]0.144738[/C][/ROW]
[ROW][C]36[/C][C]0.094329[/C][C]0.7948[/C][C]0.21468[/C][/ROW]
[ROW][C]37[/C][C]-0.023975[/C][C]-0.202[/C][C]0.420242[/C][/ROW]
[ROW][C]38[/C][C]0.002435[/C][C]0.0205[/C][C]0.491845[/C][/ROW]
[ROW][C]39[/C][C]0.138963[/C][C]1.1709[/C][C]0.122773[/C][/ROW]
[ROW][C]40[/C][C]0.272727[/C][C]2.298[/C][C]0.012254[/C][/ROW]
[ROW][C]41[/C][C]0.110113[/C][C]0.9278[/C][C]0.178319[/C][/ROW]
[ROW][C]42[/C][C]-0.040368[/C][C]-0.3401[/C][C]0.367374[/C][/ROW]
[ROW][C]43[/C][C]-0.026243[/C][C]-0.2211[/C][C]0.412813[/C][/ROW]
[ROW][C]44[/C][C]-0.041558[/C][C]-0.3502[/C][C]0.363624[/C][/ROW]
[ROW][C]45[/C][C]0.01314[/C][C]0.1107[/C][C]0.456076[/C][/ROW]
[ROW][C]46[/C][C]-0.123232[/C][C]-1.0384[/C][C]0.15131[/C][/ROW]
[ROW][C]47[/C][C]-0.262232[/C][C]-2.2096[/C][C]0.015179[/C][/ROW]
[ROW][C]48[/C][C]-0.116723[/C][C]-0.9835[/C][C]0.164345[/C][/ROW]
[/TABLE]
Source: https://freestatistics.org/blog/index.php?pk=75527&T=1

Globally Unique Identifier (entire table): ba.freestatistics.org/blog/index.php?pk=75527&T=1

As an alternative you can also use a QR Code:  

The GUIDs for individual cells are displayed in the table below:

Autocorrelation Function
Time lag kACF(k)T-STATP-value
10.3084482.5990.005681
2-0.018559-0.15640.43809
30.0687770.57950.282036
40.1091990.92010.18031
50.0956720.80610.211425
6-0.139045-1.17160.122634
7-0.412794-3.47830.000433
8-0.167549-1.41180.081189
9-0.068098-0.57380.283958
10-0.146405-1.23360.110705
11-0.153287-1.29160.100339
12-0.211192-1.77950.039716
13-0.10883-0.9170.18112
140.1487571.25340.107078
150.1442951.21590.114034
160.0640590.53980.295521
170.0418450.35260.362721
180.0333540.2810.389745
190.0836780.70510.241533
200.0812690.68480.247854
21-0.078698-0.66310.254701
22-0.052419-0.44170.330027
23-0.010628-0.08960.464447
240.041770.3520.362955
250.0032810.02760.489011
26-0.044252-0.37290.355175
27-0.08381-0.70620.24119
28-0.069128-0.58250.281044
29-0.124013-1.04490.149796
30-0.059489-0.50130.308867
310.0465040.39190.34817
32-0.041666-0.35110.363282
33-0.124517-1.04920.148822
340.0046310.0390.484493
350.1266591.06720.144738
360.0943290.79480.21468
37-0.023975-0.2020.420242
380.0024350.02050.491845
390.1389631.17090.122773
400.2727272.2980.012254
410.1101130.92780.178319
42-0.040368-0.34010.367374
43-0.026243-0.22110.412813
44-0.041558-0.35020.363624
450.013140.11070.456076
46-0.123232-1.03840.15131
47-0.262232-2.20960.015179
48-0.116723-0.98350.164345


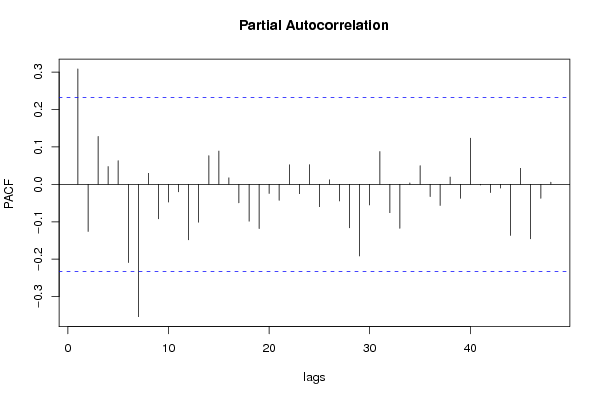
Partial Autocorrelation Function
Time lag kPACF(k)T-STATP-value
10.3084482.5990.005681
2-0.125653-1.05880.146646
30.1279821.07840.142253
40.0474680.40.345189
50.0631810.53240.298064
6-0.208867-1.75990.041362
7-0.353516-2.97880.001979
80.0296170.24960.401826
9-0.09203-0.77550.220322
10-0.047242-0.39810.345888
11-0.019925-0.16790.433573
12-0.148219-1.24890.107899
13-0.101247-0.85310.19823
140.0765010.64460.260629
150.0891840.75150.227424
160.0175880.14820.441303
17-0.049414-0.41640.339199
18-0.098536-0.83030.204582
19-0.118038-0.99460.161652
20-0.024112-0.20320.41979
21-0.042727-0.360.359948
220.052150.43940.330844
23-0.024926-0.210.417124
240.0525450.44280.329644
25-0.059806-0.50390.307935
260.0121540.10240.45936
27-0.044122-0.37180.355581
28-0.116197-0.97910.16543
29-0.191292-1.61190.055715
30-0.055074-0.46410.32201
310.087810.73990.2309
32-0.075609-0.63710.263056
33-0.117325-0.98860.163108
340.0039340.03320.486824
350.0498080.41970.33799
36-0.032643-0.27510.392036
37-0.056191-0.47350.318665
380.0194460.16390.435156
39-0.0373-0.31430.37711
400.1232961.03890.151186
41-0.001575-0.01330.494723
42-0.021871-0.18430.427158
43-0.009964-0.0840.466663
44-0.136329-1.14870.127261
450.0429370.36180.359289
46-0.145612-1.22690.111948
47-0.037174-0.31320.377509
480.0058740.04950.480332

\begin{tabular}{lllllllll}
\hline
Partial Autocorrelation Function \tabularnewline
Time lag k & PACF(k) & T-STAT & P-value \tabularnewline
1 & 0.308448 & 2.599 & 0.005681 \tabularnewline
2 & -0.125653 & -1.0588 & 0.146646 \tabularnewline
3 & 0.127982 & 1.0784 & 0.142253 \tabularnewline
4 & 0.047468 & 0.4 & 0.345189 \tabularnewline
5 & 0.063181 & 0.5324 & 0.298064 \tabularnewline
6 & -0.208867 & -1.7599 & 0.041362 \tabularnewline
7 & -0.353516 & -2.9788 & 0.001979 \tabularnewline
8 & 0.029617 & 0.2496 & 0.401826 \tabularnewline
9 & -0.09203 & -0.7755 & 0.220322 \tabularnewline
10 & -0.047242 & -0.3981 & 0.345888 \tabularnewline
11 & -0.019925 & -0.1679 & 0.433573 \tabularnewline
12 & -0.148219 & -1.2489 & 0.107899 \tabularnewline
13 & -0.101247 & -0.8531 & 0.19823 \tabularnewline
14 & 0.076501 & 0.6446 & 0.260629 \tabularnewline
15 & 0.089184 & 0.7515 & 0.227424 \tabularnewline
16 & 0.017588 & 0.1482 & 0.441303 \tabularnewline
17 & -0.049414 & -0.4164 & 0.339199 \tabularnewline
18 & -0.098536 & -0.8303 & 0.204582 \tabularnewline
19 & -0.118038 & -0.9946 & 0.161652 \tabularnewline
20 & -0.024112 & -0.2032 & 0.41979 \tabularnewline
21 & -0.042727 & -0.36 & 0.359948 \tabularnewline
22 & 0.05215 & 0.4394 & 0.330844 \tabularnewline
23 & -0.024926 & -0.21 & 0.417124 \tabularnewline
24 & 0.052545 & 0.4428 & 0.329644 \tabularnewline
25 & -0.059806 & -0.5039 & 0.307935 \tabularnewline
26 & 0.012154 & 0.1024 & 0.45936 \tabularnewline
27 & -0.044122 & -0.3718 & 0.355581 \tabularnewline
28 & -0.116197 & -0.9791 & 0.16543 \tabularnewline
29 & -0.191292 & -1.6119 & 0.055715 \tabularnewline
30 & -0.055074 & -0.4641 & 0.32201 \tabularnewline
31 & 0.08781 & 0.7399 & 0.2309 \tabularnewline
32 & -0.075609 & -0.6371 & 0.263056 \tabularnewline
33 & -0.117325 & -0.9886 & 0.163108 \tabularnewline
34 & 0.003934 & 0.0332 & 0.486824 \tabularnewline
35 & 0.049808 & 0.4197 & 0.33799 \tabularnewline
36 & -0.032643 & -0.2751 & 0.392036 \tabularnewline
37 & -0.056191 & -0.4735 & 0.318665 \tabularnewline
38 & 0.019446 & 0.1639 & 0.435156 \tabularnewline
39 & -0.0373 & -0.3143 & 0.37711 \tabularnewline
40 & 0.123296 & 1.0389 & 0.151186 \tabularnewline
41 & -0.001575 & -0.0133 & 0.494723 \tabularnewline
42 & -0.021871 & -0.1843 & 0.427158 \tabularnewline
43 & -0.009964 & -0.084 & 0.466663 \tabularnewline
44 & -0.136329 & -1.1487 & 0.127261 \tabularnewline
45 & 0.042937 & 0.3618 & 0.359289 \tabularnewline
46 & -0.145612 & -1.2269 & 0.111948 \tabularnewline
47 & -0.037174 & -0.3132 & 0.377509 \tabularnewline
48 & 0.005874 & 0.0495 & 0.480332 \tabularnewline
\hline
\end{tabular}
%Source: https://freestatistics.org/blog/index.php?pk=75527&T=2

[TABLE]
[ROW][C]Partial Autocorrelation Function[/C][/ROW]
[ROW][C]Time lag k[/C][C]PACF(k)[/C][C]T-STAT[/C][C]P-value[/C][/ROW]
[ROW][C]1[/C][C]0.308448[/C][C]2.599[/C][C]0.005681[/C][/ROW]
[ROW][C]2[/C][C]-0.125653[/C][C]-1.0588[/C][C]0.146646[/C][/ROW]
[ROW][C]3[/C][C]0.127982[/C][C]1.0784[/C][C]0.142253[/C][/ROW]
[ROW][C]4[/C][C]0.047468[/C][C]0.4[/C][C]0.345189[/C][/ROW]
[ROW][C]5[/C][C]0.063181[/C][C]0.5324[/C][C]0.298064[/C][/ROW]
[ROW][C]6[/C][C]-0.208867[/C][C]-1.7599[/C][C]0.041362[/C][/ROW]
[ROW][C]7[/C][C]-0.353516[/C][C]-2.9788[/C][C]0.001979[/C][/ROW]
[ROW][C]8[/C][C]0.029617[/C][C]0.2496[/C][C]0.401826[/C][/ROW]
[ROW][C]9[/C][C]-0.09203[/C][C]-0.7755[/C][C]0.220322[/C][/ROW]
[ROW][C]10[/C][C]-0.047242[/C][C]-0.3981[/C][C]0.345888[/C][/ROW]
[ROW][C]11[/C][C]-0.019925[/C][C]-0.1679[/C][C]0.433573[/C][/ROW]
[ROW][C]12[/C][C]-0.148219[/C][C]-1.2489[/C][C]0.107899[/C][/ROW]
[ROW][C]13[/C][C]-0.101247[/C][C]-0.8531[/C][C]0.19823[/C][/ROW]
[ROW][C]14[/C][C]0.076501[/C][C]0.6446[/C][C]0.260629[/C][/ROW]
[ROW][C]15[/C][C]0.089184[/C][C]0.7515[/C][C]0.227424[/C][/ROW]
[ROW][C]16[/C][C]0.017588[/C][C]0.1482[/C][C]0.441303[/C][/ROW]
[ROW][C]17[/C][C]-0.049414[/C][C]-0.4164[/C][C]0.339199[/C][/ROW]
[ROW][C]18[/C][C]-0.098536[/C][C]-0.8303[/C][C]0.204582[/C][/ROW]
[ROW][C]19[/C][C]-0.118038[/C][C]-0.9946[/C][C]0.161652[/C][/ROW]
[ROW][C]20[/C][C]-0.024112[/C][C]-0.2032[/C][C]0.41979[/C][/ROW]
[ROW][C]21[/C][C]-0.042727[/C][C]-0.36[/C][C]0.359948[/C][/ROW]
[ROW][C]22[/C][C]0.05215[/C][C]0.4394[/C][C]0.330844[/C][/ROW]
[ROW][C]23[/C][C]-0.024926[/C][C]-0.21[/C][C]0.417124[/C][/ROW]
[ROW][C]24[/C][C]0.052545[/C][C]0.4428[/C][C]0.329644[/C][/ROW]
[ROW][C]25[/C][C]-0.059806[/C][C]-0.5039[/C][C]0.307935[/C][/ROW]
[ROW][C]26[/C][C]0.012154[/C][C]0.1024[/C][C]0.45936[/C][/ROW]
[ROW][C]27[/C][C]-0.044122[/C][C]-0.3718[/C][C]0.355581[/C][/ROW]
[ROW][C]28[/C][C]-0.116197[/C][C]-0.9791[/C][C]0.16543[/C][/ROW]
[ROW][C]29[/C][C]-0.191292[/C][C]-1.6119[/C][C]0.055715[/C][/ROW]
[ROW][C]30[/C][C]-0.055074[/C][C]-0.4641[/C][C]0.32201[/C][/ROW]
[ROW][C]31[/C][C]0.08781[/C][C]0.7399[/C][C]0.2309[/C][/ROW]
[ROW][C]32[/C][C]-0.075609[/C][C]-0.6371[/C][C]0.263056[/C][/ROW]
[ROW][C]33[/C][C]-0.117325[/C][C]-0.9886[/C][C]0.163108[/C][/ROW]
[ROW][C]34[/C][C]0.003934[/C][C]0.0332[/C][C]0.486824[/C][/ROW]
[ROW][C]35[/C][C]0.049808[/C][C]0.4197[/C][C]0.33799[/C][/ROW]
[ROW][C]36[/C][C]-0.032643[/C][C]-0.2751[/C][C]0.392036[/C][/ROW]
[ROW][C]37[/C][C]-0.056191[/C][C]-0.4735[/C][C]0.318665[/C][/ROW]
[ROW][C]38[/C][C]0.019446[/C][C]0.1639[/C][C]0.435156[/C][/ROW]
[ROW][C]39[/C][C]-0.0373[/C][C]-0.3143[/C][C]0.37711[/C][/ROW]
[ROW][C]40[/C][C]0.123296[/C][C]1.0389[/C][C]0.151186[/C][/ROW]
[ROW][C]41[/C][C]-0.001575[/C][C]-0.0133[/C][C]0.494723[/C][/ROW]
[ROW][C]42[/C][C]-0.021871[/C][C]-0.1843[/C][C]0.427158[/C][/ROW]
[ROW][C]43[/C][C]-0.009964[/C][C]-0.084[/C][C]0.466663[/C][/ROW]
[ROW][C]44[/C][C]-0.136329[/C][C]-1.1487[/C][C]0.127261[/C][/ROW]
[ROW][C]45[/C][C]0.042937[/C][C]0.3618[/C][C]0.359289[/C][/ROW]
[ROW][C]46[/C][C]-0.145612[/C][C]-1.2269[/C][C]0.111948[/C][/ROW]
[ROW][C]47[/C][C]-0.037174[/C][C]-0.3132[/C][C]0.377509[/C][/ROW]
[ROW][C]48[/C][C]0.005874[/C][C]0.0495[/C][C]0.480332[/C][/ROW]
[/TABLE]
Source: https://freestatistics.org/blog/index.php?pk=75527&T=2

Globally Unique Identifier (entire table): ba.freestatistics.org/blog/index.php?pk=75527&T=2

As an alternative you can also use a QR Code:  

The GUIDs for individual cells are displayed in the table below:

Partial Autocorrelation Function
Time lag kPACF(k)T-STATP-value
10.3084482.5990.005681
2-0.125653-1.05880.146646
30.1279821.07840.142253
40.0474680.40.345189
50.0631810.53240.298064
6-0.208867-1.75990.041362
7-0.353516-2.97880.001979
80.0296170.24960.401826
9-0.09203-0.77550.220322
10-0.047242-0.39810.345888
11-0.019925-0.16790.433573
12-0.148219-1.24890.107899
13-0.101247-0.85310.19823
140.0765010.64460.260629
150.0891840.75150.227424
160.0175880.14820.441303
17-0.049414-0.41640.339199
18-0.098536-0.83030.204582
19-0.118038-0.99460.161652
20-0.024112-0.20320.41979
21-0.042727-0.360.359948
220.052150.43940.330844
23-0.024926-0.210.417124
240.0525450.44280.329644
25-0.059806-0.50390.307935
260.0121540.10240.45936
27-0.044122-0.37180.355581
28-0.116197-0.97910.16543
29-0.191292-1.61190.055715
30-0.055074-0.46410.32201
310.087810.73990.2309
32-0.075609-0.63710.263056
33-0.117325-0.98860.163108
340.0039340.03320.486824
350.0498080.41970.33799
36-0.032643-0.27510.392036
37-0.056191-0.47350.318665
380.0194460.16390.435156
39-0.0373-0.31430.37711
400.1232961.03890.151186
41-0.001575-0.01330.494723
42-0.021871-0.18430.427158
43-0.009964-0.0840.466663
44-0.136329-1.14870.127261
450.0429370.36180.359289
46-0.145612-1.22690.111948
47-0.037174-0.31320.377509
480.0058740.04950.480332


Parameters (Session):
par1 = 48 ; par2 = 1 ; par3 = 1 ; par4 = 0 ; par5 = 12 ; par6 = White Noise ; par7 = 0.95 ;
Parameters (R input):
par1 = 48 ; par2 = 1 ; par3 = 1 ; par4 = 0 ; par5 = 12 ; par6 = White Noise ; par7 = 0.95 ;
R code (references can be found in the software module):
if (par1 == 'Default') {
par1 = 10*log10(length(x))
} else {
par1 <- as.numeric(par1)
}
par2 <- as.numeric(par2)
par3 <- as.numeric(par3)
par4 <- as.numeric(par4)
par5 <- as.numeric(par5)
if (par6 == 'White Noise') par6 <- 'white' else par6 <- 'ma'
par7 <- as.numeric(par7)
if (par2 == 0) {
x <- log(x)
} else {
x <- (x ^ par2 - 1) / par2
}
if (par3 > 0) x <- diff(x,lag=1,difference=par3)
if (par4 > 0) x <- diff(x,lag=par5,difference=par4)
bitmap(file='pic1.png')
racf <- acf(x, par1, main='Autocorrelation', xlab='time lag', ylab='ACF', ci.type=par6, ci=par7, sub=paste('(lambda=',par2,', d=',par3,', D=',par4,', CI=', par7, ', CI type=',par6,')',sep=''))
dev.off()
bitmap(file='pic2.png')
rpacf <- pacf(x,par1,main='Partial Autocorrelation',xlab='lags',ylab='PACF')
dev.off()
(myacf <- c(racf$acf))
(mypacf <- c(rpacf$acf))
lengthx <- length(x)
sqrtn <- sqrt(lengthx)
load(file='createtable')
a<-table.start()
a<-table.row.start(a)
a<-table.element(a,'Autocorrelation Function',4,TRUE)
a<-table.row.end(a)
a<-table.row.start(a)
a<-table.element(a,'Time lag k',header=TRUE)
a<-table.element(a,hyperlink('basics.htm','ACF(k)','click here for more information about the Autocorrelation Function'),header=TRUE)
a<-table.element(a,'T-STAT',header=TRUE)
a<-table.element(a,'P-value',header=TRUE)
a<-table.row.end(a)
for (i in 2:(par1+1)) {
a<-table.row.start(a)
a<-table.element(a,i-1,header=TRUE)
a<-table.element(a,round(myacf[i],6))
mytstat <- myacf[i]*sqrtn
a<-table.element(a,round(mytstat,4))
a<-table.element(a,round(1-pt(abs(mytstat),lengthx),6))
a<-table.row.end(a)
}
a<-table.end(a)
table.save(a,file='mytable.tab')
a<-table.start()
a<-table.row.start(a)
a<-table.element(a,'Partial Autocorrelation Function',4,TRUE)
a<-table.row.end(a)
a<-table.row.start(a)
a<-table.element(a,'Time lag k',header=TRUE)
a<-table.element(a,hyperlink('basics.htm','PACF(k)','click here for more information about the Partial Autocorrelation Function'),header=TRUE)
a<-table.element(a,'T-STAT',header=TRUE)
a<-table.element(a,'P-value',header=TRUE)
a<-table.row.end(a)
for (i in 1:par1) {
a<-table.row.start(a)
a<-table.element(a,i,header=TRUE)
a<-table.element(a,round(mypacf[i],6))
mytstat <- mypacf[i]*sqrtn
a<-table.element(a,round(mytstat,4))
a<-table.element(a,round(1-pt(abs(mytstat),lengthx),6))
a<-table.row.end(a)
}
a<-table.end(a)
table.save(a,file='mytable1.tab')