Free Statistics

of Irreproducible Research!

Author's title

Author*Unverified author*
R Software Modulerwasp_autocorrelation.wasp
Title produced by software(Partial) Autocorrelation Function
Date of computationWed, 05 May 2010 15:19:03 +0000
Cite this page as followsStatistical Computations at FreeStatistics.org, Office for Research Development and Education, URL https://freestatistics.org/blog/index.php?v=date/2010/May/05/t1273072789xc2ez0ms22qwt88.htm/, Retrieved Sun, 28 Apr 2024 12:51:39 +0000
Statistical Computations at FreeStatistics.org, Office for Research Development and Education, URL https://freestatistics.org/blog/index.php?pk=75533, Retrieved Sun, 28 Apr 2024 12:51:39 +0000
QR Codes:

Original text written by user:
IsPrivate?No (this computation is public)
User-defined keywordsKDGP2W21
Estimated Impact163
Family? (F = Feedback message, R = changed R code, M = changed R Module, P = changed Parameters, D = changed Data)
-     [(Partial) Autocorrelation Function] [] [2010-05-05 15:06:34] [2b8250bcc85b616779369dc5805990fc]
-   P     [(Partial) Autocorrelation Function] [] [2010-05-05 15:19:03] [03859715711bd3369851d387eaa83ba4] [Current]
Feedback Forum

Post a new message
Dataseries X:
1954
2302
3054
2414
2226
2725
2589
3470
2400
3180
4009
3924
2072
2434
2956
2828
2687
2629
3150
4119
3030
3055
3821
4001
2529
2472
3134
2789
2758
2993
3282
3437
2804
3076
3782
3889
2271
2452
3084
2522
2769
3438
2839
3746
2632
2851
3871
3618
2389
2344
2678
2492
2858
2246
2800
3869
3007
3023
3907
4209
2353
2570
2903
2910
3782
2759
2931
3641
2794
3070
3576
4106
2452
2206
2488
2416
2534
2521
3093
3903
2907
3025
3812
4209


Summary of computational transaction
Raw Inputview raw input (R code)
Raw Outputview raw output of R engine
Computing time1 seconds
R Server'Gwilym Jenkins' @ 72.249.127.135

\begin{tabular}{lllllllll}
\hline
Summary of computational transaction \tabularnewline
Raw Input & view raw input (R code)  \tabularnewline
Raw Output & view raw output of R engine  \tabularnewline
Computing time & 1 seconds \tabularnewline
R Server & 'Gwilym Jenkins' @ 72.249.127.135 \tabularnewline
\hline
\end{tabular}
%Source: https://freestatistics.org/blog/index.php?pk=75533&T=0

[TABLE]
[ROW][C]Summary of computational transaction[/C][/ROW]
[ROW][C]Raw Input[/C][C]view raw input (R code) [/C][/ROW]
[ROW][C]Raw Output[/C][C]view raw output of R engine [/C][/ROW]
[ROW][C]Computing time[/C][C]1 seconds[/C][/ROW]
[ROW][C]R Server[/C][C]'Gwilym Jenkins' @ 72.249.127.135[/C][/ROW]
[/TABLE]
Source: https://freestatistics.org/blog/index.php?pk=75533&T=0

Globally Unique Identifier (entire table): ba.freestatistics.org/blog/index.php?pk=75533&T=0

As an alternative you can also use a QR Code:  

The GUIDs for individual cells are displayed in the table below:

Summary of computational transaction
Raw Inputview raw input (R code)
Raw Outputview raw output of R engine
Computing time1 seconds
R Server'Gwilym Jenkins' @ 72.249.127.135


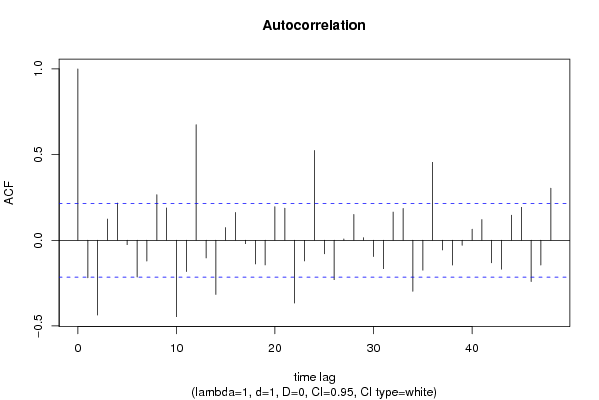
Autocorrelation Function
Time lag kACF(k)T-STATP-value
1-0.21929-1.99780.024505
2-0.436622-3.97787.4e-05
30.1238121.1280.131289
40.217151.97830.025604
5-0.025762-0.23470.407508
6-0.214599-1.95510.026969
7-0.121599-1.10780.13557
80.2658322.42180.00881
90.1888241.72030.044555
10-0.446027-4.06355.5e-05
11-0.18253-1.66290.050049
120.6749086.14870
13-0.103302-0.94110.174686
14-0.316423-2.88280.002509
150.0743350.67720.250075
160.1620511.47640.071816
17-0.020379-0.18570.426582
18-0.138452-1.26140.105357
19-0.143844-1.31050.096825
200.1958581.78430.039011
210.1873721.7070.045777
22-0.36681-3.34180.000625
23-0.120655-1.09920.137425
240.5245024.77844e-06
25-0.078858-0.71840.237255
26-0.230134-2.09660.019536
270.0075660.06890.472607
280.1506891.37280.08675
290.014670.13370.447
30-0.095315-0.86840.193852
31-0.165835-1.51080.067315
320.1643251.49710.069084
330.1856781.69160.047236
34-0.298228-2.7170.004008
35-0.174877-1.59320.057457
360.4548994.14434.1e-05
37-0.056577-0.51540.303806
38-0.145157-1.32240.094827
39-0.02966-0.27020.393832
400.0648330.59070.278179
410.1204381.09720.137855
42-0.13197-1.20230.116332
43-0.168587-1.53590.064183
440.1460441.33050.093495
450.1920771.74990.041915
46-0.24151-2.20030.015284
47-0.144649-1.31780.095596
480.3036542.76640.003492

\begin{tabular}{lllllllll}
\hline
Autocorrelation Function \tabularnewline
Time lag k & ACF(k) & T-STAT & P-value \tabularnewline
1 & -0.21929 & -1.9978 & 0.024505 \tabularnewline
2 & -0.436622 & -3.9778 & 7.4e-05 \tabularnewline
3 & 0.123812 & 1.128 & 0.131289 \tabularnewline
4 & 0.21715 & 1.9783 & 0.025604 \tabularnewline
5 & -0.025762 & -0.2347 & 0.407508 \tabularnewline
6 & -0.214599 & -1.9551 & 0.026969 \tabularnewline
7 & -0.121599 & -1.1078 & 0.13557 \tabularnewline
8 & 0.265832 & 2.4218 & 0.00881 \tabularnewline
9 & 0.188824 & 1.7203 & 0.044555 \tabularnewline
10 & -0.446027 & -4.0635 & 5.5e-05 \tabularnewline
11 & -0.18253 & -1.6629 & 0.050049 \tabularnewline
12 & 0.674908 & 6.1487 & 0 \tabularnewline
13 & -0.103302 & -0.9411 & 0.174686 \tabularnewline
14 & -0.316423 & -2.8828 & 0.002509 \tabularnewline
15 & 0.074335 & 0.6772 & 0.250075 \tabularnewline
16 & 0.162051 & 1.4764 & 0.071816 \tabularnewline
17 & -0.020379 & -0.1857 & 0.426582 \tabularnewline
18 & -0.138452 & -1.2614 & 0.105357 \tabularnewline
19 & -0.143844 & -1.3105 & 0.096825 \tabularnewline
20 & 0.195858 & 1.7843 & 0.039011 \tabularnewline
21 & 0.187372 & 1.707 & 0.045777 \tabularnewline
22 & -0.36681 & -3.3418 & 0.000625 \tabularnewline
23 & -0.120655 & -1.0992 & 0.137425 \tabularnewline
24 & 0.524502 & 4.7784 & 4e-06 \tabularnewline
25 & -0.078858 & -0.7184 & 0.237255 \tabularnewline
26 & -0.230134 & -2.0966 & 0.019536 \tabularnewline
27 & 0.007566 & 0.0689 & 0.472607 \tabularnewline
28 & 0.150689 & 1.3728 & 0.08675 \tabularnewline
29 & 0.01467 & 0.1337 & 0.447 \tabularnewline
30 & -0.095315 & -0.8684 & 0.193852 \tabularnewline
31 & -0.165835 & -1.5108 & 0.067315 \tabularnewline
32 & 0.164325 & 1.4971 & 0.069084 \tabularnewline
33 & 0.185678 & 1.6916 & 0.047236 \tabularnewline
34 & -0.298228 & -2.717 & 0.004008 \tabularnewline
35 & -0.174877 & -1.5932 & 0.057457 \tabularnewline
36 & 0.454899 & 4.1443 & 4.1e-05 \tabularnewline
37 & -0.056577 & -0.5154 & 0.303806 \tabularnewline
38 & -0.145157 & -1.3224 & 0.094827 \tabularnewline
39 & -0.02966 & -0.2702 & 0.393832 \tabularnewline
40 & 0.064833 & 0.5907 & 0.278179 \tabularnewline
41 & 0.120438 & 1.0972 & 0.137855 \tabularnewline
42 & -0.13197 & -1.2023 & 0.116332 \tabularnewline
43 & -0.168587 & -1.5359 & 0.064183 \tabularnewline
44 & 0.146044 & 1.3305 & 0.093495 \tabularnewline
45 & 0.192077 & 1.7499 & 0.041915 \tabularnewline
46 & -0.24151 & -2.2003 & 0.015284 \tabularnewline
47 & -0.144649 & -1.3178 & 0.095596 \tabularnewline
48 & 0.303654 & 2.7664 & 0.003492 \tabularnewline
\hline
\end{tabular}
%Source: https://freestatistics.org/blog/index.php?pk=75533&T=1

[TABLE]
[ROW][C]Autocorrelation Function[/C][/ROW]
[ROW][C]Time lag k[/C][C]ACF(k)[/C][C]T-STAT[/C][C]P-value[/C][/ROW]
[ROW][C]1[/C][C]-0.21929[/C][C]-1.9978[/C][C]0.024505[/C][/ROW]
[ROW][C]2[/C][C]-0.436622[/C][C]-3.9778[/C][C]7.4e-05[/C][/ROW]
[ROW][C]3[/C][C]0.123812[/C][C]1.128[/C][C]0.131289[/C][/ROW]
[ROW][C]4[/C][C]0.21715[/C][C]1.9783[/C][C]0.025604[/C][/ROW]
[ROW][C]5[/C][C]-0.025762[/C][C]-0.2347[/C][C]0.407508[/C][/ROW]
[ROW][C]6[/C][C]-0.214599[/C][C]-1.9551[/C][C]0.026969[/C][/ROW]
[ROW][C]7[/C][C]-0.121599[/C][C]-1.1078[/C][C]0.13557[/C][/ROW]
[ROW][C]8[/C][C]0.265832[/C][C]2.4218[/C][C]0.00881[/C][/ROW]
[ROW][C]9[/C][C]0.188824[/C][C]1.7203[/C][C]0.044555[/C][/ROW]
[ROW][C]10[/C][C]-0.446027[/C][C]-4.0635[/C][C]5.5e-05[/C][/ROW]
[ROW][C]11[/C][C]-0.18253[/C][C]-1.6629[/C][C]0.050049[/C][/ROW]
[ROW][C]12[/C][C]0.674908[/C][C]6.1487[/C][C]0[/C][/ROW]
[ROW][C]13[/C][C]-0.103302[/C][C]-0.9411[/C][C]0.174686[/C][/ROW]
[ROW][C]14[/C][C]-0.316423[/C][C]-2.8828[/C][C]0.002509[/C][/ROW]
[ROW][C]15[/C][C]0.074335[/C][C]0.6772[/C][C]0.250075[/C][/ROW]
[ROW][C]16[/C][C]0.162051[/C][C]1.4764[/C][C]0.071816[/C][/ROW]
[ROW][C]17[/C][C]-0.020379[/C][C]-0.1857[/C][C]0.426582[/C][/ROW]
[ROW][C]18[/C][C]-0.138452[/C][C]-1.2614[/C][C]0.105357[/C][/ROW]
[ROW][C]19[/C][C]-0.143844[/C][C]-1.3105[/C][C]0.096825[/C][/ROW]
[ROW][C]20[/C][C]0.195858[/C][C]1.7843[/C][C]0.039011[/C][/ROW]
[ROW][C]21[/C][C]0.187372[/C][C]1.707[/C][C]0.045777[/C][/ROW]
[ROW][C]22[/C][C]-0.36681[/C][C]-3.3418[/C][C]0.000625[/C][/ROW]
[ROW][C]23[/C][C]-0.120655[/C][C]-1.0992[/C][C]0.137425[/C][/ROW]
[ROW][C]24[/C][C]0.524502[/C][C]4.7784[/C][C]4e-06[/C][/ROW]
[ROW][C]25[/C][C]-0.078858[/C][C]-0.7184[/C][C]0.237255[/C][/ROW]
[ROW][C]26[/C][C]-0.230134[/C][C]-2.0966[/C][C]0.019536[/C][/ROW]
[ROW][C]27[/C][C]0.007566[/C][C]0.0689[/C][C]0.472607[/C][/ROW]
[ROW][C]28[/C][C]0.150689[/C][C]1.3728[/C][C]0.08675[/C][/ROW]
[ROW][C]29[/C][C]0.01467[/C][C]0.1337[/C][C]0.447[/C][/ROW]
[ROW][C]30[/C][C]-0.095315[/C][C]-0.8684[/C][C]0.193852[/C][/ROW]
[ROW][C]31[/C][C]-0.165835[/C][C]-1.5108[/C][C]0.067315[/C][/ROW]
[ROW][C]32[/C][C]0.164325[/C][C]1.4971[/C][C]0.069084[/C][/ROW]
[ROW][C]33[/C][C]0.185678[/C][C]1.6916[/C][C]0.047236[/C][/ROW]
[ROW][C]34[/C][C]-0.298228[/C][C]-2.717[/C][C]0.004008[/C][/ROW]
[ROW][C]35[/C][C]-0.174877[/C][C]-1.5932[/C][C]0.057457[/C][/ROW]
[ROW][C]36[/C][C]0.454899[/C][C]4.1443[/C][C]4.1e-05[/C][/ROW]
[ROW][C]37[/C][C]-0.056577[/C][C]-0.5154[/C][C]0.303806[/C][/ROW]
[ROW][C]38[/C][C]-0.145157[/C][C]-1.3224[/C][C]0.094827[/C][/ROW]
[ROW][C]39[/C][C]-0.02966[/C][C]-0.2702[/C][C]0.393832[/C][/ROW]
[ROW][C]40[/C][C]0.064833[/C][C]0.5907[/C][C]0.278179[/C][/ROW]
[ROW][C]41[/C][C]0.120438[/C][C]1.0972[/C][C]0.137855[/C][/ROW]
[ROW][C]42[/C][C]-0.13197[/C][C]-1.2023[/C][C]0.116332[/C][/ROW]
[ROW][C]43[/C][C]-0.168587[/C][C]-1.5359[/C][C]0.064183[/C][/ROW]
[ROW][C]44[/C][C]0.146044[/C][C]1.3305[/C][C]0.093495[/C][/ROW]
[ROW][C]45[/C][C]0.192077[/C][C]1.7499[/C][C]0.041915[/C][/ROW]
[ROW][C]46[/C][C]-0.24151[/C][C]-2.2003[/C][C]0.015284[/C][/ROW]
[ROW][C]47[/C][C]-0.144649[/C][C]-1.3178[/C][C]0.095596[/C][/ROW]
[ROW][C]48[/C][C]0.303654[/C][C]2.7664[/C][C]0.003492[/C][/ROW]
[/TABLE]
Source: https://freestatistics.org/blog/index.php?pk=75533&T=1

Globally Unique Identifier (entire table): ba.freestatistics.org/blog/index.php?pk=75533&T=1

As an alternative you can also use a QR Code:  

The GUIDs for individual cells are displayed in the table below:

Autocorrelation Function
Time lag kACF(k)T-STATP-value
1-0.21929-1.99780.024505
2-0.436622-3.97787.4e-05
30.1238121.1280.131289
40.217151.97830.025604
5-0.025762-0.23470.407508
6-0.214599-1.95510.026969
7-0.121599-1.10780.13557
80.2658322.42180.00881
90.1888241.72030.044555
10-0.446027-4.06355.5e-05
11-0.18253-1.66290.050049
120.6749086.14870
13-0.103302-0.94110.174686
14-0.316423-2.88280.002509
150.0743350.67720.250075
160.1620511.47640.071816
17-0.020379-0.18570.426582
18-0.138452-1.26140.105357
19-0.143844-1.31050.096825
200.1958581.78430.039011
210.1873721.7070.045777
22-0.36681-3.34180.000625
23-0.120655-1.09920.137425
240.5245024.77844e-06
25-0.078858-0.71840.237255
26-0.230134-2.09660.019536
270.0075660.06890.472607
280.1506891.37280.08675
290.014670.13370.447
30-0.095315-0.86840.193852
31-0.165835-1.51080.067315
320.1643251.49710.069084
330.1856781.69160.047236
34-0.298228-2.7170.004008
35-0.174877-1.59320.057457
360.4548994.14434.1e-05
37-0.056577-0.51540.303806
38-0.145157-1.32240.094827
39-0.02966-0.27020.393832
400.0648330.59070.278179
410.1204381.09720.137855
42-0.13197-1.20230.116332
43-0.168587-1.53590.064183
440.1460441.33050.093495
450.1920771.74990.041915
46-0.24151-2.20030.015284
47-0.144649-1.31780.095596
480.3036542.76640.003492


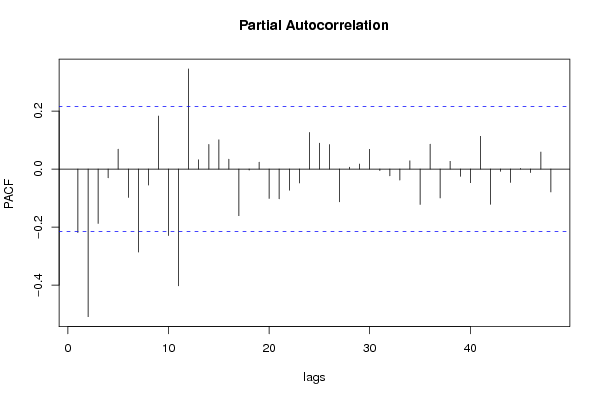
Partial Autocorrelation Function
Time lag kPACF(k)T-STATP-value
1-0.21929-1.99780.024505
2-0.509197-4.6396e-06
3-0.187705-1.71010.045494
4-0.030359-0.27660.391393
50.0687320.62620.266459
6-0.097906-0.8920.187494
7-0.286418-2.60940.005379
8-0.055079-0.50180.308569
90.1827991.66540.049804
10-0.22965-2.09220.019738
11-0.402797-3.66970.000214
120.3453243.1460.001149
130.0320120.29160.385644
140.0850080.77450.220431
150.100820.91850.180506
160.0341670.31130.378184
17-0.160909-1.4660.07322
18-0.003679-0.03350.486673
190.0234850.2140.415551
20-0.101604-0.92570.178654
21-0.102727-0.93590.176023
22-0.072807-0.66330.254487
23-0.0479-0.43640.331844
240.126331.15090.126535
250.0891260.8120.209565
260.0843220.76820.22227
27-0.112837-1.0280.15347
280.006410.05840.476787
290.0171790.15650.438006
300.0678750.61840.269013
31-0.005334-0.04860.480679
32-0.023161-0.2110.416698
33-0.038201-0.3480.364351
340.0283830.25860.3983
35-0.121959-1.11110.134866
360.0859640.78320.217879
37-0.099745-0.90870.183064
380.026760.24380.403997
39-0.024949-0.22730.410375
40-0.047173-0.42980.334239
410.1128521.02810.153438
42-0.121585-1.10770.135596
43-0.007674-0.06990.472216
44-0.046227-0.42120.337367
450.0021930.020.492055
46-0.012055-0.10980.456406
470.0584180.53220.298001
48-0.079036-0.720.236759

\begin{tabular}{lllllllll}
\hline
Partial Autocorrelation Function \tabularnewline
Time lag k & PACF(k) & T-STAT & P-value \tabularnewline
1 & -0.21929 & -1.9978 & 0.024505 \tabularnewline
2 & -0.509197 & -4.639 & 6e-06 \tabularnewline
3 & -0.187705 & -1.7101 & 0.045494 \tabularnewline
4 & -0.030359 & -0.2766 & 0.391393 \tabularnewline
5 & 0.068732 & 0.6262 & 0.266459 \tabularnewline
6 & -0.097906 & -0.892 & 0.187494 \tabularnewline
7 & -0.286418 & -2.6094 & 0.005379 \tabularnewline
8 & -0.055079 & -0.5018 & 0.308569 \tabularnewline
9 & 0.182799 & 1.6654 & 0.049804 \tabularnewline
10 & -0.22965 & -2.0922 & 0.019738 \tabularnewline
11 & -0.402797 & -3.6697 & 0.000214 \tabularnewline
12 & 0.345324 & 3.146 & 0.001149 \tabularnewline
13 & 0.032012 & 0.2916 & 0.385644 \tabularnewline
14 & 0.085008 & 0.7745 & 0.220431 \tabularnewline
15 & 0.10082 & 0.9185 & 0.180506 \tabularnewline
16 & 0.034167 & 0.3113 & 0.378184 \tabularnewline
17 & -0.160909 & -1.466 & 0.07322 \tabularnewline
18 & -0.003679 & -0.0335 & 0.486673 \tabularnewline
19 & 0.023485 & 0.214 & 0.415551 \tabularnewline
20 & -0.101604 & -0.9257 & 0.178654 \tabularnewline
21 & -0.102727 & -0.9359 & 0.176023 \tabularnewline
22 & -0.072807 & -0.6633 & 0.254487 \tabularnewline
23 & -0.0479 & -0.4364 & 0.331844 \tabularnewline
24 & 0.12633 & 1.1509 & 0.126535 \tabularnewline
25 & 0.089126 & 0.812 & 0.209565 \tabularnewline
26 & 0.084322 & 0.7682 & 0.22227 \tabularnewline
27 & -0.112837 & -1.028 & 0.15347 \tabularnewline
28 & 0.00641 & 0.0584 & 0.476787 \tabularnewline
29 & 0.017179 & 0.1565 & 0.438006 \tabularnewline
30 & 0.067875 & 0.6184 & 0.269013 \tabularnewline
31 & -0.005334 & -0.0486 & 0.480679 \tabularnewline
32 & -0.023161 & -0.211 & 0.416698 \tabularnewline
33 & -0.038201 & -0.348 & 0.364351 \tabularnewline
34 & 0.028383 & 0.2586 & 0.3983 \tabularnewline
35 & -0.121959 & -1.1111 & 0.134866 \tabularnewline
36 & 0.085964 & 0.7832 & 0.217879 \tabularnewline
37 & -0.099745 & -0.9087 & 0.183064 \tabularnewline
38 & 0.02676 & 0.2438 & 0.403997 \tabularnewline
39 & -0.024949 & -0.2273 & 0.410375 \tabularnewline
40 & -0.047173 & -0.4298 & 0.334239 \tabularnewline
41 & 0.112852 & 1.0281 & 0.153438 \tabularnewline
42 & -0.121585 & -1.1077 & 0.135596 \tabularnewline
43 & -0.007674 & -0.0699 & 0.472216 \tabularnewline
44 & -0.046227 & -0.4212 & 0.337367 \tabularnewline
45 & 0.002193 & 0.02 & 0.492055 \tabularnewline
46 & -0.012055 & -0.1098 & 0.456406 \tabularnewline
47 & 0.058418 & 0.5322 & 0.298001 \tabularnewline
48 & -0.079036 & -0.72 & 0.236759 \tabularnewline
\hline
\end{tabular}
%Source: https://freestatistics.org/blog/index.php?pk=75533&T=2

[TABLE]
[ROW][C]Partial Autocorrelation Function[/C][/ROW]
[ROW][C]Time lag k[/C][C]PACF(k)[/C][C]T-STAT[/C][C]P-value[/C][/ROW]
[ROW][C]1[/C][C]-0.21929[/C][C]-1.9978[/C][C]0.024505[/C][/ROW]
[ROW][C]2[/C][C]-0.509197[/C][C]-4.639[/C][C]6e-06[/C][/ROW]
[ROW][C]3[/C][C]-0.187705[/C][C]-1.7101[/C][C]0.045494[/C][/ROW]
[ROW][C]4[/C][C]-0.030359[/C][C]-0.2766[/C][C]0.391393[/C][/ROW]
[ROW][C]5[/C][C]0.068732[/C][C]0.6262[/C][C]0.266459[/C][/ROW]
[ROW][C]6[/C][C]-0.097906[/C][C]-0.892[/C][C]0.187494[/C][/ROW]
[ROW][C]7[/C][C]-0.286418[/C][C]-2.6094[/C][C]0.005379[/C][/ROW]
[ROW][C]8[/C][C]-0.055079[/C][C]-0.5018[/C][C]0.308569[/C][/ROW]
[ROW][C]9[/C][C]0.182799[/C][C]1.6654[/C][C]0.049804[/C][/ROW]
[ROW][C]10[/C][C]-0.22965[/C][C]-2.0922[/C][C]0.019738[/C][/ROW]
[ROW][C]11[/C][C]-0.402797[/C][C]-3.6697[/C][C]0.000214[/C][/ROW]
[ROW][C]12[/C][C]0.345324[/C][C]3.146[/C][C]0.001149[/C][/ROW]
[ROW][C]13[/C][C]0.032012[/C][C]0.2916[/C][C]0.385644[/C][/ROW]
[ROW][C]14[/C][C]0.085008[/C][C]0.7745[/C][C]0.220431[/C][/ROW]
[ROW][C]15[/C][C]0.10082[/C][C]0.9185[/C][C]0.180506[/C][/ROW]
[ROW][C]16[/C][C]0.034167[/C][C]0.3113[/C][C]0.378184[/C][/ROW]
[ROW][C]17[/C][C]-0.160909[/C][C]-1.466[/C][C]0.07322[/C][/ROW]
[ROW][C]18[/C][C]-0.003679[/C][C]-0.0335[/C][C]0.486673[/C][/ROW]
[ROW][C]19[/C][C]0.023485[/C][C]0.214[/C][C]0.415551[/C][/ROW]
[ROW][C]20[/C][C]-0.101604[/C][C]-0.9257[/C][C]0.178654[/C][/ROW]
[ROW][C]21[/C][C]-0.102727[/C][C]-0.9359[/C][C]0.176023[/C][/ROW]
[ROW][C]22[/C][C]-0.072807[/C][C]-0.6633[/C][C]0.254487[/C][/ROW]
[ROW][C]23[/C][C]-0.0479[/C][C]-0.4364[/C][C]0.331844[/C][/ROW]
[ROW][C]24[/C][C]0.12633[/C][C]1.1509[/C][C]0.126535[/C][/ROW]
[ROW][C]25[/C][C]0.089126[/C][C]0.812[/C][C]0.209565[/C][/ROW]
[ROW][C]26[/C][C]0.084322[/C][C]0.7682[/C][C]0.22227[/C][/ROW]
[ROW][C]27[/C][C]-0.112837[/C][C]-1.028[/C][C]0.15347[/C][/ROW]
[ROW][C]28[/C][C]0.00641[/C][C]0.0584[/C][C]0.476787[/C][/ROW]
[ROW][C]29[/C][C]0.017179[/C][C]0.1565[/C][C]0.438006[/C][/ROW]
[ROW][C]30[/C][C]0.067875[/C][C]0.6184[/C][C]0.269013[/C][/ROW]
[ROW][C]31[/C][C]-0.005334[/C][C]-0.0486[/C][C]0.480679[/C][/ROW]
[ROW][C]32[/C][C]-0.023161[/C][C]-0.211[/C][C]0.416698[/C][/ROW]
[ROW][C]33[/C][C]-0.038201[/C][C]-0.348[/C][C]0.364351[/C][/ROW]
[ROW][C]34[/C][C]0.028383[/C][C]0.2586[/C][C]0.3983[/C][/ROW]
[ROW][C]35[/C][C]-0.121959[/C][C]-1.1111[/C][C]0.134866[/C][/ROW]
[ROW][C]36[/C][C]0.085964[/C][C]0.7832[/C][C]0.217879[/C][/ROW]
[ROW][C]37[/C][C]-0.099745[/C][C]-0.9087[/C][C]0.183064[/C][/ROW]
[ROW][C]38[/C][C]0.02676[/C][C]0.2438[/C][C]0.403997[/C][/ROW]
[ROW][C]39[/C][C]-0.024949[/C][C]-0.2273[/C][C]0.410375[/C][/ROW]
[ROW][C]40[/C][C]-0.047173[/C][C]-0.4298[/C][C]0.334239[/C][/ROW]
[ROW][C]41[/C][C]0.112852[/C][C]1.0281[/C][C]0.153438[/C][/ROW]
[ROW][C]42[/C][C]-0.121585[/C][C]-1.1077[/C][C]0.135596[/C][/ROW]
[ROW][C]43[/C][C]-0.007674[/C][C]-0.0699[/C][C]0.472216[/C][/ROW]
[ROW][C]44[/C][C]-0.046227[/C][C]-0.4212[/C][C]0.337367[/C][/ROW]
[ROW][C]45[/C][C]0.002193[/C][C]0.02[/C][C]0.492055[/C][/ROW]
[ROW][C]46[/C][C]-0.012055[/C][C]-0.1098[/C][C]0.456406[/C][/ROW]
[ROW][C]47[/C][C]0.058418[/C][C]0.5322[/C][C]0.298001[/C][/ROW]
[ROW][C]48[/C][C]-0.079036[/C][C]-0.72[/C][C]0.236759[/C][/ROW]
[/TABLE]
Source: https://freestatistics.org/blog/index.php?pk=75533&T=2

Globally Unique Identifier (entire table): ba.freestatistics.org/blog/index.php?pk=75533&T=2

As an alternative you can also use a QR Code:  

The GUIDs for individual cells are displayed in the table below:

Partial Autocorrelation Function
Time lag kPACF(k)T-STATP-value
1-0.21929-1.99780.024505
2-0.509197-4.6396e-06
3-0.187705-1.71010.045494
4-0.030359-0.27660.391393
50.0687320.62620.266459
6-0.097906-0.8920.187494
7-0.286418-2.60940.005379
8-0.055079-0.50180.308569
90.1827991.66540.049804
10-0.22965-2.09220.019738
11-0.402797-3.66970.000214
120.3453243.1460.001149
130.0320120.29160.385644
140.0850080.77450.220431
150.100820.91850.180506
160.0341670.31130.378184
17-0.160909-1.4660.07322
18-0.003679-0.03350.486673
190.0234850.2140.415551
20-0.101604-0.92570.178654
21-0.102727-0.93590.176023
22-0.072807-0.66330.254487
23-0.0479-0.43640.331844
240.126331.15090.126535
250.0891260.8120.209565
260.0843220.76820.22227
27-0.112837-1.0280.15347
280.006410.05840.476787
290.0171790.15650.438006
300.0678750.61840.269013
31-0.005334-0.04860.480679
32-0.023161-0.2110.416698
33-0.038201-0.3480.364351
340.0283830.25860.3983
35-0.121959-1.11110.134866
360.0859640.78320.217879
37-0.099745-0.90870.183064
380.026760.24380.403997
39-0.024949-0.22730.410375
40-0.047173-0.42980.334239
410.1128521.02810.153438
42-0.121585-1.10770.135596
43-0.007674-0.06990.472216
44-0.046227-0.42120.337367
450.0021930.020.492055
46-0.012055-0.10980.456406
470.0584180.53220.298001
48-0.079036-0.720.236759


Parameters (Session):
par1 = 48 ; par2 = 1 ; par3 = 1 ; par4 = 0 ; par5 = 12 ; par6 = White Noise ; par7 = 0.95 ;
Parameters (R input):
par1 = 48 ; par2 = 1 ; par3 = 1 ; par4 = 0 ; par5 = 12 ; par6 = White Noise ; par7 = 0.95 ;
R code (references can be found in the software module):
if (par1 == 'Default') {
par1 = 10*log10(length(x))
} else {
par1 <- as.numeric(par1)
}
par2 <- as.numeric(par2)
par3 <- as.numeric(par3)
par4 <- as.numeric(par4)
par5 <- as.numeric(par5)
if (par6 == 'White Noise') par6 <- 'white' else par6 <- 'ma'
par7 <- as.numeric(par7)
if (par2 == 0) {
x <- log(x)
} else {
x <- (x ^ par2 - 1) / par2
}
if (par3 > 0) x <- diff(x,lag=1,difference=par3)
if (par4 > 0) x <- diff(x,lag=par5,difference=par4)
bitmap(file='pic1.png')
racf <- acf(x, par1, main='Autocorrelation', xlab='time lag', ylab='ACF', ci.type=par6, ci=par7, sub=paste('(lambda=',par2,', d=',par3,', D=',par4,', CI=', par7, ', CI type=',par6,')',sep=''))
dev.off()
bitmap(file='pic2.png')
rpacf <- pacf(x,par1,main='Partial Autocorrelation',xlab='lags',ylab='PACF')
dev.off()
(myacf <- c(racf$acf))
(mypacf <- c(rpacf$acf))
lengthx <- length(x)
sqrtn <- sqrt(lengthx)
load(file='createtable')
a<-table.start()
a<-table.row.start(a)
a<-table.element(a,'Autocorrelation Function',4,TRUE)
a<-table.row.end(a)
a<-table.row.start(a)
a<-table.element(a,'Time lag k',header=TRUE)
a<-table.element(a,hyperlink('basics.htm','ACF(k)','click here for more information about the Autocorrelation Function'),header=TRUE)
a<-table.element(a,'T-STAT',header=TRUE)
a<-table.element(a,'P-value',header=TRUE)
a<-table.row.end(a)
for (i in 2:(par1+1)) {
a<-table.row.start(a)
a<-table.element(a,i-1,header=TRUE)
a<-table.element(a,round(myacf[i],6))
mytstat <- myacf[i]*sqrtn
a<-table.element(a,round(mytstat,4))
a<-table.element(a,round(1-pt(abs(mytstat),lengthx),6))
a<-table.row.end(a)
}
a<-table.end(a)
table.save(a,file='mytable.tab')
a<-table.start()
a<-table.row.start(a)
a<-table.element(a,'Partial Autocorrelation Function',4,TRUE)
a<-table.row.end(a)
a<-table.row.start(a)
a<-table.element(a,'Time lag k',header=TRUE)
a<-table.element(a,hyperlink('basics.htm','PACF(k)','click here for more information about the Partial Autocorrelation Function'),header=TRUE)
a<-table.element(a,'T-STAT',header=TRUE)
a<-table.element(a,'P-value',header=TRUE)
a<-table.row.end(a)
for (i in 1:par1) {
a<-table.row.start(a)
a<-table.element(a,i,header=TRUE)
a<-table.element(a,round(mypacf[i],6))
mytstat <- mypacf[i]*sqrtn
a<-table.element(a,round(mytstat,4))
a<-table.element(a,round(1-pt(abs(mytstat),lengthx),6))
a<-table.row.end(a)
}
a<-table.end(a)
table.save(a,file='mytable1.tab')