Free Statistics

of Irreproducible Research!

Author's title

Author*Unverified author*
R Software Modulerwasp_autocorrelation.wasp
Title produced by software(Partial) Autocorrelation Function
Date of computationWed, 05 May 2010 15:38:59 +0000
Cite this page as followsStatistical Computations at FreeStatistics.org, Office for Research Development and Education, URL https://freestatistics.org/blog/index.php?v=date/2010/May/05/t1273073993kyw8nkqu1c5qcjg.htm/, Retrieved Sat, 27 Apr 2024 16:43:27 +0000
Statistical Computations at FreeStatistics.org, Office for Research Development and Education, URL https://freestatistics.org/blog/index.php?pk=75540, Retrieved Sat, 27 Apr 2024 16:43:27 +0000
QR Codes:

Original text written by user:
IsPrivate?No (this computation is public)
User-defined keywordsKDGP2W21
Estimated Impact166
Family? (F = Feedback message, R = changed R code, M = changed R Module, P = changed Parameters, D = changed Data)
-     [(Partial) Autocorrelation Function] [] [2010-05-05 15:17:25] [c6ebbe7a5fe9990667cad80722534846]
-    D    [(Partial) Autocorrelation Function] [] [2010-05-05 15:38:59] [34252ed26d999a27212450e9b83760c6] [Current]
-   P       [(Partial) Autocorrelation Function] [] [2010-05-05 15:42:58] [c6ebbe7a5fe9990667cad80722534846]
Feedback Forum

Post a new message
Dataseries X:
1772.2
1769.5
1768
1794.8
1823.4
1856.9
1866.9
1869.8
1843.8
1837.1
1857.7
1840.3
1914.6
1972.9
2050.1
2086.2
2112.5
2147.6
2190.4
2194.1
2216.2
2218.6
2233.5
2307.2
2350.4
2368.2
2353.8
2316.5
2305.5
2308.4
2334.4
2381.2
2449.7
2490.3
2523.5
2537.6
2526.1
2545.9
2542.7
2584.3
2600.2
2593.9
2618.9
2591.3
2521.2
2536.6
2596.1
2656.6
2710.3
2778.8
2775.5
2785.2
2847.7
2834.4
2839
2802.6
2819.3
2872
2918.4
2977.8
3031.2
3064.7
3093
3100.6
3141.1
3180.4
3240.3
3265
3338.2
3376.6
3422.5
3432
3516.3
3564
3636.3
3724
3815.4
3828.1
3853.3
3884.5
3918.7
3919.6
3950.8
3981
4063
4132
4160.3
4178.3
4244.1
4256.5
4283.4
4263.3
4256.6
4264.3
4302.3
4256.6
4374
4398.8
4433.9
4446.3
4525.8
4633.1
4677.5
4754.5
4876.2
4932.6
4906.3
4953.1
4909.6
4922.2
4873.5
4854.3
4795.3
4831.9
4913.3
4977.5
5090.7
5128.9
5154.1
5191.5
5251.8
5356.1
5451.9
5450.8
5469.4
5684.6
5740.3
5816.2
5825.9
5831.4
5873.3
5889.5
5908.5
5787.4
5776.6
5883.5
6005.7
5957.8
6030.2
5955.1
5857.3
5889.1
5866.4
5871
5944
6077.6
6197.5
6325.6
6448.3
6559.6
6623.3
6677.3
6740.3
6797.3
6903.5
6955.9
7022.8
7051
7119
7153.4
7193
7269.5
7332.6
7458
7496.6
7592.9
7632.1
7734
7806.6
7865
7927.4
7944.7
8027.7
8059.6
8059.5
7988.9
7950.2
8003.8
8037.5
8069
8157.6
8244.3
8329.4
8417
8432.5
8486.4
8531.1
8643.8
8727.9
8847.3
8904.3
9003.2
9025.3
9044.7
9120.7
9184.3
9247.2
9407.1
9488.9
9592.5
9666.2
9809.6
9932.7
10008.9
10103.4
10194.3
10328.8
10507.6
10601.2
10684
10819.9
11014.3
11043
11258.5
11267.9
11334.5
11297.2
11371.3
11340.1
11380.1
11477.9
11538.8
11596.4
11598.8
11645.8
11738.7
11935.5
12042.8
12127.6
12213.8
12303.5
12410.3
12534.1
12587.5
12683.2
12748.7
12915.9
12962.5
12965.9
13060.7
13099.9
13204
13321.1
13391.2
13366.9
13415.3
13324.6
13141.9
12925.4
12901.5
12973
13155


Summary of computational transaction
Raw Inputview raw input (R code)
Raw Outputview raw output of R engine
Computing time1 seconds
R Server'Gwilym Jenkins' @ 72.249.127.135

\begin{tabular}{lllllllll}
\hline
Summary of computational transaction \tabularnewline
Raw Input & view raw input (R code)  \tabularnewline
Raw Output & view raw output of R engine  \tabularnewline
Computing time & 1 seconds \tabularnewline
R Server & 'Gwilym Jenkins' @ 72.249.127.135 \tabularnewline
\hline
\end{tabular}
%Source: https://freestatistics.org/blog/index.php?pk=75540&T=0

[TABLE]
[ROW][C]Summary of computational transaction[/C][/ROW]
[ROW][C]Raw Input[/C][C]view raw input (R code) [/C][/ROW]
[ROW][C]Raw Output[/C][C]view raw output of R engine [/C][/ROW]
[ROW][C]Computing time[/C][C]1 seconds[/C][/ROW]
[ROW][C]R Server[/C][C]'Gwilym Jenkins' @ 72.249.127.135[/C][/ROW]
[/TABLE]
Source: https://freestatistics.org/blog/index.php?pk=75540&T=0

Globally Unique Identifier (entire table): ba.freestatistics.org/blog/index.php?pk=75540&T=0

As an alternative you can also use a QR Code:  

The GUIDs for individual cells are displayed in the table below:

Summary of computational transaction
Raw Inputview raw input (R code)
Raw Outputview raw output of R engine
Computing time1 seconds
R Server'Gwilym Jenkins' @ 72.249.127.135


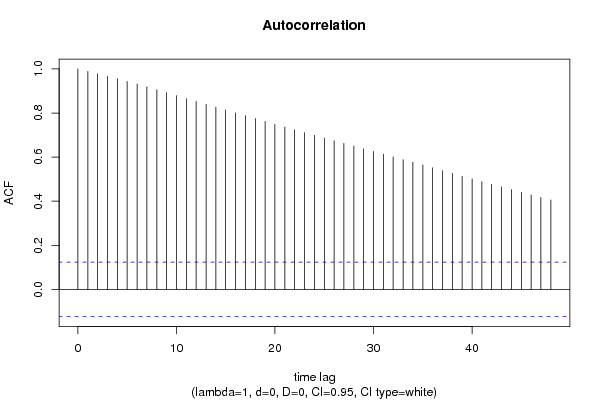
Autocorrelation Function
Time lag kACF(k)T-STATP-value
10.98891115.69850
20.97794115.52430
30.96687415.34870
40.95559615.16960
50.94368114.98050
60.9312314.78280
70.91839614.57910
80.90549114.37420
90.89231514.16510
100.87907213.95480
110.86591213.74590
120.85276713.53730
130.83966213.32920
140.82668213.12320
150.81364912.91630
160.80059612.70910
170.78776212.50530
180.77494612.30190
190.76222312.09990
200.74943111.89690
210.73675311.69560
220.72414211.49540
230.71157511.29590
240.69913111.09840
250.68674410.90170
260.67442610.70620
270.66234610.51440
280.65025210.32240
290.63806610.1290
300.6256989.93260
310.6133219.73620
320.6009659.540
330.5887459.3460
340.5765139.15190
350.5640918.95470
360.5517048.7580
370.5390688.55740
380.5264668.35740
390.5137248.15510
400.5013737.9590
410.4889527.76190
420.4767977.56890
430.4648057.37860
440.452797.18780
450.4407126.99610
460.4288826.80830
470.4172886.62420
480.4058346.44240

\begin{tabular}{lllllllll}
\hline
Autocorrelation Function \tabularnewline
Time lag k & ACF(k) & T-STAT & P-value \tabularnewline
1 & 0.988911 & 15.6985 & 0 \tabularnewline
2 & 0.977941 & 15.5243 & 0 \tabularnewline
3 & 0.966874 & 15.3487 & 0 \tabularnewline
4 & 0.955596 & 15.1696 & 0 \tabularnewline
5 & 0.943681 & 14.9805 & 0 \tabularnewline
6 & 0.93123 & 14.7828 & 0 \tabularnewline
7 & 0.918396 & 14.5791 & 0 \tabularnewline
8 & 0.905491 & 14.3742 & 0 \tabularnewline
9 & 0.892315 & 14.1651 & 0 \tabularnewline
10 & 0.879072 & 13.9548 & 0 \tabularnewline
11 & 0.865912 & 13.7459 & 0 \tabularnewline
12 & 0.852767 & 13.5373 & 0 \tabularnewline
13 & 0.839662 & 13.3292 & 0 \tabularnewline
14 & 0.826682 & 13.1232 & 0 \tabularnewline
15 & 0.813649 & 12.9163 & 0 \tabularnewline
16 & 0.800596 & 12.7091 & 0 \tabularnewline
17 & 0.787762 & 12.5053 & 0 \tabularnewline
18 & 0.774946 & 12.3019 & 0 \tabularnewline
19 & 0.762223 & 12.0999 & 0 \tabularnewline
20 & 0.749431 & 11.8969 & 0 \tabularnewline
21 & 0.736753 & 11.6956 & 0 \tabularnewline
22 & 0.724142 & 11.4954 & 0 \tabularnewline
23 & 0.711575 & 11.2959 & 0 \tabularnewline
24 & 0.699131 & 11.0984 & 0 \tabularnewline
25 & 0.686744 & 10.9017 & 0 \tabularnewline
26 & 0.674426 & 10.7062 & 0 \tabularnewline
27 & 0.662346 & 10.5144 & 0 \tabularnewline
28 & 0.650252 & 10.3224 & 0 \tabularnewline
29 & 0.638066 & 10.129 & 0 \tabularnewline
30 & 0.625698 & 9.9326 & 0 \tabularnewline
31 & 0.613321 & 9.7362 & 0 \tabularnewline
32 & 0.600965 & 9.54 & 0 \tabularnewline
33 & 0.588745 & 9.346 & 0 \tabularnewline
34 & 0.576513 & 9.1519 & 0 \tabularnewline
35 & 0.564091 & 8.9547 & 0 \tabularnewline
36 & 0.551704 & 8.758 & 0 \tabularnewline
37 & 0.539068 & 8.5574 & 0 \tabularnewline
38 & 0.526466 & 8.3574 & 0 \tabularnewline
39 & 0.513724 & 8.1551 & 0 \tabularnewline
40 & 0.501373 & 7.959 & 0 \tabularnewline
41 & 0.488952 & 7.7619 & 0 \tabularnewline
42 & 0.476797 & 7.5689 & 0 \tabularnewline
43 & 0.464805 & 7.3786 & 0 \tabularnewline
44 & 0.45279 & 7.1878 & 0 \tabularnewline
45 & 0.440712 & 6.9961 & 0 \tabularnewline
46 & 0.428882 & 6.8083 & 0 \tabularnewline
47 & 0.417288 & 6.6242 & 0 \tabularnewline
48 & 0.405834 & 6.4424 & 0 \tabularnewline
\hline
\end{tabular}
%Source: https://freestatistics.org/blog/index.php?pk=75540&T=1

[TABLE]
[ROW][C]Autocorrelation Function[/C][/ROW]
[ROW][C]Time lag k[/C][C]ACF(k)[/C][C]T-STAT[/C][C]P-value[/C][/ROW]
[ROW][C]1[/C][C]0.988911[/C][C]15.6985[/C][C]0[/C][/ROW]
[ROW][C]2[/C][C]0.977941[/C][C]15.5243[/C][C]0[/C][/ROW]
[ROW][C]3[/C][C]0.966874[/C][C]15.3487[/C][C]0[/C][/ROW]
[ROW][C]4[/C][C]0.955596[/C][C]15.1696[/C][C]0[/C][/ROW]
[ROW][C]5[/C][C]0.943681[/C][C]14.9805[/C][C]0[/C][/ROW]
[ROW][C]6[/C][C]0.93123[/C][C]14.7828[/C][C]0[/C][/ROW]
[ROW][C]7[/C][C]0.918396[/C][C]14.5791[/C][C]0[/C][/ROW]
[ROW][C]8[/C][C]0.905491[/C][C]14.3742[/C][C]0[/C][/ROW]
[ROW][C]9[/C][C]0.892315[/C][C]14.1651[/C][C]0[/C][/ROW]
[ROW][C]10[/C][C]0.879072[/C][C]13.9548[/C][C]0[/C][/ROW]
[ROW][C]11[/C][C]0.865912[/C][C]13.7459[/C][C]0[/C][/ROW]
[ROW][C]12[/C][C]0.852767[/C][C]13.5373[/C][C]0[/C][/ROW]
[ROW][C]13[/C][C]0.839662[/C][C]13.3292[/C][C]0[/C][/ROW]
[ROW][C]14[/C][C]0.826682[/C][C]13.1232[/C][C]0[/C][/ROW]
[ROW][C]15[/C][C]0.813649[/C][C]12.9163[/C][C]0[/C][/ROW]
[ROW][C]16[/C][C]0.800596[/C][C]12.7091[/C][C]0[/C][/ROW]
[ROW][C]17[/C][C]0.787762[/C][C]12.5053[/C][C]0[/C][/ROW]
[ROW][C]18[/C][C]0.774946[/C][C]12.3019[/C][C]0[/C][/ROW]
[ROW][C]19[/C][C]0.762223[/C][C]12.0999[/C][C]0[/C][/ROW]
[ROW][C]20[/C][C]0.749431[/C][C]11.8969[/C][C]0[/C][/ROW]
[ROW][C]21[/C][C]0.736753[/C][C]11.6956[/C][C]0[/C][/ROW]
[ROW][C]22[/C][C]0.724142[/C][C]11.4954[/C][C]0[/C][/ROW]
[ROW][C]23[/C][C]0.711575[/C][C]11.2959[/C][C]0[/C][/ROW]
[ROW][C]24[/C][C]0.699131[/C][C]11.0984[/C][C]0[/C][/ROW]
[ROW][C]25[/C][C]0.686744[/C][C]10.9017[/C][C]0[/C][/ROW]
[ROW][C]26[/C][C]0.674426[/C][C]10.7062[/C][C]0[/C][/ROW]
[ROW][C]27[/C][C]0.662346[/C][C]10.5144[/C][C]0[/C][/ROW]
[ROW][C]28[/C][C]0.650252[/C][C]10.3224[/C][C]0[/C][/ROW]
[ROW][C]29[/C][C]0.638066[/C][C]10.129[/C][C]0[/C][/ROW]
[ROW][C]30[/C][C]0.625698[/C][C]9.9326[/C][C]0[/C][/ROW]
[ROW][C]31[/C][C]0.613321[/C][C]9.7362[/C][C]0[/C][/ROW]
[ROW][C]32[/C][C]0.600965[/C][C]9.54[/C][C]0[/C][/ROW]
[ROW][C]33[/C][C]0.588745[/C][C]9.346[/C][C]0[/C][/ROW]
[ROW][C]34[/C][C]0.576513[/C][C]9.1519[/C][C]0[/C][/ROW]
[ROW][C]35[/C][C]0.564091[/C][C]8.9547[/C][C]0[/C][/ROW]
[ROW][C]36[/C][C]0.551704[/C][C]8.758[/C][C]0[/C][/ROW]
[ROW][C]37[/C][C]0.539068[/C][C]8.5574[/C][C]0[/C][/ROW]
[ROW][C]38[/C][C]0.526466[/C][C]8.3574[/C][C]0[/C][/ROW]
[ROW][C]39[/C][C]0.513724[/C][C]8.1551[/C][C]0[/C][/ROW]
[ROW][C]40[/C][C]0.501373[/C][C]7.959[/C][C]0[/C][/ROW]
[ROW][C]41[/C][C]0.488952[/C][C]7.7619[/C][C]0[/C][/ROW]
[ROW][C]42[/C][C]0.476797[/C][C]7.5689[/C][C]0[/C][/ROW]
[ROW][C]43[/C][C]0.464805[/C][C]7.3786[/C][C]0[/C][/ROW]
[ROW][C]44[/C][C]0.45279[/C][C]7.1878[/C][C]0[/C][/ROW]
[ROW][C]45[/C][C]0.440712[/C][C]6.9961[/C][C]0[/C][/ROW]
[ROW][C]46[/C][C]0.428882[/C][C]6.8083[/C][C]0[/C][/ROW]
[ROW][C]47[/C][C]0.417288[/C][C]6.6242[/C][C]0[/C][/ROW]
[ROW][C]48[/C][C]0.405834[/C][C]6.4424[/C][C]0[/C][/ROW]
[/TABLE]
Source: https://freestatistics.org/blog/index.php?pk=75540&T=1

Globally Unique Identifier (entire table): ba.freestatistics.org/blog/index.php?pk=75540&T=1

As an alternative you can also use a QR Code:  

The GUIDs for individual cells are displayed in the table below:

Autocorrelation Function
Time lag kACF(k)T-STATP-value
10.98891115.69850
20.97794115.52430
30.96687415.34870
40.95559615.16960
50.94368114.98050
60.9312314.78280
70.91839614.57910
80.90549114.37420
90.89231514.16510
100.87907213.95480
110.86591213.74590
120.85276713.53730
130.83966213.32920
140.82668213.12320
150.81364912.91630
160.80059612.70910
170.78776212.50530
180.77494612.30190
190.76222312.09990
200.74943111.89690
210.73675311.69560
220.72414211.49540
230.71157511.29590
240.69913111.09840
250.68674410.90170
260.67442610.70620
270.66234610.51440
280.65025210.32240
290.63806610.1290
300.6256989.93260
310.6133219.73620
320.6009659.540
330.5887459.3460
340.5765139.15190
350.5640918.95470
360.5517048.7580
370.5390688.55740
380.5264668.35740
390.5137248.15510
400.5013737.9590
410.4889527.76190
420.4767977.56890
430.4648057.37860
440.452797.18780
450.4407126.99610
460.4288826.80830
470.4172886.62420
480.4058346.44240


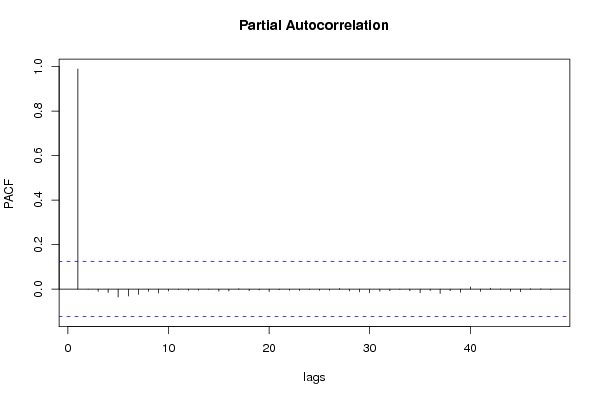
Partial Autocorrelation Function
Time lag kPACF(k)T-STATP-value
10.98891115.69850
2-0.000234-0.00370.498516
3-0.009851-0.15640.437932
4-0.015261-0.24230.404388
5-0.034776-0.5520.290703
6-0.030712-0.48750.313152
7-0.023824-0.37820.352801
8-0.009501-0.15080.440115
9-0.017773-0.28210.389037
10-0.008478-0.13460.446524
11-0.001636-0.0260.489649
12-0.005128-0.08140.467592
13-0.004148-0.06580.473778
14-0.000694-0.0110.49561
15-0.00922-0.14640.441878
16-0.008341-0.13240.447382
170.0023690.03760.485014
18-0.006588-0.10460.458397
19-0.003376-0.05360.478649
20-0.010562-0.16770.43349
21-0.002738-0.04350.48268
22-0.004771-0.07570.469846
23-0.005798-0.0920.463368
24-0.001844-0.02930.488337
25-0.00514-0.08160.467515
26-0.004572-0.07260.471097
270.0030240.0480.480878
28-0.008274-0.13140.447801
29-0.012124-0.19250.423768
30-0.016442-0.2610.39715
31-0.008992-0.14270.443306
32-0.007347-0.11660.453621
33-0.001425-0.02260.490986
34-0.007505-0.11910.452632
35-0.015919-0.25270.400348
36-0.006301-0.10.460205
37-0.019207-0.30490.380349
38-0.006771-0.10750.457243
39-0.014165-0.22490.411134
400.0098430.15620.437983
41-0.010465-0.16610.434092
420.0041920.06650.4735
430.0001530.00240.499035
44-0.009732-0.15450.438671
45-0.011622-0.18450.42689
460.0014760.02340.490663
470.0017670.0280.488825
48-0.002876-0.04570.481812

\begin{tabular}{lllllllll}
\hline
Partial Autocorrelation Function \tabularnewline
Time lag k & PACF(k) & T-STAT & P-value \tabularnewline
1 & 0.988911 & 15.6985 & 0 \tabularnewline
2 & -0.000234 & -0.0037 & 0.498516 \tabularnewline
3 & -0.009851 & -0.1564 & 0.437932 \tabularnewline
4 & -0.015261 & -0.2423 & 0.404388 \tabularnewline
5 & -0.034776 & -0.552 & 0.290703 \tabularnewline
6 & -0.030712 & -0.4875 & 0.313152 \tabularnewline
7 & -0.023824 & -0.3782 & 0.352801 \tabularnewline
8 & -0.009501 & -0.1508 & 0.440115 \tabularnewline
9 & -0.017773 & -0.2821 & 0.389037 \tabularnewline
10 & -0.008478 & -0.1346 & 0.446524 \tabularnewline
11 & -0.001636 & -0.026 & 0.489649 \tabularnewline
12 & -0.005128 & -0.0814 & 0.467592 \tabularnewline
13 & -0.004148 & -0.0658 & 0.473778 \tabularnewline
14 & -0.000694 & -0.011 & 0.49561 \tabularnewline
15 & -0.00922 & -0.1464 & 0.441878 \tabularnewline
16 & -0.008341 & -0.1324 & 0.447382 \tabularnewline
17 & 0.002369 & 0.0376 & 0.485014 \tabularnewline
18 & -0.006588 & -0.1046 & 0.458397 \tabularnewline
19 & -0.003376 & -0.0536 & 0.478649 \tabularnewline
20 & -0.010562 & -0.1677 & 0.43349 \tabularnewline
21 & -0.002738 & -0.0435 & 0.48268 \tabularnewline
22 & -0.004771 & -0.0757 & 0.469846 \tabularnewline
23 & -0.005798 & -0.092 & 0.463368 \tabularnewline
24 & -0.001844 & -0.0293 & 0.488337 \tabularnewline
25 & -0.00514 & -0.0816 & 0.467515 \tabularnewline
26 & -0.004572 & -0.0726 & 0.471097 \tabularnewline
27 & 0.003024 & 0.048 & 0.480878 \tabularnewline
28 & -0.008274 & -0.1314 & 0.447801 \tabularnewline
29 & -0.012124 & -0.1925 & 0.423768 \tabularnewline
30 & -0.016442 & -0.261 & 0.39715 \tabularnewline
31 & -0.008992 & -0.1427 & 0.443306 \tabularnewline
32 & -0.007347 & -0.1166 & 0.453621 \tabularnewline
33 & -0.001425 & -0.0226 & 0.490986 \tabularnewline
34 & -0.007505 & -0.1191 & 0.452632 \tabularnewline
35 & -0.015919 & -0.2527 & 0.400348 \tabularnewline
36 & -0.006301 & -0.1 & 0.460205 \tabularnewline
37 & -0.019207 & -0.3049 & 0.380349 \tabularnewline
38 & -0.006771 & -0.1075 & 0.457243 \tabularnewline
39 & -0.014165 & -0.2249 & 0.411134 \tabularnewline
40 & 0.009843 & 0.1562 & 0.437983 \tabularnewline
41 & -0.010465 & -0.1661 & 0.434092 \tabularnewline
42 & 0.004192 & 0.0665 & 0.4735 \tabularnewline
43 & 0.000153 & 0.0024 & 0.499035 \tabularnewline
44 & -0.009732 & -0.1545 & 0.438671 \tabularnewline
45 & -0.011622 & -0.1845 & 0.42689 \tabularnewline
46 & 0.001476 & 0.0234 & 0.490663 \tabularnewline
47 & 0.001767 & 0.028 & 0.488825 \tabularnewline
48 & -0.002876 & -0.0457 & 0.481812 \tabularnewline
\hline
\end{tabular}
%Source: https://freestatistics.org/blog/index.php?pk=75540&T=2

[TABLE]
[ROW][C]Partial Autocorrelation Function[/C][/ROW]
[ROW][C]Time lag k[/C][C]PACF(k)[/C][C]T-STAT[/C][C]P-value[/C][/ROW]
[ROW][C]1[/C][C]0.988911[/C][C]15.6985[/C][C]0[/C][/ROW]
[ROW][C]2[/C][C]-0.000234[/C][C]-0.0037[/C][C]0.498516[/C][/ROW]
[ROW][C]3[/C][C]-0.009851[/C][C]-0.1564[/C][C]0.437932[/C][/ROW]
[ROW][C]4[/C][C]-0.015261[/C][C]-0.2423[/C][C]0.404388[/C][/ROW]
[ROW][C]5[/C][C]-0.034776[/C][C]-0.552[/C][C]0.290703[/C][/ROW]
[ROW][C]6[/C][C]-0.030712[/C][C]-0.4875[/C][C]0.313152[/C][/ROW]
[ROW][C]7[/C][C]-0.023824[/C][C]-0.3782[/C][C]0.352801[/C][/ROW]
[ROW][C]8[/C][C]-0.009501[/C][C]-0.1508[/C][C]0.440115[/C][/ROW]
[ROW][C]9[/C][C]-0.017773[/C][C]-0.2821[/C][C]0.389037[/C][/ROW]
[ROW][C]10[/C][C]-0.008478[/C][C]-0.1346[/C][C]0.446524[/C][/ROW]
[ROW][C]11[/C][C]-0.001636[/C][C]-0.026[/C][C]0.489649[/C][/ROW]
[ROW][C]12[/C][C]-0.005128[/C][C]-0.0814[/C][C]0.467592[/C][/ROW]
[ROW][C]13[/C][C]-0.004148[/C][C]-0.0658[/C][C]0.473778[/C][/ROW]
[ROW][C]14[/C][C]-0.000694[/C][C]-0.011[/C][C]0.49561[/C][/ROW]
[ROW][C]15[/C][C]-0.00922[/C][C]-0.1464[/C][C]0.441878[/C][/ROW]
[ROW][C]16[/C][C]-0.008341[/C][C]-0.1324[/C][C]0.447382[/C][/ROW]
[ROW][C]17[/C][C]0.002369[/C][C]0.0376[/C][C]0.485014[/C][/ROW]
[ROW][C]18[/C][C]-0.006588[/C][C]-0.1046[/C][C]0.458397[/C][/ROW]
[ROW][C]19[/C][C]-0.003376[/C][C]-0.0536[/C][C]0.478649[/C][/ROW]
[ROW][C]20[/C][C]-0.010562[/C][C]-0.1677[/C][C]0.43349[/C][/ROW]
[ROW][C]21[/C][C]-0.002738[/C][C]-0.0435[/C][C]0.48268[/C][/ROW]
[ROW][C]22[/C][C]-0.004771[/C][C]-0.0757[/C][C]0.469846[/C][/ROW]
[ROW][C]23[/C][C]-0.005798[/C][C]-0.092[/C][C]0.463368[/C][/ROW]
[ROW][C]24[/C][C]-0.001844[/C][C]-0.0293[/C][C]0.488337[/C][/ROW]
[ROW][C]25[/C][C]-0.00514[/C][C]-0.0816[/C][C]0.467515[/C][/ROW]
[ROW][C]26[/C][C]-0.004572[/C][C]-0.0726[/C][C]0.471097[/C][/ROW]
[ROW][C]27[/C][C]0.003024[/C][C]0.048[/C][C]0.480878[/C][/ROW]
[ROW][C]28[/C][C]-0.008274[/C][C]-0.1314[/C][C]0.447801[/C][/ROW]
[ROW][C]29[/C][C]-0.012124[/C][C]-0.1925[/C][C]0.423768[/C][/ROW]
[ROW][C]30[/C][C]-0.016442[/C][C]-0.261[/C][C]0.39715[/C][/ROW]
[ROW][C]31[/C][C]-0.008992[/C][C]-0.1427[/C][C]0.443306[/C][/ROW]
[ROW][C]32[/C][C]-0.007347[/C][C]-0.1166[/C][C]0.453621[/C][/ROW]
[ROW][C]33[/C][C]-0.001425[/C][C]-0.0226[/C][C]0.490986[/C][/ROW]
[ROW][C]34[/C][C]-0.007505[/C][C]-0.1191[/C][C]0.452632[/C][/ROW]
[ROW][C]35[/C][C]-0.015919[/C][C]-0.2527[/C][C]0.400348[/C][/ROW]
[ROW][C]36[/C][C]-0.006301[/C][C]-0.1[/C][C]0.460205[/C][/ROW]
[ROW][C]37[/C][C]-0.019207[/C][C]-0.3049[/C][C]0.380349[/C][/ROW]
[ROW][C]38[/C][C]-0.006771[/C][C]-0.1075[/C][C]0.457243[/C][/ROW]
[ROW][C]39[/C][C]-0.014165[/C][C]-0.2249[/C][C]0.411134[/C][/ROW]
[ROW][C]40[/C][C]0.009843[/C][C]0.1562[/C][C]0.437983[/C][/ROW]
[ROW][C]41[/C][C]-0.010465[/C][C]-0.1661[/C][C]0.434092[/C][/ROW]
[ROW][C]42[/C][C]0.004192[/C][C]0.0665[/C][C]0.4735[/C][/ROW]
[ROW][C]43[/C][C]0.000153[/C][C]0.0024[/C][C]0.499035[/C][/ROW]
[ROW][C]44[/C][C]-0.009732[/C][C]-0.1545[/C][C]0.438671[/C][/ROW]
[ROW][C]45[/C][C]-0.011622[/C][C]-0.1845[/C][C]0.42689[/C][/ROW]
[ROW][C]46[/C][C]0.001476[/C][C]0.0234[/C][C]0.490663[/C][/ROW]
[ROW][C]47[/C][C]0.001767[/C][C]0.028[/C][C]0.488825[/C][/ROW]
[ROW][C]48[/C][C]-0.002876[/C][C]-0.0457[/C][C]0.481812[/C][/ROW]
[/TABLE]
Source: https://freestatistics.org/blog/index.php?pk=75540&T=2

Globally Unique Identifier (entire table): ba.freestatistics.org/blog/index.php?pk=75540&T=2

As an alternative you can also use a QR Code:  

The GUIDs for individual cells are displayed in the table below:

Partial Autocorrelation Function
Time lag kPACF(k)T-STATP-value
10.98891115.69850
2-0.000234-0.00370.498516
3-0.009851-0.15640.437932
4-0.015261-0.24230.404388
5-0.034776-0.5520.290703
6-0.030712-0.48750.313152
7-0.023824-0.37820.352801
8-0.009501-0.15080.440115
9-0.017773-0.28210.389037
10-0.008478-0.13460.446524
11-0.001636-0.0260.489649
12-0.005128-0.08140.467592
13-0.004148-0.06580.473778
14-0.000694-0.0110.49561
15-0.00922-0.14640.441878
16-0.008341-0.13240.447382
170.0023690.03760.485014
18-0.006588-0.10460.458397
19-0.003376-0.05360.478649
20-0.010562-0.16770.43349
21-0.002738-0.04350.48268
22-0.004771-0.07570.469846
23-0.005798-0.0920.463368
24-0.001844-0.02930.488337
25-0.00514-0.08160.467515
26-0.004572-0.07260.471097
270.0030240.0480.480878
28-0.008274-0.13140.447801
29-0.012124-0.19250.423768
30-0.016442-0.2610.39715
31-0.008992-0.14270.443306
32-0.007347-0.11660.453621
33-0.001425-0.02260.490986
34-0.007505-0.11910.452632
35-0.015919-0.25270.400348
36-0.006301-0.10.460205
37-0.019207-0.30490.380349
38-0.006771-0.10750.457243
39-0.014165-0.22490.411134
400.0098430.15620.437983
41-0.010465-0.16610.434092
420.0041920.06650.4735
430.0001530.00240.499035
44-0.009732-0.15450.438671
45-0.011622-0.18450.42689
460.0014760.02340.490663
470.0017670.0280.488825
48-0.002876-0.04570.481812


Parameters (Session):
par1 = 48 ; par2 = 1 ; par3 = 0 ; par4 = 0 ; par5 = 12 ; par6 = White Noise ; par7 = 0.95 ;
Parameters (R input):
par1 = 48 ; par2 = 1 ; par3 = 0 ; par4 = 0 ; par5 = 12 ; par6 = White Noise ; par7 = 0.95 ;
R code (references can be found in the software module):
if (par1 == 'Default') {
par1 = 10*log10(length(x))
} else {
par1 <- as.numeric(par1)
}
par2 <- as.numeric(par2)
par3 <- as.numeric(par3)
par4 <- as.numeric(par4)
par5 <- as.numeric(par5)
if (par6 == 'White Noise') par6 <- 'white' else par6 <- 'ma'
par7 <- as.numeric(par7)
if (par2 == 0) {
x <- log(x)
} else {
x <- (x ^ par2 - 1) / par2
}
if (par3 > 0) x <- diff(x,lag=1,difference=par3)
if (par4 > 0) x <- diff(x,lag=par5,difference=par4)
bitmap(file='pic1.png')
racf <- acf(x, par1, main='Autocorrelation', xlab='time lag', ylab='ACF', ci.type=par6, ci=par7, sub=paste('(lambda=',par2,', d=',par3,', D=',par4,', CI=', par7, ', CI type=',par6,')',sep=''))
dev.off()
bitmap(file='pic2.png')
rpacf <- pacf(x,par1,main='Partial Autocorrelation',xlab='lags',ylab='PACF')
dev.off()
(myacf <- c(racf$acf))
(mypacf <- c(rpacf$acf))
lengthx <- length(x)
sqrtn <- sqrt(lengthx)
load(file='createtable')
a<-table.start()
a<-table.row.start(a)
a<-table.element(a,'Autocorrelation Function',4,TRUE)
a<-table.row.end(a)
a<-table.row.start(a)
a<-table.element(a,'Time lag k',header=TRUE)
a<-table.element(a,hyperlink('basics.htm','ACF(k)','click here for more information about the Autocorrelation Function'),header=TRUE)
a<-table.element(a,'T-STAT',header=TRUE)
a<-table.element(a,'P-value',header=TRUE)
a<-table.row.end(a)
for (i in 2:(par1+1)) {
a<-table.row.start(a)
a<-table.element(a,i-1,header=TRUE)
a<-table.element(a,round(myacf[i],6))
mytstat <- myacf[i]*sqrtn
a<-table.element(a,round(mytstat,4))
a<-table.element(a,round(1-pt(abs(mytstat),lengthx),6))
a<-table.row.end(a)
}
a<-table.end(a)
table.save(a,file='mytable.tab')
a<-table.start()
a<-table.row.start(a)
a<-table.element(a,'Partial Autocorrelation Function',4,TRUE)
a<-table.row.end(a)
a<-table.row.start(a)
a<-table.element(a,'Time lag k',header=TRUE)
a<-table.element(a,hyperlink('basics.htm','PACF(k)','click here for more information about the Partial Autocorrelation Function'),header=TRUE)
a<-table.element(a,'T-STAT',header=TRUE)
a<-table.element(a,'P-value',header=TRUE)
a<-table.row.end(a)
for (i in 1:par1) {
a<-table.row.start(a)
a<-table.element(a,i,header=TRUE)
a<-table.element(a,round(mypacf[i],6))
mytstat <- mypacf[i]*sqrtn
a<-table.element(a,round(mytstat,4))
a<-table.element(a,round(1-pt(abs(mytstat),lengthx),6))
a<-table.row.end(a)
}
a<-table.end(a)
table.save(a,file='mytable1.tab')