Free Statistics

of Irreproducible Research!

Author's title

Author*Unverified author*
R Software Modulerwasp_autocorrelation.wasp
Title produced by software(Partial) Autocorrelation Function
Date of computationWed, 05 May 2010 15:42:58 +0000
Cite this page as followsStatistical Computations at FreeStatistics.org, Office for Research Development and Education, URL https://freestatistics.org/blog/index.php?v=date/2010/May/05/t12730742218kqc1urw54fic3i.htm/, Retrieved Sun, 28 Apr 2024 16:57:09 +0000
Statistical Computations at FreeStatistics.org, Office for Research Development and Education, URL https://freestatistics.org/blog/index.php?pk=75541, Retrieved Sun, 28 Apr 2024 16:57:09 +0000
QR Codes:

Original text written by user:
IsPrivate?No (this computation is public)
User-defined keywordsKDGP2W21
Estimated Impact153
Family? (F = Feedback message, R = changed R code, M = changed R Module, P = changed Parameters, D = changed Data)
-     [(Partial) Autocorrelation Function] [] [2010-05-05 15:17:25] [c6ebbe7a5fe9990667cad80722534846]
-    D  [(Partial) Autocorrelation Function] [] [2010-05-05 15:38:59] [c6ebbe7a5fe9990667cad80722534846]
-   P       [(Partial) Autocorrelation Function] [] [2010-05-05 15:42:58] [34252ed26d999a27212450e9b83760c6] [Current]
Feedback Forum

Post a new message
Dataseries X:
1772.2
1769.5
1768
1794.8
1823.4
1856.9
1866.9
1869.8
1843.8
1837.1
1857.7
1840.3
1914.6
1972.9
2050.1
2086.2
2112.5
2147.6
2190.4
2194.1
2216.2
2218.6
2233.5
2307.2
2350.4
2368.2
2353.8
2316.5
2305.5
2308.4
2334.4
2381.2
2449.7
2490.3
2523.5
2537.6
2526.1
2545.9
2542.7
2584.3
2600.2
2593.9
2618.9
2591.3
2521.2
2536.6
2596.1
2656.6
2710.3
2778.8
2775.5
2785.2
2847.7
2834.4
2839
2802.6
2819.3
2872
2918.4
2977.8
3031.2
3064.7
3093
3100.6
3141.1
3180.4
3240.3
3265
3338.2
3376.6
3422.5
3432
3516.3
3564
3636.3
3724
3815.4
3828.1
3853.3
3884.5
3918.7
3919.6
3950.8
3981
4063
4132
4160.3
4178.3
4244.1
4256.5
4283.4
4263.3
4256.6
4264.3
4302.3
4256.6
4374
4398.8
4433.9
4446.3
4525.8
4633.1
4677.5
4754.5
4876.2
4932.6
4906.3
4953.1
4909.6
4922.2
4873.5
4854.3
4795.3
4831.9
4913.3
4977.5
5090.7
5128.9
5154.1
5191.5
5251.8
5356.1
5451.9
5450.8
5469.4
5684.6
5740.3
5816.2
5825.9
5831.4
5873.3
5889.5
5908.5
5787.4
5776.6
5883.5
6005.7
5957.8
6030.2
5955.1
5857.3
5889.1
5866.4
5871
5944
6077.6
6197.5
6325.6
6448.3
6559.6
6623.3
6677.3
6740.3
6797.3
6903.5
6955.9
7022.8
7051
7119
7153.4
7193
7269.5
7332.6
7458
7496.6
7592.9
7632.1
7734
7806.6
7865
7927.4
7944.7
8027.7
8059.6
8059.5
7988.9
7950.2
8003.8
8037.5
8069
8157.6
8244.3
8329.4
8417
8432.5
8486.4
8531.1
8643.8
8727.9
8847.3
8904.3
9003.2
9025.3
9044.7
9120.7
9184.3
9247.2
9407.1
9488.9
9592.5
9666.2
9809.6
9932.7
10008.9
10103.4
10194.3
10328.8
10507.6
10601.2
10684
10819.9
11014.3
11043
11258.5
11267.9
11334.5
11297.2
11371.3
11340.1
11380.1
11477.9
11538.8
11596.4
11598.8
11645.8
11738.7
11935.5
12042.8
12127.6
12213.8
12303.5
12410.3
12534.1
12587.5
12683.2
12748.7
12915.9
12962.5
12965.9
13060.7
13099.9
13204
13321.1
13391.2
13366.9
13415.3
13324.6
13141.9
12925.4
12901.5
12973
13155


Summary of computational transaction
Raw Inputview raw input (R code)
Raw Outputview raw output of R engine
Computing time2 seconds
R Server'RServer@AstonUniversity' @ vre.aston.ac.uk

\begin{tabular}{lllllllll}
\hline
Summary of computational transaction \tabularnewline
Raw Input & view raw input (R code)  \tabularnewline
Raw Output & view raw output of R engine  \tabularnewline
Computing time & 2 seconds \tabularnewline
R Server & 'RServer@AstonUniversity' @ vre.aston.ac.uk \tabularnewline
\hline
\end{tabular}
%Source: https://freestatistics.org/blog/index.php?pk=75541&T=0

[TABLE]
[ROW][C]Summary of computational transaction[/C][/ROW]
[ROW][C]Raw Input[/C][C]view raw input (R code) [/C][/ROW]
[ROW][C]Raw Output[/C][C]view raw output of R engine [/C][/ROW]
[ROW][C]Computing time[/C][C]2 seconds[/C][/ROW]
[ROW][C]R Server[/C][C]'RServer@AstonUniversity' @ vre.aston.ac.uk[/C][/ROW]
[/TABLE]
Source: https://freestatistics.org/blog/index.php?pk=75541&T=0

Globally Unique Identifier (entire table): ba.freestatistics.org/blog/index.php?pk=75541&T=0

As an alternative you can also use a QR Code:  

The GUIDs for individual cells are displayed in the table below:

Summary of computational transaction
Raw Inputview raw input (R code)
Raw Outputview raw output of R engine
Computing time2 seconds
R Server'RServer@AstonUniversity' @ vre.aston.ac.uk


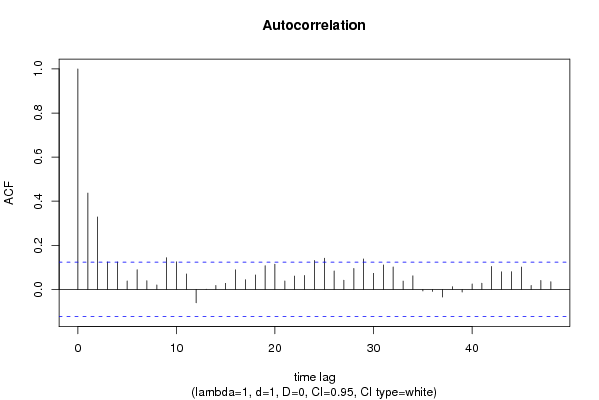
Autocorrelation Function
Time lag kACF(k)T-STATP-value
10.4368086.92030
20.3287795.20880
30.1246191.97430.02472
40.1241971.96770.025105
50.0378070.5990.274865
60.0894011.41640.078952
70.0390870.61930.268154
80.0199120.31550.376336
90.1433372.27090.012001
100.1250081.98050.024369
110.0695681.10220.135723
12-0.060738-0.96230.168419
13-2.6e-05-4e-040.499838
140.0175430.27790.390647
150.0274380.43470.332077
160.0887271.40570.080526
170.0435650.69020.245351
180.0653711.03570.150677
190.1077111.70650.044579
200.1145621.8150.035358
210.0377690.59840.275063
220.0601430.95280.170795
230.0630570.9990.159376
240.131282.07990.019276
250.1414812.24150.012935
260.0835081.3230.093517
270.0411650.65220.25744
280.0949271.50390.066929
290.1381092.18810.014794
300.0728671.15440.12471
310.1105021.75070.040611
320.101321.60520.054853
330.0377170.59750.27534
340.0613080.97130.166165
35-0.006911-0.10950.456453
36-0.009115-0.14440.442649
37-0.034663-0.54920.291688
380.0118530.18780.425598
39-0.012369-0.1960.4224
400.0242150.38360.350788
410.0278870.44180.329505
420.1035541.64060.051067
430.0795731.26070.1043
440.080161.270.102634
450.1011261.60210.055191
460.0181620.28770.38689
470.0400180.6340.263329
480.0344980.54650.292588

\begin{tabular}{lllllllll}
\hline
Autocorrelation Function \tabularnewline
Time lag k & ACF(k) & T-STAT & P-value \tabularnewline
1 & 0.436808 & 6.9203 & 0 \tabularnewline
2 & 0.328779 & 5.2088 & 0 \tabularnewline
3 & 0.124619 & 1.9743 & 0.02472 \tabularnewline
4 & 0.124197 & 1.9677 & 0.025105 \tabularnewline
5 & 0.037807 & 0.599 & 0.274865 \tabularnewline
6 & 0.089401 & 1.4164 & 0.078952 \tabularnewline
7 & 0.039087 & 0.6193 & 0.268154 \tabularnewline
8 & 0.019912 & 0.3155 & 0.376336 \tabularnewline
9 & 0.143337 & 2.2709 & 0.012001 \tabularnewline
10 & 0.125008 & 1.9805 & 0.024369 \tabularnewline
11 & 0.069568 & 1.1022 & 0.135723 \tabularnewline
12 & -0.060738 & -0.9623 & 0.168419 \tabularnewline
13 & -2.6e-05 & -4e-04 & 0.499838 \tabularnewline
14 & 0.017543 & 0.2779 & 0.390647 \tabularnewline
15 & 0.027438 & 0.4347 & 0.332077 \tabularnewline
16 & 0.088727 & 1.4057 & 0.080526 \tabularnewline
17 & 0.043565 & 0.6902 & 0.245351 \tabularnewline
18 & 0.065371 & 1.0357 & 0.150677 \tabularnewline
19 & 0.107711 & 1.7065 & 0.044579 \tabularnewline
20 & 0.114562 & 1.815 & 0.035358 \tabularnewline
21 & 0.037769 & 0.5984 & 0.275063 \tabularnewline
22 & 0.060143 & 0.9528 & 0.170795 \tabularnewline
23 & 0.063057 & 0.999 & 0.159376 \tabularnewline
24 & 0.13128 & 2.0799 & 0.019276 \tabularnewline
25 & 0.141481 & 2.2415 & 0.012935 \tabularnewline
26 & 0.083508 & 1.323 & 0.093517 \tabularnewline
27 & 0.041165 & 0.6522 & 0.25744 \tabularnewline
28 & 0.094927 & 1.5039 & 0.066929 \tabularnewline
29 & 0.138109 & 2.1881 & 0.014794 \tabularnewline
30 & 0.072867 & 1.1544 & 0.12471 \tabularnewline
31 & 0.110502 & 1.7507 & 0.040611 \tabularnewline
32 & 0.10132 & 1.6052 & 0.054853 \tabularnewline
33 & 0.037717 & 0.5975 & 0.27534 \tabularnewline
34 & 0.061308 & 0.9713 & 0.166165 \tabularnewline
35 & -0.006911 & -0.1095 & 0.456453 \tabularnewline
36 & -0.009115 & -0.1444 & 0.442649 \tabularnewline
37 & -0.034663 & -0.5492 & 0.291688 \tabularnewline
38 & 0.011853 & 0.1878 & 0.425598 \tabularnewline
39 & -0.012369 & -0.196 & 0.4224 \tabularnewline
40 & 0.024215 & 0.3836 & 0.350788 \tabularnewline
41 & 0.027887 & 0.4418 & 0.329505 \tabularnewline
42 & 0.103554 & 1.6406 & 0.051067 \tabularnewline
43 & 0.079573 & 1.2607 & 0.1043 \tabularnewline
44 & 0.08016 & 1.27 & 0.102634 \tabularnewline
45 & 0.101126 & 1.6021 & 0.055191 \tabularnewline
46 & 0.018162 & 0.2877 & 0.38689 \tabularnewline
47 & 0.040018 & 0.634 & 0.263329 \tabularnewline
48 & 0.034498 & 0.5465 & 0.292588 \tabularnewline
\hline
\end{tabular}
%Source: https://freestatistics.org/blog/index.php?pk=75541&T=1

[TABLE]
[ROW][C]Autocorrelation Function[/C][/ROW]
[ROW][C]Time lag k[/C][C]ACF(k)[/C][C]T-STAT[/C][C]P-value[/C][/ROW]
[ROW][C]1[/C][C]0.436808[/C][C]6.9203[/C][C]0[/C][/ROW]
[ROW][C]2[/C][C]0.328779[/C][C]5.2088[/C][C]0[/C][/ROW]
[ROW][C]3[/C][C]0.124619[/C][C]1.9743[/C][C]0.02472[/C][/ROW]
[ROW][C]4[/C][C]0.124197[/C][C]1.9677[/C][C]0.025105[/C][/ROW]
[ROW][C]5[/C][C]0.037807[/C][C]0.599[/C][C]0.274865[/C][/ROW]
[ROW][C]6[/C][C]0.089401[/C][C]1.4164[/C][C]0.078952[/C][/ROW]
[ROW][C]7[/C][C]0.039087[/C][C]0.6193[/C][C]0.268154[/C][/ROW]
[ROW][C]8[/C][C]0.019912[/C][C]0.3155[/C][C]0.376336[/C][/ROW]
[ROW][C]9[/C][C]0.143337[/C][C]2.2709[/C][C]0.012001[/C][/ROW]
[ROW][C]10[/C][C]0.125008[/C][C]1.9805[/C][C]0.024369[/C][/ROW]
[ROW][C]11[/C][C]0.069568[/C][C]1.1022[/C][C]0.135723[/C][/ROW]
[ROW][C]12[/C][C]-0.060738[/C][C]-0.9623[/C][C]0.168419[/C][/ROW]
[ROW][C]13[/C][C]-2.6e-05[/C][C]-4e-04[/C][C]0.499838[/C][/ROW]
[ROW][C]14[/C][C]0.017543[/C][C]0.2779[/C][C]0.390647[/C][/ROW]
[ROW][C]15[/C][C]0.027438[/C][C]0.4347[/C][C]0.332077[/C][/ROW]
[ROW][C]16[/C][C]0.088727[/C][C]1.4057[/C][C]0.080526[/C][/ROW]
[ROW][C]17[/C][C]0.043565[/C][C]0.6902[/C][C]0.245351[/C][/ROW]
[ROW][C]18[/C][C]0.065371[/C][C]1.0357[/C][C]0.150677[/C][/ROW]
[ROW][C]19[/C][C]0.107711[/C][C]1.7065[/C][C]0.044579[/C][/ROW]
[ROW][C]20[/C][C]0.114562[/C][C]1.815[/C][C]0.035358[/C][/ROW]
[ROW][C]21[/C][C]0.037769[/C][C]0.5984[/C][C]0.275063[/C][/ROW]
[ROW][C]22[/C][C]0.060143[/C][C]0.9528[/C][C]0.170795[/C][/ROW]
[ROW][C]23[/C][C]0.063057[/C][C]0.999[/C][C]0.159376[/C][/ROW]
[ROW][C]24[/C][C]0.13128[/C][C]2.0799[/C][C]0.019276[/C][/ROW]
[ROW][C]25[/C][C]0.141481[/C][C]2.2415[/C][C]0.012935[/C][/ROW]
[ROW][C]26[/C][C]0.083508[/C][C]1.323[/C][C]0.093517[/C][/ROW]
[ROW][C]27[/C][C]0.041165[/C][C]0.6522[/C][C]0.25744[/C][/ROW]
[ROW][C]28[/C][C]0.094927[/C][C]1.5039[/C][C]0.066929[/C][/ROW]
[ROW][C]29[/C][C]0.138109[/C][C]2.1881[/C][C]0.014794[/C][/ROW]
[ROW][C]30[/C][C]0.072867[/C][C]1.1544[/C][C]0.12471[/C][/ROW]
[ROW][C]31[/C][C]0.110502[/C][C]1.7507[/C][C]0.040611[/C][/ROW]
[ROW][C]32[/C][C]0.10132[/C][C]1.6052[/C][C]0.054853[/C][/ROW]
[ROW][C]33[/C][C]0.037717[/C][C]0.5975[/C][C]0.27534[/C][/ROW]
[ROW][C]34[/C][C]0.061308[/C][C]0.9713[/C][C]0.166165[/C][/ROW]
[ROW][C]35[/C][C]-0.006911[/C][C]-0.1095[/C][C]0.456453[/C][/ROW]
[ROW][C]36[/C][C]-0.009115[/C][C]-0.1444[/C][C]0.442649[/C][/ROW]
[ROW][C]37[/C][C]-0.034663[/C][C]-0.5492[/C][C]0.291688[/C][/ROW]
[ROW][C]38[/C][C]0.011853[/C][C]0.1878[/C][C]0.425598[/C][/ROW]
[ROW][C]39[/C][C]-0.012369[/C][C]-0.196[/C][C]0.4224[/C][/ROW]
[ROW][C]40[/C][C]0.024215[/C][C]0.3836[/C][C]0.350788[/C][/ROW]
[ROW][C]41[/C][C]0.027887[/C][C]0.4418[/C][C]0.329505[/C][/ROW]
[ROW][C]42[/C][C]0.103554[/C][C]1.6406[/C][C]0.051067[/C][/ROW]
[ROW][C]43[/C][C]0.079573[/C][C]1.2607[/C][C]0.1043[/C][/ROW]
[ROW][C]44[/C][C]0.08016[/C][C]1.27[/C][C]0.102634[/C][/ROW]
[ROW][C]45[/C][C]0.101126[/C][C]1.6021[/C][C]0.055191[/C][/ROW]
[ROW][C]46[/C][C]0.018162[/C][C]0.2877[/C][C]0.38689[/C][/ROW]
[ROW][C]47[/C][C]0.040018[/C][C]0.634[/C][C]0.263329[/C][/ROW]
[ROW][C]48[/C][C]0.034498[/C][C]0.5465[/C][C]0.292588[/C][/ROW]
[/TABLE]
Source: https://freestatistics.org/blog/index.php?pk=75541&T=1

Globally Unique Identifier (entire table): ba.freestatistics.org/blog/index.php?pk=75541&T=1

As an alternative you can also use a QR Code:  

The GUIDs for individual cells are displayed in the table below:

Autocorrelation Function
Time lag kACF(k)T-STATP-value
10.4368086.92030
20.3287795.20880
30.1246191.97430.02472
40.1241971.96770.025105
50.0378070.5990.274865
60.0894011.41640.078952
70.0390870.61930.268154
80.0199120.31550.376336
90.1433372.27090.012001
100.1250081.98050.024369
110.0695681.10220.135723
12-0.060738-0.96230.168419
13-2.6e-05-4e-040.499838
140.0175430.27790.390647
150.0274380.43470.332077
160.0887271.40570.080526
170.0435650.69020.245351
180.0653711.03570.150677
190.1077111.70650.044579
200.1145621.8150.035358
210.0377690.59840.275063
220.0601430.95280.170795
230.0630570.9990.159376
240.131282.07990.019276
250.1414812.24150.012935
260.0835081.3230.093517
270.0411650.65220.25744
280.0949271.50390.066929
290.1381092.18810.014794
300.0728671.15440.12471
310.1105021.75070.040611
320.101321.60520.054853
330.0377170.59750.27534
340.0613080.97130.166165
35-0.006911-0.10950.456453
36-0.009115-0.14440.442649
37-0.034663-0.54920.291688
380.0118530.18780.425598
39-0.012369-0.1960.4224
400.0242150.38360.350788
410.0278870.44180.329505
420.1035541.64060.051067
430.0795731.26070.1043
440.080161.270.102634
450.1011261.60210.055191
460.0181620.28770.38689
470.0400180.6340.263329
480.0344980.54650.292588


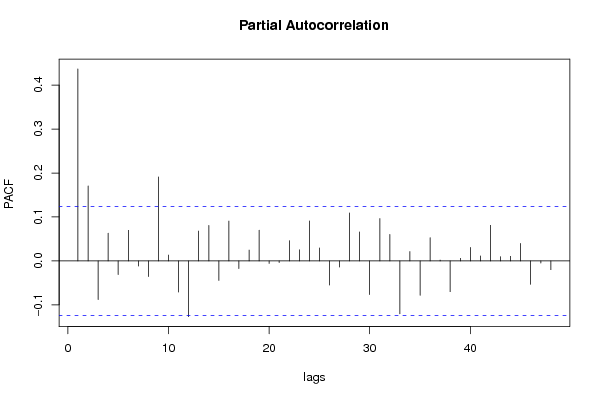
Partial Autocorrelation Function
Time lag kPACF(k)T-STATP-value
10.4368086.92030
20.1705122.70140.003688
3-0.087806-1.39110.082712
40.0628670.9960.160105
5-0.031113-0.49290.31125
60.0694841.10080.136011
7-0.011888-0.18830.425379
8-0.035535-0.5630.286975
90.1909543.02530.001371
100.0131740.20870.417422
11-0.071008-1.1250.130837
12-0.126898-2.01040.022727
130.0677981.07410.141898
140.0805671.27640.101494
15-0.044376-0.7030.24134
160.0906081.43550.076196
17-0.017401-0.27570.391512
180.0245910.38960.348582
190.0698911.10730.134616
20-0.005707-0.09040.464016
21-0.003737-0.05920.47642
220.0459580.72810.233614
230.0250830.39740.345708
240.0907241.43730.075934
250.0292550.46350.321709
26-0.055129-0.87340.191636
27-0.013819-0.21890.413442
280.1088941.72520.042861
290.0658921.04390.148762
30-0.076527-1.21240.113245
310.09621.52410.064372
320.0601250.95260.170865
33-0.12019-1.90420.029016
340.0211660.33530.368824
35-0.078458-1.2430.107512
360.0526970.83490.202289
370.0018490.02930.488329
38-0.069969-1.10850.134351
390.0057860.09170.46352
400.0307180.48670.313459
410.0110660.17530.430483
420.0808311.28060.100759
430.0095150.15070.440148
440.0103880.16460.434704
450.0396470.62810.265246
46-0.053381-0.84570.199259
47-0.004822-0.07640.469585
48-0.019958-0.31620.376056

\begin{tabular}{lllllllll}
\hline
Partial Autocorrelation Function \tabularnewline
Time lag k & PACF(k) & T-STAT & P-value \tabularnewline
1 & 0.436808 & 6.9203 & 0 \tabularnewline
2 & 0.170512 & 2.7014 & 0.003688 \tabularnewline
3 & -0.087806 & -1.3911 & 0.082712 \tabularnewline
4 & 0.062867 & 0.996 & 0.160105 \tabularnewline
5 & -0.031113 & -0.4929 & 0.31125 \tabularnewline
6 & 0.069484 & 1.1008 & 0.136011 \tabularnewline
7 & -0.011888 & -0.1883 & 0.425379 \tabularnewline
8 & -0.035535 & -0.563 & 0.286975 \tabularnewline
9 & 0.190954 & 3.0253 & 0.001371 \tabularnewline
10 & 0.013174 & 0.2087 & 0.417422 \tabularnewline
11 & -0.071008 & -1.125 & 0.130837 \tabularnewline
12 & -0.126898 & -2.0104 & 0.022727 \tabularnewline
13 & 0.067798 & 1.0741 & 0.141898 \tabularnewline
14 & 0.080567 & 1.2764 & 0.101494 \tabularnewline
15 & -0.044376 & -0.703 & 0.24134 \tabularnewline
16 & 0.090608 & 1.4355 & 0.076196 \tabularnewline
17 & -0.017401 & -0.2757 & 0.391512 \tabularnewline
18 & 0.024591 & 0.3896 & 0.348582 \tabularnewline
19 & 0.069891 & 1.1073 & 0.134616 \tabularnewline
20 & -0.005707 & -0.0904 & 0.464016 \tabularnewline
21 & -0.003737 & -0.0592 & 0.47642 \tabularnewline
22 & 0.045958 & 0.7281 & 0.233614 \tabularnewline
23 & 0.025083 & 0.3974 & 0.345708 \tabularnewline
24 & 0.090724 & 1.4373 & 0.075934 \tabularnewline
25 & 0.029255 & 0.4635 & 0.321709 \tabularnewline
26 & -0.055129 & -0.8734 & 0.191636 \tabularnewline
27 & -0.013819 & -0.2189 & 0.413442 \tabularnewline
28 & 0.108894 & 1.7252 & 0.042861 \tabularnewline
29 & 0.065892 & 1.0439 & 0.148762 \tabularnewline
30 & -0.076527 & -1.2124 & 0.113245 \tabularnewline
31 & 0.0962 & 1.5241 & 0.064372 \tabularnewline
32 & 0.060125 & 0.9526 & 0.170865 \tabularnewline
33 & -0.12019 & -1.9042 & 0.029016 \tabularnewline
34 & 0.021166 & 0.3353 & 0.368824 \tabularnewline
35 & -0.078458 & -1.243 & 0.107512 \tabularnewline
36 & 0.052697 & 0.8349 & 0.202289 \tabularnewline
37 & 0.001849 & 0.0293 & 0.488329 \tabularnewline
38 & -0.069969 & -1.1085 & 0.134351 \tabularnewline
39 & 0.005786 & 0.0917 & 0.46352 \tabularnewline
40 & 0.030718 & 0.4867 & 0.313459 \tabularnewline
41 & 0.011066 & 0.1753 & 0.430483 \tabularnewline
42 & 0.080831 & 1.2806 & 0.100759 \tabularnewline
43 & 0.009515 & 0.1507 & 0.440148 \tabularnewline
44 & 0.010388 & 0.1646 & 0.434704 \tabularnewline
45 & 0.039647 & 0.6281 & 0.265246 \tabularnewline
46 & -0.053381 & -0.8457 & 0.199259 \tabularnewline
47 & -0.004822 & -0.0764 & 0.469585 \tabularnewline
48 & -0.019958 & -0.3162 & 0.376056 \tabularnewline
\hline
\end{tabular}
%Source: https://freestatistics.org/blog/index.php?pk=75541&T=2

[TABLE]
[ROW][C]Partial Autocorrelation Function[/C][/ROW]
[ROW][C]Time lag k[/C][C]PACF(k)[/C][C]T-STAT[/C][C]P-value[/C][/ROW]
[ROW][C]1[/C][C]0.436808[/C][C]6.9203[/C][C]0[/C][/ROW]
[ROW][C]2[/C][C]0.170512[/C][C]2.7014[/C][C]0.003688[/C][/ROW]
[ROW][C]3[/C][C]-0.087806[/C][C]-1.3911[/C][C]0.082712[/C][/ROW]
[ROW][C]4[/C][C]0.062867[/C][C]0.996[/C][C]0.160105[/C][/ROW]
[ROW][C]5[/C][C]-0.031113[/C][C]-0.4929[/C][C]0.31125[/C][/ROW]
[ROW][C]6[/C][C]0.069484[/C][C]1.1008[/C][C]0.136011[/C][/ROW]
[ROW][C]7[/C][C]-0.011888[/C][C]-0.1883[/C][C]0.425379[/C][/ROW]
[ROW][C]8[/C][C]-0.035535[/C][C]-0.563[/C][C]0.286975[/C][/ROW]
[ROW][C]9[/C][C]0.190954[/C][C]3.0253[/C][C]0.001371[/C][/ROW]
[ROW][C]10[/C][C]0.013174[/C][C]0.2087[/C][C]0.417422[/C][/ROW]
[ROW][C]11[/C][C]-0.071008[/C][C]-1.125[/C][C]0.130837[/C][/ROW]
[ROW][C]12[/C][C]-0.126898[/C][C]-2.0104[/C][C]0.022727[/C][/ROW]
[ROW][C]13[/C][C]0.067798[/C][C]1.0741[/C][C]0.141898[/C][/ROW]
[ROW][C]14[/C][C]0.080567[/C][C]1.2764[/C][C]0.101494[/C][/ROW]
[ROW][C]15[/C][C]-0.044376[/C][C]-0.703[/C][C]0.24134[/C][/ROW]
[ROW][C]16[/C][C]0.090608[/C][C]1.4355[/C][C]0.076196[/C][/ROW]
[ROW][C]17[/C][C]-0.017401[/C][C]-0.2757[/C][C]0.391512[/C][/ROW]
[ROW][C]18[/C][C]0.024591[/C][C]0.3896[/C][C]0.348582[/C][/ROW]
[ROW][C]19[/C][C]0.069891[/C][C]1.1073[/C][C]0.134616[/C][/ROW]
[ROW][C]20[/C][C]-0.005707[/C][C]-0.0904[/C][C]0.464016[/C][/ROW]
[ROW][C]21[/C][C]-0.003737[/C][C]-0.0592[/C][C]0.47642[/C][/ROW]
[ROW][C]22[/C][C]0.045958[/C][C]0.7281[/C][C]0.233614[/C][/ROW]
[ROW][C]23[/C][C]0.025083[/C][C]0.3974[/C][C]0.345708[/C][/ROW]
[ROW][C]24[/C][C]0.090724[/C][C]1.4373[/C][C]0.075934[/C][/ROW]
[ROW][C]25[/C][C]0.029255[/C][C]0.4635[/C][C]0.321709[/C][/ROW]
[ROW][C]26[/C][C]-0.055129[/C][C]-0.8734[/C][C]0.191636[/C][/ROW]
[ROW][C]27[/C][C]-0.013819[/C][C]-0.2189[/C][C]0.413442[/C][/ROW]
[ROW][C]28[/C][C]0.108894[/C][C]1.7252[/C][C]0.042861[/C][/ROW]
[ROW][C]29[/C][C]0.065892[/C][C]1.0439[/C][C]0.148762[/C][/ROW]
[ROW][C]30[/C][C]-0.076527[/C][C]-1.2124[/C][C]0.113245[/C][/ROW]
[ROW][C]31[/C][C]0.0962[/C][C]1.5241[/C][C]0.064372[/C][/ROW]
[ROW][C]32[/C][C]0.060125[/C][C]0.9526[/C][C]0.170865[/C][/ROW]
[ROW][C]33[/C][C]-0.12019[/C][C]-1.9042[/C][C]0.029016[/C][/ROW]
[ROW][C]34[/C][C]0.021166[/C][C]0.3353[/C][C]0.368824[/C][/ROW]
[ROW][C]35[/C][C]-0.078458[/C][C]-1.243[/C][C]0.107512[/C][/ROW]
[ROW][C]36[/C][C]0.052697[/C][C]0.8349[/C][C]0.202289[/C][/ROW]
[ROW][C]37[/C][C]0.001849[/C][C]0.0293[/C][C]0.488329[/C][/ROW]
[ROW][C]38[/C][C]-0.069969[/C][C]-1.1085[/C][C]0.134351[/C][/ROW]
[ROW][C]39[/C][C]0.005786[/C][C]0.0917[/C][C]0.46352[/C][/ROW]
[ROW][C]40[/C][C]0.030718[/C][C]0.4867[/C][C]0.313459[/C][/ROW]
[ROW][C]41[/C][C]0.011066[/C][C]0.1753[/C][C]0.430483[/C][/ROW]
[ROW][C]42[/C][C]0.080831[/C][C]1.2806[/C][C]0.100759[/C][/ROW]
[ROW][C]43[/C][C]0.009515[/C][C]0.1507[/C][C]0.440148[/C][/ROW]
[ROW][C]44[/C][C]0.010388[/C][C]0.1646[/C][C]0.434704[/C][/ROW]
[ROW][C]45[/C][C]0.039647[/C][C]0.6281[/C][C]0.265246[/C][/ROW]
[ROW][C]46[/C][C]-0.053381[/C][C]-0.8457[/C][C]0.199259[/C][/ROW]
[ROW][C]47[/C][C]-0.004822[/C][C]-0.0764[/C][C]0.469585[/C][/ROW]
[ROW][C]48[/C][C]-0.019958[/C][C]-0.3162[/C][C]0.376056[/C][/ROW]
[/TABLE]
Source: https://freestatistics.org/blog/index.php?pk=75541&T=2

Globally Unique Identifier (entire table): ba.freestatistics.org/blog/index.php?pk=75541&T=2

As an alternative you can also use a QR Code:  

The GUIDs for individual cells are displayed in the table below:

Partial Autocorrelation Function
Time lag kPACF(k)T-STATP-value
10.4368086.92030
20.1705122.70140.003688
3-0.087806-1.39110.082712
40.0628670.9960.160105
5-0.031113-0.49290.31125
60.0694841.10080.136011
7-0.011888-0.18830.425379
8-0.035535-0.5630.286975
90.1909543.02530.001371
100.0131740.20870.417422
11-0.071008-1.1250.130837
12-0.126898-2.01040.022727
130.0677981.07410.141898
140.0805671.27640.101494
15-0.044376-0.7030.24134
160.0906081.43550.076196
17-0.017401-0.27570.391512
180.0245910.38960.348582
190.0698911.10730.134616
20-0.005707-0.09040.464016
21-0.003737-0.05920.47642
220.0459580.72810.233614
230.0250830.39740.345708
240.0907241.43730.075934
250.0292550.46350.321709
26-0.055129-0.87340.191636
27-0.013819-0.21890.413442
280.1088941.72520.042861
290.0658921.04390.148762
30-0.076527-1.21240.113245
310.09621.52410.064372
320.0601250.95260.170865
33-0.12019-1.90420.029016
340.0211660.33530.368824
35-0.078458-1.2430.107512
360.0526970.83490.202289
370.0018490.02930.488329
38-0.069969-1.10850.134351
390.0057860.09170.46352
400.0307180.48670.313459
410.0110660.17530.430483
420.0808311.28060.100759
430.0095150.15070.440148
440.0103880.16460.434704
450.0396470.62810.265246
46-0.053381-0.84570.199259
47-0.004822-0.07640.469585
48-0.019958-0.31620.376056


Parameters (Session):
par1 = 48 ; par2 = 1 ; par3 = 1 ; par4 = 0 ; par5 = 12 ; par6 = White Noise ; par7 = 0.95 ;
Parameters (R input):
par1 = 48 ; par2 = 1 ; par3 = 1 ; par4 = 0 ; par5 = 12 ; par6 = White Noise ; par7 = 0.95 ;
R code (references can be found in the software module):
if (par1 == 'Default') {
par1 = 10*log10(length(x))
} else {
par1 <- as.numeric(par1)
}
par2 <- as.numeric(par2)
par3 <- as.numeric(par3)
par4 <- as.numeric(par4)
par5 <- as.numeric(par5)
if (par6 == 'White Noise') par6 <- 'white' else par6 <- 'ma'
par7 <- as.numeric(par7)
if (par2 == 0) {
x <- log(x)
} else {
x <- (x ^ par2 - 1) / par2
}
if (par3 > 0) x <- diff(x,lag=1,difference=par3)
if (par4 > 0) x <- diff(x,lag=par5,difference=par4)
bitmap(file='pic1.png')
racf <- acf(x, par1, main='Autocorrelation', xlab='time lag', ylab='ACF', ci.type=par6, ci=par7, sub=paste('(lambda=',par2,', d=',par3,', D=',par4,', CI=', par7, ', CI type=',par6,')',sep=''))
dev.off()
bitmap(file='pic2.png')
rpacf <- pacf(x,par1,main='Partial Autocorrelation',xlab='lags',ylab='PACF')
dev.off()
(myacf <- c(racf$acf))
(mypacf <- c(rpacf$acf))
lengthx <- length(x)
sqrtn <- sqrt(lengthx)
load(file='createtable')
a<-table.start()
a<-table.row.start(a)
a<-table.element(a,'Autocorrelation Function',4,TRUE)
a<-table.row.end(a)
a<-table.row.start(a)
a<-table.element(a,'Time lag k',header=TRUE)
a<-table.element(a,hyperlink('basics.htm','ACF(k)','click here for more information about the Autocorrelation Function'),header=TRUE)
a<-table.element(a,'T-STAT',header=TRUE)
a<-table.element(a,'P-value',header=TRUE)
a<-table.row.end(a)
for (i in 2:(par1+1)) {
a<-table.row.start(a)
a<-table.element(a,i-1,header=TRUE)
a<-table.element(a,round(myacf[i],6))
mytstat <- myacf[i]*sqrtn
a<-table.element(a,round(mytstat,4))
a<-table.element(a,round(1-pt(abs(mytstat),lengthx),6))
a<-table.row.end(a)
}
a<-table.end(a)
table.save(a,file='mytable.tab')
a<-table.start()
a<-table.row.start(a)
a<-table.element(a,'Partial Autocorrelation Function',4,TRUE)
a<-table.row.end(a)
a<-table.row.start(a)
a<-table.element(a,'Time lag k',header=TRUE)
a<-table.element(a,hyperlink('basics.htm','PACF(k)','click here for more information about the Partial Autocorrelation Function'),header=TRUE)
a<-table.element(a,'T-STAT',header=TRUE)
a<-table.element(a,'P-value',header=TRUE)
a<-table.row.end(a)
for (i in 1:par1) {
a<-table.row.start(a)
a<-table.element(a,i,header=TRUE)
a<-table.element(a,round(mypacf[i],6))
mytstat <- mypacf[i]*sqrtn
a<-table.element(a,round(mytstat,4))
a<-table.element(a,round(1-pt(abs(mytstat),lengthx),6))
a<-table.row.end(a)
}
a<-table.end(a)
table.save(a,file='mytable1.tab')