Free Statistics

of Irreproducible Research!

Author's title

Author*Unverified author*
R Software Modulerwasp_autocorrelation.wasp
Title produced by software(Partial) Autocorrelation Function
Date of computationWed, 05 May 2010 15:54:34 +0000
Cite this page as followsStatistical Computations at FreeStatistics.org, Office for Research Development and Education, URL https://freestatistics.org/blog/index.php?v=date/2010/May/05/t12730749251s6cp65d9ij2522.htm/, Retrieved Sun, 28 Apr 2024 00:12:44 +0000
Statistical Computations at FreeStatistics.org, Office for Research Development and Education, URL https://freestatistics.org/blog/index.php?pk=75545, Retrieved Sun, 28 Apr 2024 00:12:44 +0000
QR Codes:

Original text written by user:
IsPrivate?No (this computation is public)
User-defined keywordsKDGP2W21
Estimated Impact177
Family? (F = Feedback message, R = changed R code, M = changed R Module, P = changed Parameters, D = changed Data)
-       [(Partial) Autocorrelation Function] [] [2010-05-05 15:54:34] [917a4afc20628654d1f716afbd7d9cc1] [Current]
Feedback Forum

Post a new message
Dataseries X:
2953
2635
2404
2413
2136
1565
1451
2037
2477
2785
2994
2681
3098
2708
2517
2445
2087
1801
1216
2173
2286
3121
3458
3511
3524
2767
2744
2603
2527
1846
1066
2327
3066
3048
3806
4042
3583
3438
2957
2885
2744
1837
1447
2504
3248
3098
4318
3561
3316
3379
2717
2354
2445
1542
1606
2590
3588
3202
4704
4005
3810
3488
2781
2944
2817
1960
1937
2903
3357
3552
4581
3905
4581
4037
3345
3175
2808
2050
1719
3143
3756
4776
4540
4309
4563
3506
3665
3361
3094
2440
1633
2935
4159
4159
4894
4921
4577
4155
3851
3429
3370
2726


Summary of computational transaction
Raw Inputview raw input (R code)
Raw Outputview raw output of R engine
Computing time1 seconds
R Server'Sir Ronald Aylmer Fisher' @ 193.190.124.24

\begin{tabular}{lllllllll}
\hline
Summary of computational transaction \tabularnewline
Raw Input & view raw input (R code)  \tabularnewline
Raw Output & view raw output of R engine  \tabularnewline
Computing time & 1 seconds \tabularnewline
R Server & 'Sir Ronald Aylmer Fisher' @ 193.190.124.24 \tabularnewline
\hline
\end{tabular}
%Source: https://freestatistics.org/blog/index.php?pk=75545&T=0

[TABLE]
[ROW][C]Summary of computational transaction[/C][/ROW]
[ROW][C]Raw Input[/C][C]view raw input (R code) [/C][/ROW]
[ROW][C]Raw Output[/C][C]view raw output of R engine [/C][/ROW]
[ROW][C]Computing time[/C][C]1 seconds[/C][/ROW]
[ROW][C]R Server[/C][C]'Sir Ronald Aylmer Fisher' @ 193.190.124.24[/C][/ROW]
[/TABLE]
Source: https://freestatistics.org/blog/index.php?pk=75545&T=0

Globally Unique Identifier (entire table): ba.freestatistics.org/blog/index.php?pk=75545&T=0

As an alternative you can also use a QR Code:  

The GUIDs for individual cells are displayed in the table below:

Summary of computational transaction
Raw Inputview raw input (R code)
Raw Outputview raw output of R engine
Computing time1 seconds
R Server'Sir Ronald Aylmer Fisher' @ 193.190.124.24


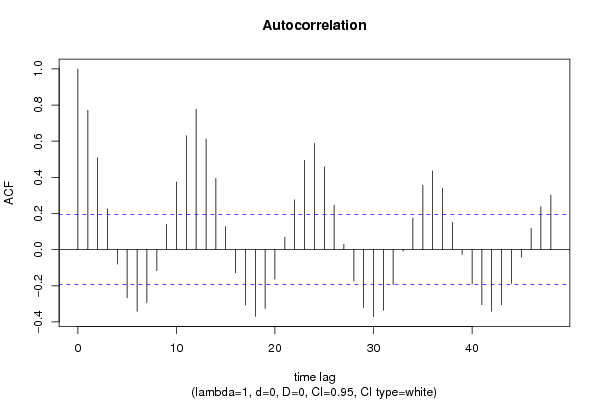
Autocorrelation Function
Time lag kACF(k)T-STATP-value
10.7713537.79030
20.5067445.11791e-06
30.2247292.26970.012666
4-0.080216-0.81010.209873
5-0.266698-2.69350.004134
6-0.340833-3.44220.000419
7-0.292766-2.95680.001931
8-0.116497-1.17660.121054
90.1404161.41810.0796
100.3741473.77870.000133
110.630366.36630
120.776397.84120
130.6113486.17430
140.3934563.97376.6e-05
150.1281191.29390.099305
16-0.128531-1.29810.098591
17-0.306087-3.09130.001285
18-0.369067-3.72740.000159
19-0.325613-3.28850.000691
20-0.162461-1.64080.051962
210.0684160.6910.245577
220.2755352.78280.003211
230.4944734.99391e-06
240.5873865.93230
250.458014.62575e-06
260.2452112.47650.007456
270.0290560.29350.384886
28-0.173655-1.75380.041232
29-0.321021-3.24220.000802
30-0.371063-3.74760.000148
31-0.335765-3.39110.000496
32-0.192911-1.94830.027063
33-0.008634-0.08720.46534
340.1744331.76170.040559
350.3559783.59520.000251
360.4354034.39741.3e-05
370.3396083.42990.000436
380.1510961.5260.065053
39-0.026388-0.26650.395195
40-0.18976-1.91650.029051
41-0.304725-3.07760.00134
42-0.341623-3.45020.000408
43-0.305615-3.08660.001304
44-0.187422-1.89290.030605
45-0.041739-0.42150.337124
460.1182991.19480.117475
470.2374892.39850.009139
480.3027983.05810.001422

\begin{tabular}{lllllllll}
\hline
Autocorrelation Function \tabularnewline
Time lag k & ACF(k) & T-STAT & P-value \tabularnewline
1 & 0.771353 & 7.7903 & 0 \tabularnewline
2 & 0.506744 & 5.1179 & 1e-06 \tabularnewline
3 & 0.224729 & 2.2697 & 0.012666 \tabularnewline
4 & -0.080216 & -0.8101 & 0.209873 \tabularnewline
5 & -0.266698 & -2.6935 & 0.004134 \tabularnewline
6 & -0.340833 & -3.4422 & 0.000419 \tabularnewline
7 & -0.292766 & -2.9568 & 0.001931 \tabularnewline
8 & -0.116497 & -1.1766 & 0.121054 \tabularnewline
9 & 0.140416 & 1.4181 & 0.0796 \tabularnewline
10 & 0.374147 & 3.7787 & 0.000133 \tabularnewline
11 & 0.63036 & 6.3663 & 0 \tabularnewline
12 & 0.77639 & 7.8412 & 0 \tabularnewline
13 & 0.611348 & 6.1743 & 0 \tabularnewline
14 & 0.393456 & 3.9737 & 6.6e-05 \tabularnewline
15 & 0.128119 & 1.2939 & 0.099305 \tabularnewline
16 & -0.128531 & -1.2981 & 0.098591 \tabularnewline
17 & -0.306087 & -3.0913 & 0.001285 \tabularnewline
18 & -0.369067 & -3.7274 & 0.000159 \tabularnewline
19 & -0.325613 & -3.2885 & 0.000691 \tabularnewline
20 & -0.162461 & -1.6408 & 0.051962 \tabularnewline
21 & 0.068416 & 0.691 & 0.245577 \tabularnewline
22 & 0.275535 & 2.7828 & 0.003211 \tabularnewline
23 & 0.494473 & 4.9939 & 1e-06 \tabularnewline
24 & 0.587386 & 5.9323 & 0 \tabularnewline
25 & 0.45801 & 4.6257 & 5e-06 \tabularnewline
26 & 0.245211 & 2.4765 & 0.007456 \tabularnewline
27 & 0.029056 & 0.2935 & 0.384886 \tabularnewline
28 & -0.173655 & -1.7538 & 0.041232 \tabularnewline
29 & -0.321021 & -3.2422 & 0.000802 \tabularnewline
30 & -0.371063 & -3.7476 & 0.000148 \tabularnewline
31 & -0.335765 & -3.3911 & 0.000496 \tabularnewline
32 & -0.192911 & -1.9483 & 0.027063 \tabularnewline
33 & -0.008634 & -0.0872 & 0.46534 \tabularnewline
34 & 0.174433 & 1.7617 & 0.040559 \tabularnewline
35 & 0.355978 & 3.5952 & 0.000251 \tabularnewline
36 & 0.435403 & 4.3974 & 1.3e-05 \tabularnewline
37 & 0.339608 & 3.4299 & 0.000436 \tabularnewline
38 & 0.151096 & 1.526 & 0.065053 \tabularnewline
39 & -0.026388 & -0.2665 & 0.395195 \tabularnewline
40 & -0.18976 & -1.9165 & 0.029051 \tabularnewline
41 & -0.304725 & -3.0776 & 0.00134 \tabularnewline
42 & -0.341623 & -3.4502 & 0.000408 \tabularnewline
43 & -0.305615 & -3.0866 & 0.001304 \tabularnewline
44 & -0.187422 & -1.8929 & 0.030605 \tabularnewline
45 & -0.041739 & -0.4215 & 0.337124 \tabularnewline
46 & 0.118299 & 1.1948 & 0.117475 \tabularnewline
47 & 0.237489 & 2.3985 & 0.009139 \tabularnewline
48 & 0.302798 & 3.0581 & 0.001422 \tabularnewline
\hline
\end{tabular}
%Source: https://freestatistics.org/blog/index.php?pk=75545&T=1

[TABLE]
[ROW][C]Autocorrelation Function[/C][/ROW]
[ROW][C]Time lag k[/C][C]ACF(k)[/C][C]T-STAT[/C][C]P-value[/C][/ROW]
[ROW][C]1[/C][C]0.771353[/C][C]7.7903[/C][C]0[/C][/ROW]
[ROW][C]2[/C][C]0.506744[/C][C]5.1179[/C][C]1e-06[/C][/ROW]
[ROW][C]3[/C][C]0.224729[/C][C]2.2697[/C][C]0.012666[/C][/ROW]
[ROW][C]4[/C][C]-0.080216[/C][C]-0.8101[/C][C]0.209873[/C][/ROW]
[ROW][C]5[/C][C]-0.266698[/C][C]-2.6935[/C][C]0.004134[/C][/ROW]
[ROW][C]6[/C][C]-0.340833[/C][C]-3.4422[/C][C]0.000419[/C][/ROW]
[ROW][C]7[/C][C]-0.292766[/C][C]-2.9568[/C][C]0.001931[/C][/ROW]
[ROW][C]8[/C][C]-0.116497[/C][C]-1.1766[/C][C]0.121054[/C][/ROW]
[ROW][C]9[/C][C]0.140416[/C][C]1.4181[/C][C]0.0796[/C][/ROW]
[ROW][C]10[/C][C]0.374147[/C][C]3.7787[/C][C]0.000133[/C][/ROW]
[ROW][C]11[/C][C]0.63036[/C][C]6.3663[/C][C]0[/C][/ROW]
[ROW][C]12[/C][C]0.77639[/C][C]7.8412[/C][C]0[/C][/ROW]
[ROW][C]13[/C][C]0.611348[/C][C]6.1743[/C][C]0[/C][/ROW]
[ROW][C]14[/C][C]0.393456[/C][C]3.9737[/C][C]6.6e-05[/C][/ROW]
[ROW][C]15[/C][C]0.128119[/C][C]1.2939[/C][C]0.099305[/C][/ROW]
[ROW][C]16[/C][C]-0.128531[/C][C]-1.2981[/C][C]0.098591[/C][/ROW]
[ROW][C]17[/C][C]-0.306087[/C][C]-3.0913[/C][C]0.001285[/C][/ROW]
[ROW][C]18[/C][C]-0.369067[/C][C]-3.7274[/C][C]0.000159[/C][/ROW]
[ROW][C]19[/C][C]-0.325613[/C][C]-3.2885[/C][C]0.000691[/C][/ROW]
[ROW][C]20[/C][C]-0.162461[/C][C]-1.6408[/C][C]0.051962[/C][/ROW]
[ROW][C]21[/C][C]0.068416[/C][C]0.691[/C][C]0.245577[/C][/ROW]
[ROW][C]22[/C][C]0.275535[/C][C]2.7828[/C][C]0.003211[/C][/ROW]
[ROW][C]23[/C][C]0.494473[/C][C]4.9939[/C][C]1e-06[/C][/ROW]
[ROW][C]24[/C][C]0.587386[/C][C]5.9323[/C][C]0[/C][/ROW]
[ROW][C]25[/C][C]0.45801[/C][C]4.6257[/C][C]5e-06[/C][/ROW]
[ROW][C]26[/C][C]0.245211[/C][C]2.4765[/C][C]0.007456[/C][/ROW]
[ROW][C]27[/C][C]0.029056[/C][C]0.2935[/C][C]0.384886[/C][/ROW]
[ROW][C]28[/C][C]-0.173655[/C][C]-1.7538[/C][C]0.041232[/C][/ROW]
[ROW][C]29[/C][C]-0.321021[/C][C]-3.2422[/C][C]0.000802[/C][/ROW]
[ROW][C]30[/C][C]-0.371063[/C][C]-3.7476[/C][C]0.000148[/C][/ROW]
[ROW][C]31[/C][C]-0.335765[/C][C]-3.3911[/C][C]0.000496[/C][/ROW]
[ROW][C]32[/C][C]-0.192911[/C][C]-1.9483[/C][C]0.027063[/C][/ROW]
[ROW][C]33[/C][C]-0.008634[/C][C]-0.0872[/C][C]0.46534[/C][/ROW]
[ROW][C]34[/C][C]0.174433[/C][C]1.7617[/C][C]0.040559[/C][/ROW]
[ROW][C]35[/C][C]0.355978[/C][C]3.5952[/C][C]0.000251[/C][/ROW]
[ROW][C]36[/C][C]0.435403[/C][C]4.3974[/C][C]1.3e-05[/C][/ROW]
[ROW][C]37[/C][C]0.339608[/C][C]3.4299[/C][C]0.000436[/C][/ROW]
[ROW][C]38[/C][C]0.151096[/C][C]1.526[/C][C]0.065053[/C][/ROW]
[ROW][C]39[/C][C]-0.026388[/C][C]-0.2665[/C][C]0.395195[/C][/ROW]
[ROW][C]40[/C][C]-0.18976[/C][C]-1.9165[/C][C]0.029051[/C][/ROW]
[ROW][C]41[/C][C]-0.304725[/C][C]-3.0776[/C][C]0.00134[/C][/ROW]
[ROW][C]42[/C][C]-0.341623[/C][C]-3.4502[/C][C]0.000408[/C][/ROW]
[ROW][C]43[/C][C]-0.305615[/C][C]-3.0866[/C][C]0.001304[/C][/ROW]
[ROW][C]44[/C][C]-0.187422[/C][C]-1.8929[/C][C]0.030605[/C][/ROW]
[ROW][C]45[/C][C]-0.041739[/C][C]-0.4215[/C][C]0.337124[/C][/ROW]
[ROW][C]46[/C][C]0.118299[/C][C]1.1948[/C][C]0.117475[/C][/ROW]
[ROW][C]47[/C][C]0.237489[/C][C]2.3985[/C][C]0.009139[/C][/ROW]
[ROW][C]48[/C][C]0.302798[/C][C]3.0581[/C][C]0.001422[/C][/ROW]
[/TABLE]
Source: https://freestatistics.org/blog/index.php?pk=75545&T=1

Globally Unique Identifier (entire table): ba.freestatistics.org/blog/index.php?pk=75545&T=1

As an alternative you can also use a QR Code:  

The GUIDs for individual cells are displayed in the table below:

Autocorrelation Function
Time lag kACF(k)T-STATP-value
10.7713537.79030
20.5067445.11791e-06
30.2247292.26970.012666
4-0.080216-0.81010.209873
5-0.266698-2.69350.004134
6-0.340833-3.44220.000419
7-0.292766-2.95680.001931
8-0.116497-1.17660.121054
90.1404161.41810.0796
100.3741473.77870.000133
110.630366.36630
120.776397.84120
130.6113486.17430
140.3934563.97376.6e-05
150.1281191.29390.099305
16-0.128531-1.29810.098591
17-0.306087-3.09130.001285
18-0.369067-3.72740.000159
19-0.325613-3.28850.000691
20-0.162461-1.64080.051962
210.0684160.6910.245577
220.2755352.78280.003211
230.4944734.99391e-06
240.5873865.93230
250.458014.62575e-06
260.2452112.47650.007456
270.0290560.29350.384886
28-0.173655-1.75380.041232
29-0.321021-3.24220.000802
30-0.371063-3.74760.000148
31-0.335765-3.39110.000496
32-0.192911-1.94830.027063
33-0.008634-0.08720.46534
340.1744331.76170.040559
350.3559783.59520.000251
360.4354034.39741.3e-05
370.3396083.42990.000436
380.1510961.5260.065053
39-0.026388-0.26650.395195
40-0.18976-1.91650.029051
41-0.304725-3.07760.00134
42-0.341623-3.45020.000408
43-0.305615-3.08660.001304
44-0.187422-1.89290.030605
45-0.041739-0.42150.337124
460.1182991.19480.117475
470.2374892.39850.009139
480.3027983.05810.001422


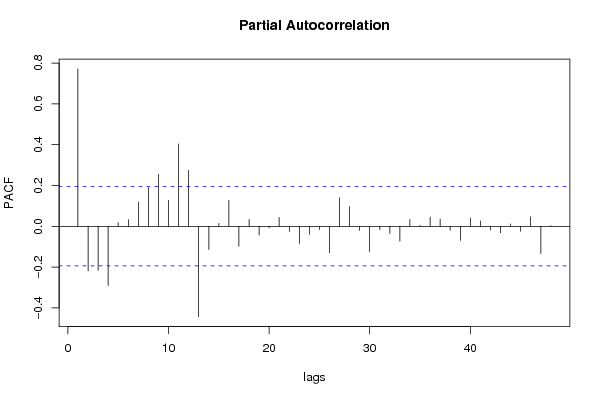
Partial Autocorrelation Function
Time lag kPACF(k)T-STATP-value
10.7713537.79030
2-0.21787-2.20040.015018
3-0.215805-2.17950.015797
4-0.289888-2.92770.002106
50.0181920.18370.427294
60.0328270.33150.370459
70.1189261.20110.116247
80.1907091.92610.02844
90.2549982.57540.005724
100.1276241.28890.100168
110.4033024.07314.6e-05
120.2743862.77120.00332
13-0.442622-4.47031e-05
14-0.113857-1.14990.126437
150.0136260.13760.445407
160.1265461.2780.102067
17-0.097157-0.98120.164399
180.0337340.34070.367016
19-0.043003-0.43430.332492
20-0.006998-0.07070.471895
210.0435640.440.330442
22-0.025277-0.25530.399509
23-0.084168-0.85010.198644
24-0.039054-0.39440.347047
25-0.015899-0.16060.436376
26-0.129399-1.30690.097098
270.1395151.4090.080934
280.0967870.97750.165316
29-0.020673-0.20880.417514
30-0.12391-1.25140.10682
31-0.016132-0.16290.43545
32-0.034872-0.35220.362711
33-0.072508-0.73230.232834
340.033670.34010.367258
350.0040320.04070.483799
360.0454390.45890.323636
370.034630.34970.363626
38-0.019709-0.19910.421308
39-0.069081-0.69770.243481
400.0395060.3990.345367
410.0266260.26890.39427
42-0.017738-0.17910.429089
43-0.030835-0.31140.378057
440.0114650.11580.454021
45-0.023485-0.23720.406495
460.0465750.47040.319542
47-0.132854-1.34180.091327
480.0028050.02830.488728

\begin{tabular}{lllllllll}
\hline
Partial Autocorrelation Function \tabularnewline
Time lag k & PACF(k) & T-STAT & P-value \tabularnewline
1 & 0.771353 & 7.7903 & 0 \tabularnewline
2 & -0.21787 & -2.2004 & 0.015018 \tabularnewline
3 & -0.215805 & -2.1795 & 0.015797 \tabularnewline
4 & -0.289888 & -2.9277 & 0.002106 \tabularnewline
5 & 0.018192 & 0.1837 & 0.427294 \tabularnewline
6 & 0.032827 & 0.3315 & 0.370459 \tabularnewline
7 & 0.118926 & 1.2011 & 0.116247 \tabularnewline
8 & 0.190709 & 1.9261 & 0.02844 \tabularnewline
9 & 0.254998 & 2.5754 & 0.005724 \tabularnewline
10 & 0.127624 & 1.2889 & 0.100168 \tabularnewline
11 & 0.403302 & 4.0731 & 4.6e-05 \tabularnewline
12 & 0.274386 & 2.7712 & 0.00332 \tabularnewline
13 & -0.442622 & -4.4703 & 1e-05 \tabularnewline
14 & -0.113857 & -1.1499 & 0.126437 \tabularnewline
15 & 0.013626 & 0.1376 & 0.445407 \tabularnewline
16 & 0.126546 & 1.278 & 0.102067 \tabularnewline
17 & -0.097157 & -0.9812 & 0.164399 \tabularnewline
18 & 0.033734 & 0.3407 & 0.367016 \tabularnewline
19 & -0.043003 & -0.4343 & 0.332492 \tabularnewline
20 & -0.006998 & -0.0707 & 0.471895 \tabularnewline
21 & 0.043564 & 0.44 & 0.330442 \tabularnewline
22 & -0.025277 & -0.2553 & 0.399509 \tabularnewline
23 & -0.084168 & -0.8501 & 0.198644 \tabularnewline
24 & -0.039054 & -0.3944 & 0.347047 \tabularnewline
25 & -0.015899 & -0.1606 & 0.436376 \tabularnewline
26 & -0.129399 & -1.3069 & 0.097098 \tabularnewline
27 & 0.139515 & 1.409 & 0.080934 \tabularnewline
28 & 0.096787 & 0.9775 & 0.165316 \tabularnewline
29 & -0.020673 & -0.2088 & 0.417514 \tabularnewline
30 & -0.12391 & -1.2514 & 0.10682 \tabularnewline
31 & -0.016132 & -0.1629 & 0.43545 \tabularnewline
32 & -0.034872 & -0.3522 & 0.362711 \tabularnewline
33 & -0.072508 & -0.7323 & 0.232834 \tabularnewline
34 & 0.03367 & 0.3401 & 0.367258 \tabularnewline
35 & 0.004032 & 0.0407 & 0.483799 \tabularnewline
36 & 0.045439 & 0.4589 & 0.323636 \tabularnewline
37 & 0.03463 & 0.3497 & 0.363626 \tabularnewline
38 & -0.019709 & -0.1991 & 0.421308 \tabularnewline
39 & -0.069081 & -0.6977 & 0.243481 \tabularnewline
40 & 0.039506 & 0.399 & 0.345367 \tabularnewline
41 & 0.026626 & 0.2689 & 0.39427 \tabularnewline
42 & -0.017738 & -0.1791 & 0.429089 \tabularnewline
43 & -0.030835 & -0.3114 & 0.378057 \tabularnewline
44 & 0.011465 & 0.1158 & 0.454021 \tabularnewline
45 & -0.023485 & -0.2372 & 0.406495 \tabularnewline
46 & 0.046575 & 0.4704 & 0.319542 \tabularnewline
47 & -0.132854 & -1.3418 & 0.091327 \tabularnewline
48 & 0.002805 & 0.0283 & 0.488728 \tabularnewline
\hline
\end{tabular}
%Source: https://freestatistics.org/blog/index.php?pk=75545&T=2

[TABLE]
[ROW][C]Partial Autocorrelation Function[/C][/ROW]
[ROW][C]Time lag k[/C][C]PACF(k)[/C][C]T-STAT[/C][C]P-value[/C][/ROW]
[ROW][C]1[/C][C]0.771353[/C][C]7.7903[/C][C]0[/C][/ROW]
[ROW][C]2[/C][C]-0.21787[/C][C]-2.2004[/C][C]0.015018[/C][/ROW]
[ROW][C]3[/C][C]-0.215805[/C][C]-2.1795[/C][C]0.015797[/C][/ROW]
[ROW][C]4[/C][C]-0.289888[/C][C]-2.9277[/C][C]0.002106[/C][/ROW]
[ROW][C]5[/C][C]0.018192[/C][C]0.1837[/C][C]0.427294[/C][/ROW]
[ROW][C]6[/C][C]0.032827[/C][C]0.3315[/C][C]0.370459[/C][/ROW]
[ROW][C]7[/C][C]0.118926[/C][C]1.2011[/C][C]0.116247[/C][/ROW]
[ROW][C]8[/C][C]0.190709[/C][C]1.9261[/C][C]0.02844[/C][/ROW]
[ROW][C]9[/C][C]0.254998[/C][C]2.5754[/C][C]0.005724[/C][/ROW]
[ROW][C]10[/C][C]0.127624[/C][C]1.2889[/C][C]0.100168[/C][/ROW]
[ROW][C]11[/C][C]0.403302[/C][C]4.0731[/C][C]4.6e-05[/C][/ROW]
[ROW][C]12[/C][C]0.274386[/C][C]2.7712[/C][C]0.00332[/C][/ROW]
[ROW][C]13[/C][C]-0.442622[/C][C]-4.4703[/C][C]1e-05[/C][/ROW]
[ROW][C]14[/C][C]-0.113857[/C][C]-1.1499[/C][C]0.126437[/C][/ROW]
[ROW][C]15[/C][C]0.013626[/C][C]0.1376[/C][C]0.445407[/C][/ROW]
[ROW][C]16[/C][C]0.126546[/C][C]1.278[/C][C]0.102067[/C][/ROW]
[ROW][C]17[/C][C]-0.097157[/C][C]-0.9812[/C][C]0.164399[/C][/ROW]
[ROW][C]18[/C][C]0.033734[/C][C]0.3407[/C][C]0.367016[/C][/ROW]
[ROW][C]19[/C][C]-0.043003[/C][C]-0.4343[/C][C]0.332492[/C][/ROW]
[ROW][C]20[/C][C]-0.006998[/C][C]-0.0707[/C][C]0.471895[/C][/ROW]
[ROW][C]21[/C][C]0.043564[/C][C]0.44[/C][C]0.330442[/C][/ROW]
[ROW][C]22[/C][C]-0.025277[/C][C]-0.2553[/C][C]0.399509[/C][/ROW]
[ROW][C]23[/C][C]-0.084168[/C][C]-0.8501[/C][C]0.198644[/C][/ROW]
[ROW][C]24[/C][C]-0.039054[/C][C]-0.3944[/C][C]0.347047[/C][/ROW]
[ROW][C]25[/C][C]-0.015899[/C][C]-0.1606[/C][C]0.436376[/C][/ROW]
[ROW][C]26[/C][C]-0.129399[/C][C]-1.3069[/C][C]0.097098[/C][/ROW]
[ROW][C]27[/C][C]0.139515[/C][C]1.409[/C][C]0.080934[/C][/ROW]
[ROW][C]28[/C][C]0.096787[/C][C]0.9775[/C][C]0.165316[/C][/ROW]
[ROW][C]29[/C][C]-0.020673[/C][C]-0.2088[/C][C]0.417514[/C][/ROW]
[ROW][C]30[/C][C]-0.12391[/C][C]-1.2514[/C][C]0.10682[/C][/ROW]
[ROW][C]31[/C][C]-0.016132[/C][C]-0.1629[/C][C]0.43545[/C][/ROW]
[ROW][C]32[/C][C]-0.034872[/C][C]-0.3522[/C][C]0.362711[/C][/ROW]
[ROW][C]33[/C][C]-0.072508[/C][C]-0.7323[/C][C]0.232834[/C][/ROW]
[ROW][C]34[/C][C]0.03367[/C][C]0.3401[/C][C]0.367258[/C][/ROW]
[ROW][C]35[/C][C]0.004032[/C][C]0.0407[/C][C]0.483799[/C][/ROW]
[ROW][C]36[/C][C]0.045439[/C][C]0.4589[/C][C]0.323636[/C][/ROW]
[ROW][C]37[/C][C]0.03463[/C][C]0.3497[/C][C]0.363626[/C][/ROW]
[ROW][C]38[/C][C]-0.019709[/C][C]-0.1991[/C][C]0.421308[/C][/ROW]
[ROW][C]39[/C][C]-0.069081[/C][C]-0.6977[/C][C]0.243481[/C][/ROW]
[ROW][C]40[/C][C]0.039506[/C][C]0.399[/C][C]0.345367[/C][/ROW]
[ROW][C]41[/C][C]0.026626[/C][C]0.2689[/C][C]0.39427[/C][/ROW]
[ROW][C]42[/C][C]-0.017738[/C][C]-0.1791[/C][C]0.429089[/C][/ROW]
[ROW][C]43[/C][C]-0.030835[/C][C]-0.3114[/C][C]0.378057[/C][/ROW]
[ROW][C]44[/C][C]0.011465[/C][C]0.1158[/C][C]0.454021[/C][/ROW]
[ROW][C]45[/C][C]-0.023485[/C][C]-0.2372[/C][C]0.406495[/C][/ROW]
[ROW][C]46[/C][C]0.046575[/C][C]0.4704[/C][C]0.319542[/C][/ROW]
[ROW][C]47[/C][C]-0.132854[/C][C]-1.3418[/C][C]0.091327[/C][/ROW]
[ROW][C]48[/C][C]0.002805[/C][C]0.0283[/C][C]0.488728[/C][/ROW]
[/TABLE]
Source: https://freestatistics.org/blog/index.php?pk=75545&T=2

Globally Unique Identifier (entire table): ba.freestatistics.org/blog/index.php?pk=75545&T=2

As an alternative you can also use a QR Code:  

The GUIDs for individual cells are displayed in the table below:

Partial Autocorrelation Function
Time lag kPACF(k)T-STATP-value
10.7713537.79030
2-0.21787-2.20040.015018
3-0.215805-2.17950.015797
4-0.289888-2.92770.002106
50.0181920.18370.427294
60.0328270.33150.370459
70.1189261.20110.116247
80.1907091.92610.02844
90.2549982.57540.005724
100.1276241.28890.100168
110.4033024.07314.6e-05
120.2743862.77120.00332
13-0.442622-4.47031e-05
14-0.113857-1.14990.126437
150.0136260.13760.445407
160.1265461.2780.102067
17-0.097157-0.98120.164399
180.0337340.34070.367016
19-0.043003-0.43430.332492
20-0.006998-0.07070.471895
210.0435640.440.330442
22-0.025277-0.25530.399509
23-0.084168-0.85010.198644
24-0.039054-0.39440.347047
25-0.015899-0.16060.436376
26-0.129399-1.30690.097098
270.1395151.4090.080934
280.0967870.97750.165316
29-0.020673-0.20880.417514
30-0.12391-1.25140.10682
31-0.016132-0.16290.43545
32-0.034872-0.35220.362711
33-0.072508-0.73230.232834
340.033670.34010.367258
350.0040320.04070.483799
360.0454390.45890.323636
370.034630.34970.363626
38-0.019709-0.19910.421308
39-0.069081-0.69770.243481
400.0395060.3990.345367
410.0266260.26890.39427
42-0.017738-0.17910.429089
43-0.030835-0.31140.378057
440.0114650.11580.454021
45-0.023485-0.23720.406495
460.0465750.47040.319542
47-0.132854-1.34180.091327
480.0028050.02830.488728


Parameters (Session):
par1 = 48 ; par2 = 1 ; par3 = 0 ; par4 = 0 ; par5 = 12 ; par6 = White Noise ; par7 = 0.95 ;
Parameters (R input):
par1 = 48 ; par2 = 1 ; par3 = 0 ; par4 = 0 ; par5 = 12 ; par6 = White Noise ; par7 = 0.95 ;
R code (references can be found in the software module):
if (par1 == 'Default') {
par1 = 10*log10(length(x))
} else {
par1 <- as.numeric(par1)
}
par2 <- as.numeric(par2)
par3 <- as.numeric(par3)
par4 <- as.numeric(par4)
par5 <- as.numeric(par5)
if (par6 == 'White Noise') par6 <- 'white' else par6 <- 'ma'
par7 <- as.numeric(par7)
if (par2 == 0) {
x <- log(x)
} else {
x <- (x ^ par2 - 1) / par2
}
if (par3 > 0) x <- diff(x,lag=1,difference=par3)
if (par4 > 0) x <- diff(x,lag=par5,difference=par4)
bitmap(file='pic1.png')
racf <- acf(x, par1, main='Autocorrelation', xlab='time lag', ylab='ACF', ci.type=par6, ci=par7, sub=paste('(lambda=',par2,', d=',par3,', D=',par4,', CI=', par7, ', CI type=',par6,')',sep=''))
dev.off()
bitmap(file='pic2.png')
rpacf <- pacf(x,par1,main='Partial Autocorrelation',xlab='lags',ylab='PACF')
dev.off()
(myacf <- c(racf$acf))
(mypacf <- c(rpacf$acf))
lengthx <- length(x)
sqrtn <- sqrt(lengthx)
load(file='createtable')
a<-table.start()
a<-table.row.start(a)
a<-table.element(a,'Autocorrelation Function',4,TRUE)
a<-table.row.end(a)
a<-table.row.start(a)
a<-table.element(a,'Time lag k',header=TRUE)
a<-table.element(a,hyperlink('basics.htm','ACF(k)','click here for more information about the Autocorrelation Function'),header=TRUE)
a<-table.element(a,'T-STAT',header=TRUE)
a<-table.element(a,'P-value',header=TRUE)
a<-table.row.end(a)
for (i in 2:(par1+1)) {
a<-table.row.start(a)
a<-table.element(a,i-1,header=TRUE)
a<-table.element(a,round(myacf[i],6))
mytstat <- myacf[i]*sqrtn
a<-table.element(a,round(mytstat,4))
a<-table.element(a,round(1-pt(abs(mytstat),lengthx),6))
a<-table.row.end(a)
}
a<-table.end(a)
table.save(a,file='mytable.tab')
a<-table.start()
a<-table.row.start(a)
a<-table.element(a,'Partial Autocorrelation Function',4,TRUE)
a<-table.row.end(a)
a<-table.row.start(a)
a<-table.element(a,'Time lag k',header=TRUE)
a<-table.element(a,hyperlink('basics.htm','PACF(k)','click here for more information about the Partial Autocorrelation Function'),header=TRUE)
a<-table.element(a,'T-STAT',header=TRUE)
a<-table.element(a,'P-value',header=TRUE)
a<-table.row.end(a)
for (i in 1:par1) {
a<-table.row.start(a)
a<-table.element(a,i,header=TRUE)
a<-table.element(a,round(mypacf[i],6))
mytstat <- mypacf[i]*sqrtn
a<-table.element(a,round(mytstat,4))
a<-table.element(a,round(1-pt(abs(mytstat),lengthx),6))
a<-table.row.end(a)
}
a<-table.end(a)
table.save(a,file='mytable1.tab')