Free Statistics

of Irreproducible Research!

Author's title

Author*Unverified author*
R Software Modulerwasp_autocorrelation.wasp
Title produced by software(Partial) Autocorrelation Function
Date of computationWed, 05 May 2010 15:57:18 +0000
Cite this page as followsStatistical Computations at FreeStatistics.org, Office for Research Development and Education, URL https://freestatistics.org/blog/index.php?v=date/2010/May/05/t1273075083qv0k7udn2vohzyx.htm/, Retrieved Sun, 28 Apr 2024 15:21:12 +0000
Statistical Computations at FreeStatistics.org, Office for Research Development and Education, URL https://freestatistics.org/blog/index.php?pk=75546, Retrieved Sun, 28 Apr 2024 15:21:12 +0000
QR Codes:

Original text written by user:
IsPrivate?No (this computation is public)
User-defined keywordsKDGP2W21
Estimated Impact146
Family? (F = Feedback message, R = changed R code, M = changed R Module, P = changed Parameters, D = changed Data)
-       [(Partial) Autocorrelation Function] [] [2010-05-05 15:57:18] [917a4afc20628654d1f716afbd7d9cc1] [Current]
Feedback Forum

Post a new message
Dataseries X:
2953
2635
2404
2413
2136
1565
1451
2037
2477
2785
2994
2681
3098
2708
2517
2445
2087
1801
1216
2173
2286
3121
3458
3511
3524
2767
2744
2603
2527
1846
1066
2327
3066
3048
3806
4042
3583
3438
2957
2885
2744
1837
1447
2504
3248
3098
4318
3561
3316
3379
2717
2354
2445
1542
1606
2590
3588
3202
4704
4005
3810
3488
2781
2944
2817
1960
1937
2903
3357
3552
4581
3905
4581
4037
3345
3175
2808
2050
1719
3143
3756
4776
4540
4309
4563
3506
3665
3361
3094
2440
1633
2935
4159
4159
4894
4921
4577
4155
3851
3429
3370
2726


Summary of computational transaction
Raw Inputview raw input (R code)
Raw Outputview raw output of R engine
Computing time2 seconds
R Server'George Udny Yule' @ 72.249.76.132

\begin{tabular}{lllllllll}
\hline
Summary of computational transaction \tabularnewline
Raw Input & view raw input (R code)  \tabularnewline
Raw Output & view raw output of R engine  \tabularnewline
Computing time & 2 seconds \tabularnewline
R Server & 'George Udny Yule' @ 72.249.76.132 \tabularnewline
\hline
\end{tabular}
%Source: https://freestatistics.org/blog/index.php?pk=75546&T=0

[TABLE]
[ROW][C]Summary of computational transaction[/C][/ROW]
[ROW][C]Raw Input[/C][C]view raw input (R code) [/C][/ROW]
[ROW][C]Raw Output[/C][C]view raw output of R engine [/C][/ROW]
[ROW][C]Computing time[/C][C]2 seconds[/C][/ROW]
[ROW][C]R Server[/C][C]'George Udny Yule' @ 72.249.76.132[/C][/ROW]
[/TABLE]
Source: https://freestatistics.org/blog/index.php?pk=75546&T=0

Globally Unique Identifier (entire table): ba.freestatistics.org/blog/index.php?pk=75546&T=0

As an alternative you can also use a QR Code:  

The GUIDs for individual cells are displayed in the table below:

Summary of computational transaction
Raw Inputview raw input (R code)
Raw Outputview raw output of R engine
Computing time2 seconds
R Server'George Udny Yule' @ 72.249.76.132


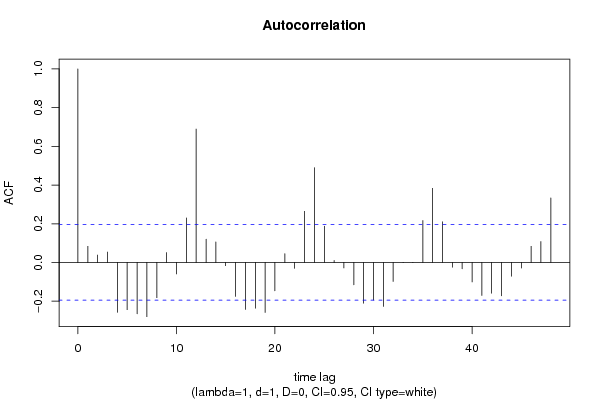
Autocorrelation Function
Time lag kACF(k)T-STATP-value
10.083540.83960.201567
20.0382310.38420.350813
30.0538650.54130.294732
4-0.257699-2.58980.00551
5-0.24387-2.45090.007985
6-0.26514-2.66460.004487
7-0.279919-2.81320.002948
8-0.181865-1.82770.035272
90.0515580.51820.302741
10-0.05896-0.59250.277405
110.230132.31280.011382
120.6895646.930
130.1204791.21080.114399
140.1058831.06410.144908
15-0.016621-0.1670.433838
16-0.175401-1.76280.040483
17-0.24294-2.44150.008182
18-0.236509-2.37690.009672
19-0.258401-2.59690.005405
20-0.146164-1.46890.072479
210.0454670.45690.32435
22-0.030289-0.30440.380726
230.2645782.6590.004558
240.4900684.92512e-06
250.1875841.88520.031139
260.0103580.10410.458648
27-0.02833-0.28470.388225
28-0.115714-1.16290.123804
29-0.210175-2.11220.018566
30-0.194164-1.95130.026894
31-0.227479-2.28610.012167
32-0.09774-0.98230.164156
330.001020.01030.49592
340.0011230.01130.495507
350.2163032.17380.016027
360.3833223.85230.000103
370.2100162.11060.018636
38-0.024147-0.24270.404376
39-0.032448-0.32610.372513
40-0.100565-1.01070.157296
41-0.170305-1.71150.045025
42-0.158917-1.59710.056684
43-0.172089-1.72950.04339
44-0.071119-0.71470.238211
45-0.02858-0.28720.387265
460.0837780.8420.2009
470.1083121.08850.139477
480.3333213.34980.000569

\begin{tabular}{lllllllll}
\hline
Autocorrelation Function \tabularnewline
Time lag k & ACF(k) & T-STAT & P-value \tabularnewline
1 & 0.08354 & 0.8396 & 0.201567 \tabularnewline
2 & 0.038231 & 0.3842 & 0.350813 \tabularnewline
3 & 0.053865 & 0.5413 & 0.294732 \tabularnewline
4 & -0.257699 & -2.5898 & 0.00551 \tabularnewline
5 & -0.24387 & -2.4509 & 0.007985 \tabularnewline
6 & -0.26514 & -2.6646 & 0.004487 \tabularnewline
7 & -0.279919 & -2.8132 & 0.002948 \tabularnewline
8 & -0.181865 & -1.8277 & 0.035272 \tabularnewline
9 & 0.051558 & 0.5182 & 0.302741 \tabularnewline
10 & -0.05896 & -0.5925 & 0.277405 \tabularnewline
11 & 0.23013 & 2.3128 & 0.011382 \tabularnewline
12 & 0.689564 & 6.93 & 0 \tabularnewline
13 & 0.120479 & 1.2108 & 0.114399 \tabularnewline
14 & 0.105883 & 1.0641 & 0.144908 \tabularnewline
15 & -0.016621 & -0.167 & 0.433838 \tabularnewline
16 & -0.175401 & -1.7628 & 0.040483 \tabularnewline
17 & -0.24294 & -2.4415 & 0.008182 \tabularnewline
18 & -0.236509 & -2.3769 & 0.009672 \tabularnewline
19 & -0.258401 & -2.5969 & 0.005405 \tabularnewline
20 & -0.146164 & -1.4689 & 0.072479 \tabularnewline
21 & 0.045467 & 0.4569 & 0.32435 \tabularnewline
22 & -0.030289 & -0.3044 & 0.380726 \tabularnewline
23 & 0.264578 & 2.659 & 0.004558 \tabularnewline
24 & 0.490068 & 4.9251 & 2e-06 \tabularnewline
25 & 0.187584 & 1.8852 & 0.031139 \tabularnewline
26 & 0.010358 & 0.1041 & 0.458648 \tabularnewline
27 & -0.02833 & -0.2847 & 0.388225 \tabularnewline
28 & -0.115714 & -1.1629 & 0.123804 \tabularnewline
29 & -0.210175 & -2.1122 & 0.018566 \tabularnewline
30 & -0.194164 & -1.9513 & 0.026894 \tabularnewline
31 & -0.227479 & -2.2861 & 0.012167 \tabularnewline
32 & -0.09774 & -0.9823 & 0.164156 \tabularnewline
33 & 0.00102 & 0.0103 & 0.49592 \tabularnewline
34 & 0.001123 & 0.0113 & 0.495507 \tabularnewline
35 & 0.216303 & 2.1738 & 0.016027 \tabularnewline
36 & 0.383322 & 3.8523 & 0.000103 \tabularnewline
37 & 0.210016 & 2.1106 & 0.018636 \tabularnewline
38 & -0.024147 & -0.2427 & 0.404376 \tabularnewline
39 & -0.032448 & -0.3261 & 0.372513 \tabularnewline
40 & -0.100565 & -1.0107 & 0.157296 \tabularnewline
41 & -0.170305 & -1.7115 & 0.045025 \tabularnewline
42 & -0.158917 & -1.5971 & 0.056684 \tabularnewline
43 & -0.172089 & -1.7295 & 0.04339 \tabularnewline
44 & -0.071119 & -0.7147 & 0.238211 \tabularnewline
45 & -0.02858 & -0.2872 & 0.387265 \tabularnewline
46 & 0.083778 & 0.842 & 0.2009 \tabularnewline
47 & 0.108312 & 1.0885 & 0.139477 \tabularnewline
48 & 0.333321 & 3.3498 & 0.000569 \tabularnewline
\hline
\end{tabular}
%Source: https://freestatistics.org/blog/index.php?pk=75546&T=1

[TABLE]
[ROW][C]Autocorrelation Function[/C][/ROW]
[ROW][C]Time lag k[/C][C]ACF(k)[/C][C]T-STAT[/C][C]P-value[/C][/ROW]
[ROW][C]1[/C][C]0.08354[/C][C]0.8396[/C][C]0.201567[/C][/ROW]
[ROW][C]2[/C][C]0.038231[/C][C]0.3842[/C][C]0.350813[/C][/ROW]
[ROW][C]3[/C][C]0.053865[/C][C]0.5413[/C][C]0.294732[/C][/ROW]
[ROW][C]4[/C][C]-0.257699[/C][C]-2.5898[/C][C]0.00551[/C][/ROW]
[ROW][C]5[/C][C]-0.24387[/C][C]-2.4509[/C][C]0.007985[/C][/ROW]
[ROW][C]6[/C][C]-0.26514[/C][C]-2.6646[/C][C]0.004487[/C][/ROW]
[ROW][C]7[/C][C]-0.279919[/C][C]-2.8132[/C][C]0.002948[/C][/ROW]
[ROW][C]8[/C][C]-0.181865[/C][C]-1.8277[/C][C]0.035272[/C][/ROW]
[ROW][C]9[/C][C]0.051558[/C][C]0.5182[/C][C]0.302741[/C][/ROW]
[ROW][C]10[/C][C]-0.05896[/C][C]-0.5925[/C][C]0.277405[/C][/ROW]
[ROW][C]11[/C][C]0.23013[/C][C]2.3128[/C][C]0.011382[/C][/ROW]
[ROW][C]12[/C][C]0.689564[/C][C]6.93[/C][C]0[/C][/ROW]
[ROW][C]13[/C][C]0.120479[/C][C]1.2108[/C][C]0.114399[/C][/ROW]
[ROW][C]14[/C][C]0.105883[/C][C]1.0641[/C][C]0.144908[/C][/ROW]
[ROW][C]15[/C][C]-0.016621[/C][C]-0.167[/C][C]0.433838[/C][/ROW]
[ROW][C]16[/C][C]-0.175401[/C][C]-1.7628[/C][C]0.040483[/C][/ROW]
[ROW][C]17[/C][C]-0.24294[/C][C]-2.4415[/C][C]0.008182[/C][/ROW]
[ROW][C]18[/C][C]-0.236509[/C][C]-2.3769[/C][C]0.009672[/C][/ROW]
[ROW][C]19[/C][C]-0.258401[/C][C]-2.5969[/C][C]0.005405[/C][/ROW]
[ROW][C]20[/C][C]-0.146164[/C][C]-1.4689[/C][C]0.072479[/C][/ROW]
[ROW][C]21[/C][C]0.045467[/C][C]0.4569[/C][C]0.32435[/C][/ROW]
[ROW][C]22[/C][C]-0.030289[/C][C]-0.3044[/C][C]0.380726[/C][/ROW]
[ROW][C]23[/C][C]0.264578[/C][C]2.659[/C][C]0.004558[/C][/ROW]
[ROW][C]24[/C][C]0.490068[/C][C]4.9251[/C][C]2e-06[/C][/ROW]
[ROW][C]25[/C][C]0.187584[/C][C]1.8852[/C][C]0.031139[/C][/ROW]
[ROW][C]26[/C][C]0.010358[/C][C]0.1041[/C][C]0.458648[/C][/ROW]
[ROW][C]27[/C][C]-0.02833[/C][C]-0.2847[/C][C]0.388225[/C][/ROW]
[ROW][C]28[/C][C]-0.115714[/C][C]-1.1629[/C][C]0.123804[/C][/ROW]
[ROW][C]29[/C][C]-0.210175[/C][C]-2.1122[/C][C]0.018566[/C][/ROW]
[ROW][C]30[/C][C]-0.194164[/C][C]-1.9513[/C][C]0.026894[/C][/ROW]
[ROW][C]31[/C][C]-0.227479[/C][C]-2.2861[/C][C]0.012167[/C][/ROW]
[ROW][C]32[/C][C]-0.09774[/C][C]-0.9823[/C][C]0.164156[/C][/ROW]
[ROW][C]33[/C][C]0.00102[/C][C]0.0103[/C][C]0.49592[/C][/ROW]
[ROW][C]34[/C][C]0.001123[/C][C]0.0113[/C][C]0.495507[/C][/ROW]
[ROW][C]35[/C][C]0.216303[/C][C]2.1738[/C][C]0.016027[/C][/ROW]
[ROW][C]36[/C][C]0.383322[/C][C]3.8523[/C][C]0.000103[/C][/ROW]
[ROW][C]37[/C][C]0.210016[/C][C]2.1106[/C][C]0.018636[/C][/ROW]
[ROW][C]38[/C][C]-0.024147[/C][C]-0.2427[/C][C]0.404376[/C][/ROW]
[ROW][C]39[/C][C]-0.032448[/C][C]-0.3261[/C][C]0.372513[/C][/ROW]
[ROW][C]40[/C][C]-0.100565[/C][C]-1.0107[/C][C]0.157296[/C][/ROW]
[ROW][C]41[/C][C]-0.170305[/C][C]-1.7115[/C][C]0.045025[/C][/ROW]
[ROW][C]42[/C][C]-0.158917[/C][C]-1.5971[/C][C]0.056684[/C][/ROW]
[ROW][C]43[/C][C]-0.172089[/C][C]-1.7295[/C][C]0.04339[/C][/ROW]
[ROW][C]44[/C][C]-0.071119[/C][C]-0.7147[/C][C]0.238211[/C][/ROW]
[ROW][C]45[/C][C]-0.02858[/C][C]-0.2872[/C][C]0.387265[/C][/ROW]
[ROW][C]46[/C][C]0.083778[/C][C]0.842[/C][C]0.2009[/C][/ROW]
[ROW][C]47[/C][C]0.108312[/C][C]1.0885[/C][C]0.139477[/C][/ROW]
[ROW][C]48[/C][C]0.333321[/C][C]3.3498[/C][C]0.000569[/C][/ROW]
[/TABLE]
Source: https://freestatistics.org/blog/index.php?pk=75546&T=1

Globally Unique Identifier (entire table): ba.freestatistics.org/blog/index.php?pk=75546&T=1

As an alternative you can also use a QR Code:  

The GUIDs for individual cells are displayed in the table below:

Autocorrelation Function
Time lag kACF(k)T-STATP-value
10.083540.83960.201567
20.0382310.38420.350813
30.0538650.54130.294732
4-0.257699-2.58980.00551
5-0.24387-2.45090.007985
6-0.26514-2.66460.004487
7-0.279919-2.81320.002948
8-0.181865-1.82770.035272
90.0515580.51820.302741
10-0.05896-0.59250.277405
110.230132.31280.011382
120.6895646.930
130.1204791.21080.114399
140.1058831.06410.144908
15-0.016621-0.1670.433838
16-0.175401-1.76280.040483
17-0.24294-2.44150.008182
18-0.236509-2.37690.009672
19-0.258401-2.59690.005405
20-0.146164-1.46890.072479
210.0454670.45690.32435
22-0.030289-0.30440.380726
230.2645782.6590.004558
240.4900684.92512e-06
250.1875841.88520.031139
260.0103580.10410.458648
27-0.02833-0.28470.388225
28-0.115714-1.16290.123804
29-0.210175-2.11220.018566
30-0.194164-1.95130.026894
31-0.227479-2.28610.012167
32-0.09774-0.98230.164156
330.001020.01030.49592
340.0011230.01130.495507
350.2163032.17380.016027
360.3833223.85230.000103
370.2100162.11060.018636
38-0.024147-0.24270.404376
39-0.032448-0.32610.372513
40-0.100565-1.01070.157296
41-0.170305-1.71150.045025
42-0.158917-1.59710.056684
43-0.172089-1.72950.04339
44-0.071119-0.71470.238211
45-0.02858-0.28720.387265
460.0837780.8420.2009
470.1083121.08850.139477
480.3333213.34980.000569


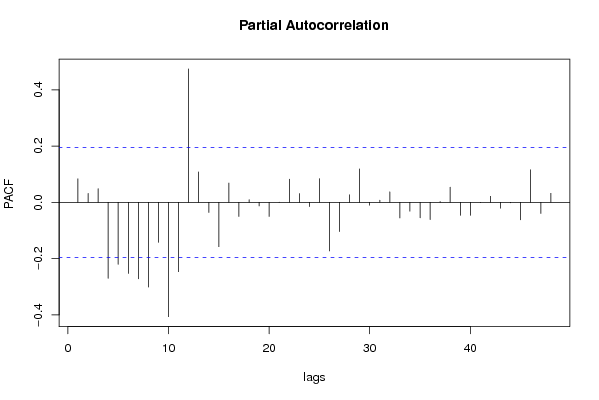
Partial Autocorrelation Function
Time lag kPACF(k)T-STATP-value
10.083540.83960.201567
20.0314720.31630.376219
30.0485290.48770.313405
4-0.269861-2.71210.00393
5-0.22019-2.21290.014578
6-0.252359-2.53620.006369
7-0.271498-2.72850.003752
8-0.301012-3.02510.001576
9-0.141915-1.42620.078442
10-0.406061-4.08094.5e-05
11-0.246424-2.47650.007464
120.4739344.7633e-06
130.1082671.08810.139577
14-0.035954-0.36130.359301
15-0.157335-1.58120.05848
160.0683830.68720.246754
17-0.050141-0.50390.307709
180.00950.09550.462064
19-0.012677-0.12740.449437
20-0.049986-0.50230.308258
210.0006860.00690.497258
220.0822170.82630.2053
230.0312280.31380.377147
24-0.015162-0.15240.439596
250.0840450.84460.200155
26-0.172786-1.73650.042764
27-0.103679-1.0420.149959
280.0269830.27120.393405
290.1186611.19250.117925
30-0.010193-0.10240.459307
310.007630.07670.469513
320.0372280.37410.354542
33-0.055355-0.55630.289615
34-0.031596-0.31750.375744
35-0.054996-0.55270.290845
36-0.061072-0.61380.270376
370.0027050.02720.489184
380.0539970.54270.294277
39-0.04607-0.4630.32218
40-0.045953-0.46180.322601
41-0.00072-0.00720.497121
420.02130.21410.415464
43-0.020951-0.21060.41683
44-0.001514-0.01520.493946
45-0.061984-0.62290.267366
460.1154921.16070.124255
47-0.039257-0.39450.347011
480.0319540.32110.374388

\begin{tabular}{lllllllll}
\hline
Partial Autocorrelation Function \tabularnewline
Time lag k & PACF(k) & T-STAT & P-value \tabularnewline
1 & 0.08354 & 0.8396 & 0.201567 \tabularnewline
2 & 0.031472 & 0.3163 & 0.376219 \tabularnewline
3 & 0.048529 & 0.4877 & 0.313405 \tabularnewline
4 & -0.269861 & -2.7121 & 0.00393 \tabularnewline
5 & -0.22019 & -2.2129 & 0.014578 \tabularnewline
6 & -0.252359 & -2.5362 & 0.006369 \tabularnewline
7 & -0.271498 & -2.7285 & 0.003752 \tabularnewline
8 & -0.301012 & -3.0251 & 0.001576 \tabularnewline
9 & -0.141915 & -1.4262 & 0.078442 \tabularnewline
10 & -0.406061 & -4.0809 & 4.5e-05 \tabularnewline
11 & -0.246424 & -2.4765 & 0.007464 \tabularnewline
12 & 0.473934 & 4.763 & 3e-06 \tabularnewline
13 & 0.108267 & 1.0881 & 0.139577 \tabularnewline
14 & -0.035954 & -0.3613 & 0.359301 \tabularnewline
15 & -0.157335 & -1.5812 & 0.05848 \tabularnewline
16 & 0.068383 & 0.6872 & 0.246754 \tabularnewline
17 & -0.050141 & -0.5039 & 0.307709 \tabularnewline
18 & 0.0095 & 0.0955 & 0.462064 \tabularnewline
19 & -0.012677 & -0.1274 & 0.449437 \tabularnewline
20 & -0.049986 & -0.5023 & 0.308258 \tabularnewline
21 & 0.000686 & 0.0069 & 0.497258 \tabularnewline
22 & 0.082217 & 0.8263 & 0.2053 \tabularnewline
23 & 0.031228 & 0.3138 & 0.377147 \tabularnewline
24 & -0.015162 & -0.1524 & 0.439596 \tabularnewline
25 & 0.084045 & 0.8446 & 0.200155 \tabularnewline
26 & -0.172786 & -1.7365 & 0.042764 \tabularnewline
27 & -0.103679 & -1.042 & 0.149959 \tabularnewline
28 & 0.026983 & 0.2712 & 0.393405 \tabularnewline
29 & 0.118661 & 1.1925 & 0.117925 \tabularnewline
30 & -0.010193 & -0.1024 & 0.459307 \tabularnewline
31 & 0.00763 & 0.0767 & 0.469513 \tabularnewline
32 & 0.037228 & 0.3741 & 0.354542 \tabularnewline
33 & -0.055355 & -0.5563 & 0.289615 \tabularnewline
34 & -0.031596 & -0.3175 & 0.375744 \tabularnewline
35 & -0.054996 & -0.5527 & 0.290845 \tabularnewline
36 & -0.061072 & -0.6138 & 0.270376 \tabularnewline
37 & 0.002705 & 0.0272 & 0.489184 \tabularnewline
38 & 0.053997 & 0.5427 & 0.294277 \tabularnewline
39 & -0.04607 & -0.463 & 0.32218 \tabularnewline
40 & -0.045953 & -0.4618 & 0.322601 \tabularnewline
41 & -0.00072 & -0.0072 & 0.497121 \tabularnewline
42 & 0.0213 & 0.2141 & 0.415464 \tabularnewline
43 & -0.020951 & -0.2106 & 0.41683 \tabularnewline
44 & -0.001514 & -0.0152 & 0.493946 \tabularnewline
45 & -0.061984 & -0.6229 & 0.267366 \tabularnewline
46 & 0.115492 & 1.1607 & 0.124255 \tabularnewline
47 & -0.039257 & -0.3945 & 0.347011 \tabularnewline
48 & 0.031954 & 0.3211 & 0.374388 \tabularnewline
\hline
\end{tabular}
%Source: https://freestatistics.org/blog/index.php?pk=75546&T=2

[TABLE]
[ROW][C]Partial Autocorrelation Function[/C][/ROW]
[ROW][C]Time lag k[/C][C]PACF(k)[/C][C]T-STAT[/C][C]P-value[/C][/ROW]
[ROW][C]1[/C][C]0.08354[/C][C]0.8396[/C][C]0.201567[/C][/ROW]
[ROW][C]2[/C][C]0.031472[/C][C]0.3163[/C][C]0.376219[/C][/ROW]
[ROW][C]3[/C][C]0.048529[/C][C]0.4877[/C][C]0.313405[/C][/ROW]
[ROW][C]4[/C][C]-0.269861[/C][C]-2.7121[/C][C]0.00393[/C][/ROW]
[ROW][C]5[/C][C]-0.22019[/C][C]-2.2129[/C][C]0.014578[/C][/ROW]
[ROW][C]6[/C][C]-0.252359[/C][C]-2.5362[/C][C]0.006369[/C][/ROW]
[ROW][C]7[/C][C]-0.271498[/C][C]-2.7285[/C][C]0.003752[/C][/ROW]
[ROW][C]8[/C][C]-0.301012[/C][C]-3.0251[/C][C]0.001576[/C][/ROW]
[ROW][C]9[/C][C]-0.141915[/C][C]-1.4262[/C][C]0.078442[/C][/ROW]
[ROW][C]10[/C][C]-0.406061[/C][C]-4.0809[/C][C]4.5e-05[/C][/ROW]
[ROW][C]11[/C][C]-0.246424[/C][C]-2.4765[/C][C]0.007464[/C][/ROW]
[ROW][C]12[/C][C]0.473934[/C][C]4.763[/C][C]3e-06[/C][/ROW]
[ROW][C]13[/C][C]0.108267[/C][C]1.0881[/C][C]0.139577[/C][/ROW]
[ROW][C]14[/C][C]-0.035954[/C][C]-0.3613[/C][C]0.359301[/C][/ROW]
[ROW][C]15[/C][C]-0.157335[/C][C]-1.5812[/C][C]0.05848[/C][/ROW]
[ROW][C]16[/C][C]0.068383[/C][C]0.6872[/C][C]0.246754[/C][/ROW]
[ROW][C]17[/C][C]-0.050141[/C][C]-0.5039[/C][C]0.307709[/C][/ROW]
[ROW][C]18[/C][C]0.0095[/C][C]0.0955[/C][C]0.462064[/C][/ROW]
[ROW][C]19[/C][C]-0.012677[/C][C]-0.1274[/C][C]0.449437[/C][/ROW]
[ROW][C]20[/C][C]-0.049986[/C][C]-0.5023[/C][C]0.308258[/C][/ROW]
[ROW][C]21[/C][C]0.000686[/C][C]0.0069[/C][C]0.497258[/C][/ROW]
[ROW][C]22[/C][C]0.082217[/C][C]0.8263[/C][C]0.2053[/C][/ROW]
[ROW][C]23[/C][C]0.031228[/C][C]0.3138[/C][C]0.377147[/C][/ROW]
[ROW][C]24[/C][C]-0.015162[/C][C]-0.1524[/C][C]0.439596[/C][/ROW]
[ROW][C]25[/C][C]0.084045[/C][C]0.8446[/C][C]0.200155[/C][/ROW]
[ROW][C]26[/C][C]-0.172786[/C][C]-1.7365[/C][C]0.042764[/C][/ROW]
[ROW][C]27[/C][C]-0.103679[/C][C]-1.042[/C][C]0.149959[/C][/ROW]
[ROW][C]28[/C][C]0.026983[/C][C]0.2712[/C][C]0.393405[/C][/ROW]
[ROW][C]29[/C][C]0.118661[/C][C]1.1925[/C][C]0.117925[/C][/ROW]
[ROW][C]30[/C][C]-0.010193[/C][C]-0.1024[/C][C]0.459307[/C][/ROW]
[ROW][C]31[/C][C]0.00763[/C][C]0.0767[/C][C]0.469513[/C][/ROW]
[ROW][C]32[/C][C]0.037228[/C][C]0.3741[/C][C]0.354542[/C][/ROW]
[ROW][C]33[/C][C]-0.055355[/C][C]-0.5563[/C][C]0.289615[/C][/ROW]
[ROW][C]34[/C][C]-0.031596[/C][C]-0.3175[/C][C]0.375744[/C][/ROW]
[ROW][C]35[/C][C]-0.054996[/C][C]-0.5527[/C][C]0.290845[/C][/ROW]
[ROW][C]36[/C][C]-0.061072[/C][C]-0.6138[/C][C]0.270376[/C][/ROW]
[ROW][C]37[/C][C]0.002705[/C][C]0.0272[/C][C]0.489184[/C][/ROW]
[ROW][C]38[/C][C]0.053997[/C][C]0.5427[/C][C]0.294277[/C][/ROW]
[ROW][C]39[/C][C]-0.04607[/C][C]-0.463[/C][C]0.32218[/C][/ROW]
[ROW][C]40[/C][C]-0.045953[/C][C]-0.4618[/C][C]0.322601[/C][/ROW]
[ROW][C]41[/C][C]-0.00072[/C][C]-0.0072[/C][C]0.497121[/C][/ROW]
[ROW][C]42[/C][C]0.0213[/C][C]0.2141[/C][C]0.415464[/C][/ROW]
[ROW][C]43[/C][C]-0.020951[/C][C]-0.2106[/C][C]0.41683[/C][/ROW]
[ROW][C]44[/C][C]-0.001514[/C][C]-0.0152[/C][C]0.493946[/C][/ROW]
[ROW][C]45[/C][C]-0.061984[/C][C]-0.6229[/C][C]0.267366[/C][/ROW]
[ROW][C]46[/C][C]0.115492[/C][C]1.1607[/C][C]0.124255[/C][/ROW]
[ROW][C]47[/C][C]-0.039257[/C][C]-0.3945[/C][C]0.347011[/C][/ROW]
[ROW][C]48[/C][C]0.031954[/C][C]0.3211[/C][C]0.374388[/C][/ROW]
[/TABLE]
Source: https://freestatistics.org/blog/index.php?pk=75546&T=2

Globally Unique Identifier (entire table): ba.freestatistics.org/blog/index.php?pk=75546&T=2

As an alternative you can also use a QR Code:  

The GUIDs for individual cells are displayed in the table below:

Partial Autocorrelation Function
Time lag kPACF(k)T-STATP-value
10.083540.83960.201567
20.0314720.31630.376219
30.0485290.48770.313405
4-0.269861-2.71210.00393
5-0.22019-2.21290.014578
6-0.252359-2.53620.006369
7-0.271498-2.72850.003752
8-0.301012-3.02510.001576
9-0.141915-1.42620.078442
10-0.406061-4.08094.5e-05
11-0.246424-2.47650.007464
120.4739344.7633e-06
130.1082671.08810.139577
14-0.035954-0.36130.359301
15-0.157335-1.58120.05848
160.0683830.68720.246754
17-0.050141-0.50390.307709
180.00950.09550.462064
19-0.012677-0.12740.449437
20-0.049986-0.50230.308258
210.0006860.00690.497258
220.0822170.82630.2053
230.0312280.31380.377147
24-0.015162-0.15240.439596
250.0840450.84460.200155
26-0.172786-1.73650.042764
27-0.103679-1.0420.149959
280.0269830.27120.393405
290.1186611.19250.117925
30-0.010193-0.10240.459307
310.007630.07670.469513
320.0372280.37410.354542
33-0.055355-0.55630.289615
34-0.031596-0.31750.375744
35-0.054996-0.55270.290845
36-0.061072-0.61380.270376
370.0027050.02720.489184
380.0539970.54270.294277
39-0.04607-0.4630.32218
40-0.045953-0.46180.322601
41-0.00072-0.00720.497121
420.02130.21410.415464
43-0.020951-0.21060.41683
44-0.001514-0.01520.493946
45-0.061984-0.62290.267366
460.1154921.16070.124255
47-0.039257-0.39450.347011
480.0319540.32110.374388


Parameters (Session):
par1 = 48 ; par2 = 1 ; par3 = 1 ; par4 = 0 ; par5 = 12 ; par6 = White Noise ; par7 = 0.95 ;
Parameters (R input):
par1 = 48 ; par2 = 1 ; par3 = 1 ; par4 = 0 ; par5 = 12 ; par6 = White Noise ; par7 = 0.95 ;
R code (references can be found in the software module):
if (par1 == 'Default') {
par1 = 10*log10(length(x))
} else {
par1 <- as.numeric(par1)
}
par2 <- as.numeric(par2)
par3 <- as.numeric(par3)
par4 <- as.numeric(par4)
par5 <- as.numeric(par5)
if (par6 == 'White Noise') par6 <- 'white' else par6 <- 'ma'
par7 <- as.numeric(par7)
if (par2 == 0) {
x <- log(x)
} else {
x <- (x ^ par2 - 1) / par2
}
if (par3 > 0) x <- diff(x,lag=1,difference=par3)
if (par4 > 0) x <- diff(x,lag=par5,difference=par4)
bitmap(file='pic1.png')
racf <- acf(x, par1, main='Autocorrelation', xlab='time lag', ylab='ACF', ci.type=par6, ci=par7, sub=paste('(lambda=',par2,', d=',par3,', D=',par4,', CI=', par7, ', CI type=',par6,')',sep=''))
dev.off()
bitmap(file='pic2.png')
rpacf <- pacf(x,par1,main='Partial Autocorrelation',xlab='lags',ylab='PACF')
dev.off()
(myacf <- c(racf$acf))
(mypacf <- c(rpacf$acf))
lengthx <- length(x)
sqrtn <- sqrt(lengthx)
load(file='createtable')
a<-table.start()
a<-table.row.start(a)
a<-table.element(a,'Autocorrelation Function',4,TRUE)
a<-table.row.end(a)
a<-table.row.start(a)
a<-table.element(a,'Time lag k',header=TRUE)
a<-table.element(a,hyperlink('basics.htm','ACF(k)','click here for more information about the Autocorrelation Function'),header=TRUE)
a<-table.element(a,'T-STAT',header=TRUE)
a<-table.element(a,'P-value',header=TRUE)
a<-table.row.end(a)
for (i in 2:(par1+1)) {
a<-table.row.start(a)
a<-table.element(a,i-1,header=TRUE)
a<-table.element(a,round(myacf[i],6))
mytstat <- myacf[i]*sqrtn
a<-table.element(a,round(mytstat,4))
a<-table.element(a,round(1-pt(abs(mytstat),lengthx),6))
a<-table.row.end(a)
}
a<-table.end(a)
table.save(a,file='mytable.tab')
a<-table.start()
a<-table.row.start(a)
a<-table.element(a,'Partial Autocorrelation Function',4,TRUE)
a<-table.row.end(a)
a<-table.row.start(a)
a<-table.element(a,'Time lag k',header=TRUE)
a<-table.element(a,hyperlink('basics.htm','PACF(k)','click here for more information about the Partial Autocorrelation Function'),header=TRUE)
a<-table.element(a,'T-STAT',header=TRUE)
a<-table.element(a,'P-value',header=TRUE)
a<-table.row.end(a)
for (i in 1:par1) {
a<-table.row.start(a)
a<-table.element(a,i,header=TRUE)
a<-table.element(a,round(mypacf[i],6))
mytstat <- mypacf[i]*sqrtn
a<-table.element(a,round(mytstat,4))
a<-table.element(a,round(1-pt(abs(mytstat),lengthx),6))
a<-table.row.end(a)
}
a<-table.end(a)
table.save(a,file='mytable1.tab')