Free Statistics

of Irreproducible Research!

Author's title

Author*Unverified author*
R Software Modulerwasp_autocorrelation.wasp
Title produced by software(Partial) Autocorrelation Function
Date of computationWed, 05 May 2010 16:02:01 +0000
Cite this page as followsStatistical Computations at FreeStatistics.org, Office for Research Development and Education, URL https://freestatistics.org/blog/index.php?v=date/2010/May/05/t12730754019xfzc5q3hvfzlni.htm/, Retrieved Sun, 28 Apr 2024 13:23:12 +0000
Statistical Computations at FreeStatistics.org, Office for Research Development and Education, URL https://freestatistics.org/blog/index.php?pk=75548, Retrieved Sun, 28 Apr 2024 13:23:12 +0000
QR Codes:

Original text written by user:
IsPrivate?No (this computation is public)
User-defined keywordsKDGP2W21
Estimated Impact164
Family? (F = Feedback message, R = changed R code, M = changed R Module, P = changed Parameters, D = changed Data)
-       [(Partial) Autocorrelation Function] [] [2010-05-05 16:02:01] [ba71a47f11e8062985d77fe3913d8d26] [Current]
Feedback Forum

Post a new message
Dataseries X:
254
234
222
225
243
270
289
273
274
220
271
288
276
266
239
201
242
239
273
280
294
212
264
272
262
238
227
250
245
270
288
298
281
218
284
281
277
276
222
255
267
261
263
264
278
248
320
305
301
274
220
235
252
272
280
305
299
246
307
325
302
274
251
272
253
292
288
258
295
231
250
268


Summary of computational transaction
Raw Inputview raw input (R code)
Raw Outputview raw output of R engine
Computing time2 seconds
R Server'RServer@AstonUniversity' @ vre.aston.ac.uk

\begin{tabular}{lllllllll}
\hline
Summary of computational transaction \tabularnewline
Raw Input & view raw input (R code)  \tabularnewline
Raw Output & view raw output of R engine  \tabularnewline
Computing time & 2 seconds \tabularnewline
R Server & 'RServer@AstonUniversity' @ vre.aston.ac.uk \tabularnewline
\hline
\end{tabular}
%Source: https://freestatistics.org/blog/index.php?pk=75548&T=0

[TABLE]
[ROW][C]Summary of computational transaction[/C][/ROW]
[ROW][C]Raw Input[/C][C]view raw input (R code) [/C][/ROW]
[ROW][C]Raw Output[/C][C]view raw output of R engine [/C][/ROW]
[ROW][C]Computing time[/C][C]2 seconds[/C][/ROW]
[ROW][C]R Server[/C][C]'RServer@AstonUniversity' @ vre.aston.ac.uk[/C][/ROW]
[/TABLE]
Source: https://freestatistics.org/blog/index.php?pk=75548&T=0

Globally Unique Identifier (entire table): ba.freestatistics.org/blog/index.php?pk=75548&T=0

As an alternative you can also use a QR Code:  

The GUIDs for individual cells are displayed in the table below:

Summary of computational transaction
Raw Inputview raw input (R code)
Raw Outputview raw output of R engine
Computing time2 seconds
R Server'RServer@AstonUniversity' @ vre.aston.ac.uk


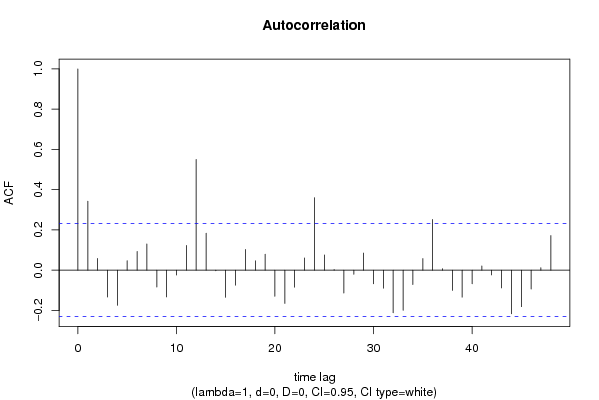
Autocorrelation Function
Time lag kACF(k)T-STATP-value
10.3427872.90860.002412
20.0582290.49410.311372
3-0.133101-1.12940.131239
4-0.174184-1.4780.071885
50.0468390.39740.346107
60.0925590.78540.217401
70.1298871.10210.137039
8-0.083381-0.70750.240767
9-0.132764-1.12650.131838
10-0.024158-0.2050.419082
110.1224181.03870.151199
120.5496854.66427e-06
130.183761.55930.06166
14-0.002905-0.02470.490201
15-0.13426-1.13920.12919
16-0.074506-0.63220.264627
170.1026060.87060.193422
180.0462070.39210.348079
190.0797320.67660.25043
20-0.129369-1.09770.13799
21-0.165154-1.40140.082698
22-0.084352-0.71570.238231
230.0601830.51070.305573
240.3598523.05340.001585
250.0755110.64070.261864
260.0028870.02450.490263
27-0.113215-0.96070.169969
28-0.02081-0.17660.430169
290.0848250.71980.236999
30-0.067971-0.57670.282954
31-0.089232-0.75720.225712
32-0.211316-1.79310.03858
33-0.19901-1.68870.047806
34-0.07124-0.60450.273708
350.0575760.48850.313324
360.2516542.13540.018067
370.0076060.06450.474359
38-0.100401-0.85190.198538
39-0.134024-1.13720.129605
40-0.06733-0.57130.284784
410.021130.17930.429105
42-0.023504-0.19940.421241
43-0.08824-0.74870.228227
44-0.216579-1.83770.035114
45-0.181257-1.5380.064214
46-0.094111-0.79860.213586
470.0119260.10120.459838
480.171931.45890.074474

\begin{tabular}{lllllllll}
\hline
Autocorrelation Function \tabularnewline
Time lag k & ACF(k) & T-STAT & P-value \tabularnewline
1 & 0.342787 & 2.9086 & 0.002412 \tabularnewline
2 & 0.058229 & 0.4941 & 0.311372 \tabularnewline
3 & -0.133101 & -1.1294 & 0.131239 \tabularnewline
4 & -0.174184 & -1.478 & 0.071885 \tabularnewline
5 & 0.046839 & 0.3974 & 0.346107 \tabularnewline
6 & 0.092559 & 0.7854 & 0.217401 \tabularnewline
7 & 0.129887 & 1.1021 & 0.137039 \tabularnewline
8 & -0.083381 & -0.7075 & 0.240767 \tabularnewline
9 & -0.132764 & -1.1265 & 0.131838 \tabularnewline
10 & -0.024158 & -0.205 & 0.419082 \tabularnewline
11 & 0.122418 & 1.0387 & 0.151199 \tabularnewline
12 & 0.549685 & 4.6642 & 7e-06 \tabularnewline
13 & 0.18376 & 1.5593 & 0.06166 \tabularnewline
14 & -0.002905 & -0.0247 & 0.490201 \tabularnewline
15 & -0.13426 & -1.1392 & 0.12919 \tabularnewline
16 & -0.074506 & -0.6322 & 0.264627 \tabularnewline
17 & 0.102606 & 0.8706 & 0.193422 \tabularnewline
18 & 0.046207 & 0.3921 & 0.348079 \tabularnewline
19 & 0.079732 & 0.6766 & 0.25043 \tabularnewline
20 & -0.129369 & -1.0977 & 0.13799 \tabularnewline
21 & -0.165154 & -1.4014 & 0.082698 \tabularnewline
22 & -0.084352 & -0.7157 & 0.238231 \tabularnewline
23 & 0.060183 & 0.5107 & 0.305573 \tabularnewline
24 & 0.359852 & 3.0534 & 0.001585 \tabularnewline
25 & 0.075511 & 0.6407 & 0.261864 \tabularnewline
26 & 0.002887 & 0.0245 & 0.490263 \tabularnewline
27 & -0.113215 & -0.9607 & 0.169969 \tabularnewline
28 & -0.02081 & -0.1766 & 0.430169 \tabularnewline
29 & 0.084825 & 0.7198 & 0.236999 \tabularnewline
30 & -0.067971 & -0.5767 & 0.282954 \tabularnewline
31 & -0.089232 & -0.7572 & 0.225712 \tabularnewline
32 & -0.211316 & -1.7931 & 0.03858 \tabularnewline
33 & -0.19901 & -1.6887 & 0.047806 \tabularnewline
34 & -0.07124 & -0.6045 & 0.273708 \tabularnewline
35 & 0.057576 & 0.4885 & 0.313324 \tabularnewline
36 & 0.251654 & 2.1354 & 0.018067 \tabularnewline
37 & 0.007606 & 0.0645 & 0.474359 \tabularnewline
38 & -0.100401 & -0.8519 & 0.198538 \tabularnewline
39 & -0.134024 & -1.1372 & 0.129605 \tabularnewline
40 & -0.06733 & -0.5713 & 0.284784 \tabularnewline
41 & 0.02113 & 0.1793 & 0.429105 \tabularnewline
42 & -0.023504 & -0.1994 & 0.421241 \tabularnewline
43 & -0.08824 & -0.7487 & 0.228227 \tabularnewline
44 & -0.216579 & -1.8377 & 0.035114 \tabularnewline
45 & -0.181257 & -1.538 & 0.064214 \tabularnewline
46 & -0.094111 & -0.7986 & 0.213586 \tabularnewline
47 & 0.011926 & 0.1012 & 0.459838 \tabularnewline
48 & 0.17193 & 1.4589 & 0.074474 \tabularnewline
\hline
\end{tabular}
%Source: https://freestatistics.org/blog/index.php?pk=75548&T=1

[TABLE]
[ROW][C]Autocorrelation Function[/C][/ROW]
[ROW][C]Time lag k[/C][C]ACF(k)[/C][C]T-STAT[/C][C]P-value[/C][/ROW]
[ROW][C]1[/C][C]0.342787[/C][C]2.9086[/C][C]0.002412[/C][/ROW]
[ROW][C]2[/C][C]0.058229[/C][C]0.4941[/C][C]0.311372[/C][/ROW]
[ROW][C]3[/C][C]-0.133101[/C][C]-1.1294[/C][C]0.131239[/C][/ROW]
[ROW][C]4[/C][C]-0.174184[/C][C]-1.478[/C][C]0.071885[/C][/ROW]
[ROW][C]5[/C][C]0.046839[/C][C]0.3974[/C][C]0.346107[/C][/ROW]
[ROW][C]6[/C][C]0.092559[/C][C]0.7854[/C][C]0.217401[/C][/ROW]
[ROW][C]7[/C][C]0.129887[/C][C]1.1021[/C][C]0.137039[/C][/ROW]
[ROW][C]8[/C][C]-0.083381[/C][C]-0.7075[/C][C]0.240767[/C][/ROW]
[ROW][C]9[/C][C]-0.132764[/C][C]-1.1265[/C][C]0.131838[/C][/ROW]
[ROW][C]10[/C][C]-0.024158[/C][C]-0.205[/C][C]0.419082[/C][/ROW]
[ROW][C]11[/C][C]0.122418[/C][C]1.0387[/C][C]0.151199[/C][/ROW]
[ROW][C]12[/C][C]0.549685[/C][C]4.6642[/C][C]7e-06[/C][/ROW]
[ROW][C]13[/C][C]0.18376[/C][C]1.5593[/C][C]0.06166[/C][/ROW]
[ROW][C]14[/C][C]-0.002905[/C][C]-0.0247[/C][C]0.490201[/C][/ROW]
[ROW][C]15[/C][C]-0.13426[/C][C]-1.1392[/C][C]0.12919[/C][/ROW]
[ROW][C]16[/C][C]-0.074506[/C][C]-0.6322[/C][C]0.264627[/C][/ROW]
[ROW][C]17[/C][C]0.102606[/C][C]0.8706[/C][C]0.193422[/C][/ROW]
[ROW][C]18[/C][C]0.046207[/C][C]0.3921[/C][C]0.348079[/C][/ROW]
[ROW][C]19[/C][C]0.079732[/C][C]0.6766[/C][C]0.25043[/C][/ROW]
[ROW][C]20[/C][C]-0.129369[/C][C]-1.0977[/C][C]0.13799[/C][/ROW]
[ROW][C]21[/C][C]-0.165154[/C][C]-1.4014[/C][C]0.082698[/C][/ROW]
[ROW][C]22[/C][C]-0.084352[/C][C]-0.7157[/C][C]0.238231[/C][/ROW]
[ROW][C]23[/C][C]0.060183[/C][C]0.5107[/C][C]0.305573[/C][/ROW]
[ROW][C]24[/C][C]0.359852[/C][C]3.0534[/C][C]0.001585[/C][/ROW]
[ROW][C]25[/C][C]0.075511[/C][C]0.6407[/C][C]0.261864[/C][/ROW]
[ROW][C]26[/C][C]0.002887[/C][C]0.0245[/C][C]0.490263[/C][/ROW]
[ROW][C]27[/C][C]-0.113215[/C][C]-0.9607[/C][C]0.169969[/C][/ROW]
[ROW][C]28[/C][C]-0.02081[/C][C]-0.1766[/C][C]0.430169[/C][/ROW]
[ROW][C]29[/C][C]0.084825[/C][C]0.7198[/C][C]0.236999[/C][/ROW]
[ROW][C]30[/C][C]-0.067971[/C][C]-0.5767[/C][C]0.282954[/C][/ROW]
[ROW][C]31[/C][C]-0.089232[/C][C]-0.7572[/C][C]0.225712[/C][/ROW]
[ROW][C]32[/C][C]-0.211316[/C][C]-1.7931[/C][C]0.03858[/C][/ROW]
[ROW][C]33[/C][C]-0.19901[/C][C]-1.6887[/C][C]0.047806[/C][/ROW]
[ROW][C]34[/C][C]-0.07124[/C][C]-0.6045[/C][C]0.273708[/C][/ROW]
[ROW][C]35[/C][C]0.057576[/C][C]0.4885[/C][C]0.313324[/C][/ROW]
[ROW][C]36[/C][C]0.251654[/C][C]2.1354[/C][C]0.018067[/C][/ROW]
[ROW][C]37[/C][C]0.007606[/C][C]0.0645[/C][C]0.474359[/C][/ROW]
[ROW][C]38[/C][C]-0.100401[/C][C]-0.8519[/C][C]0.198538[/C][/ROW]
[ROW][C]39[/C][C]-0.134024[/C][C]-1.1372[/C][C]0.129605[/C][/ROW]
[ROW][C]40[/C][C]-0.06733[/C][C]-0.5713[/C][C]0.284784[/C][/ROW]
[ROW][C]41[/C][C]0.02113[/C][C]0.1793[/C][C]0.429105[/C][/ROW]
[ROW][C]42[/C][C]-0.023504[/C][C]-0.1994[/C][C]0.421241[/C][/ROW]
[ROW][C]43[/C][C]-0.08824[/C][C]-0.7487[/C][C]0.228227[/C][/ROW]
[ROW][C]44[/C][C]-0.216579[/C][C]-1.8377[/C][C]0.035114[/C][/ROW]
[ROW][C]45[/C][C]-0.181257[/C][C]-1.538[/C][C]0.064214[/C][/ROW]
[ROW][C]46[/C][C]-0.094111[/C][C]-0.7986[/C][C]0.213586[/C][/ROW]
[ROW][C]47[/C][C]0.011926[/C][C]0.1012[/C][C]0.459838[/C][/ROW]
[ROW][C]48[/C][C]0.17193[/C][C]1.4589[/C][C]0.074474[/C][/ROW]
[/TABLE]
Source: https://freestatistics.org/blog/index.php?pk=75548&T=1

Globally Unique Identifier (entire table): ba.freestatistics.org/blog/index.php?pk=75548&T=1

As an alternative you can also use a QR Code:  

The GUIDs for individual cells are displayed in the table below:

Autocorrelation Function
Time lag kACF(k)T-STATP-value
10.3427872.90860.002412
20.0582290.49410.311372
3-0.133101-1.12940.131239
4-0.174184-1.4780.071885
50.0468390.39740.346107
60.0925590.78540.217401
70.1298871.10210.137039
8-0.083381-0.70750.240767
9-0.132764-1.12650.131838
10-0.024158-0.2050.419082
110.1224181.03870.151199
120.5496854.66427e-06
130.183761.55930.06166
14-0.002905-0.02470.490201
15-0.13426-1.13920.12919
16-0.074506-0.63220.264627
170.1026060.87060.193422
180.0462070.39210.348079
190.0797320.67660.25043
20-0.129369-1.09770.13799
21-0.165154-1.40140.082698
22-0.084352-0.71570.238231
230.0601830.51070.305573
240.3598523.05340.001585
250.0755110.64070.261864
260.0028870.02450.490263
27-0.113215-0.96070.169969
28-0.02081-0.17660.430169
290.0848250.71980.236999
30-0.067971-0.57670.282954
31-0.089232-0.75720.225712
32-0.211316-1.79310.03858
33-0.19901-1.68870.047806
34-0.07124-0.60450.273708
350.0575760.48850.313324
360.2516542.13540.018067
370.0076060.06450.474359
38-0.100401-0.85190.198538
39-0.134024-1.13720.129605
40-0.06733-0.57130.284784
410.021130.17930.429105
42-0.023504-0.19940.421241
43-0.08824-0.74870.228227
44-0.216579-1.83770.035114
45-0.181257-1.5380.064214
46-0.094111-0.79860.213586
470.0119260.10120.459838
480.171931.45890.074474


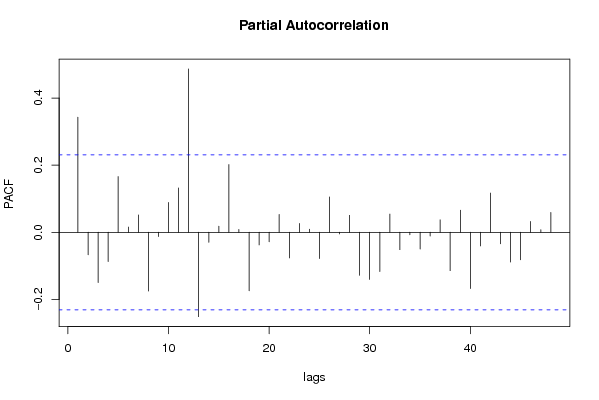
Partial Autocorrelation Function
Time lag kPACF(k)T-STATP-value
10.3427872.90860.002412
2-0.067165-0.56990.285254
3-0.149546-1.26890.104274
4-0.087141-0.73940.231029
50.1660221.40870.081607
60.0155580.1320.447672
70.0517320.4390.331002
8-0.175059-1.48540.070898
9-0.012361-0.10490.458379
100.0887330.75290.226976
110.1320331.12030.133147
120.4865864.12884.8e-05
13-0.251235-2.13180.018218
14-0.029469-0.25010.40163
150.0179860.15260.439565
160.2016231.71080.045709
170.0081930.06950.472385
18-0.174082-1.47710.072
19-0.037438-0.31770.375826
20-0.027967-0.23730.406547
210.0532970.45220.326227
22-0.076301-0.64740.259704
230.0261620.2220.412476
240.0093170.07910.468602
25-0.077848-0.66060.255501
260.1051210.8920.187686
27-0.004842-0.04110.483669
280.0504770.42830.334851
29-0.12816-1.08750.140227
30-0.140329-1.19070.118835
31-0.116603-0.98940.162889
320.0542050.45990.32347
33-0.051726-0.43890.331022
34-0.007417-0.06290.474997
35-0.049796-0.42250.336949
36-0.011039-0.09370.462816
370.0371380.31510.376789
38-0.114249-0.96940.167786
390.0659310.55940.288798
40-0.16726-1.41920.080071
41-0.040557-0.34410.365873
420.116850.99150.16238
43-0.034086-0.28920.386617
44-0.08828-0.74910.228124
45-0.081722-0.69340.245133
460.0320680.27210.393159
470.0074250.0630.474969
480.0590780.50130.308846

\begin{tabular}{lllllllll}
\hline
Partial Autocorrelation Function \tabularnewline
Time lag k & PACF(k) & T-STAT & P-value \tabularnewline
1 & 0.342787 & 2.9086 & 0.002412 \tabularnewline
2 & -0.067165 & -0.5699 & 0.285254 \tabularnewline
3 & -0.149546 & -1.2689 & 0.104274 \tabularnewline
4 & -0.087141 & -0.7394 & 0.231029 \tabularnewline
5 & 0.166022 & 1.4087 & 0.081607 \tabularnewline
6 & 0.015558 & 0.132 & 0.447672 \tabularnewline
7 & 0.051732 & 0.439 & 0.331002 \tabularnewline
8 & -0.175059 & -1.4854 & 0.070898 \tabularnewline
9 & -0.012361 & -0.1049 & 0.458379 \tabularnewline
10 & 0.088733 & 0.7529 & 0.226976 \tabularnewline
11 & 0.132033 & 1.1203 & 0.133147 \tabularnewline
12 & 0.486586 & 4.1288 & 4.8e-05 \tabularnewline
13 & -0.251235 & -2.1318 & 0.018218 \tabularnewline
14 & -0.029469 & -0.2501 & 0.40163 \tabularnewline
15 & 0.017986 & 0.1526 & 0.439565 \tabularnewline
16 & 0.201623 & 1.7108 & 0.045709 \tabularnewline
17 & 0.008193 & 0.0695 & 0.472385 \tabularnewline
18 & -0.174082 & -1.4771 & 0.072 \tabularnewline
19 & -0.037438 & -0.3177 & 0.375826 \tabularnewline
20 & -0.027967 & -0.2373 & 0.406547 \tabularnewline
21 & 0.053297 & 0.4522 & 0.326227 \tabularnewline
22 & -0.076301 & -0.6474 & 0.259704 \tabularnewline
23 & 0.026162 & 0.222 & 0.412476 \tabularnewline
24 & 0.009317 & 0.0791 & 0.468602 \tabularnewline
25 & -0.077848 & -0.6606 & 0.255501 \tabularnewline
26 & 0.105121 & 0.892 & 0.187686 \tabularnewline
27 & -0.004842 & -0.0411 & 0.483669 \tabularnewline
28 & 0.050477 & 0.4283 & 0.334851 \tabularnewline
29 & -0.12816 & -1.0875 & 0.140227 \tabularnewline
30 & -0.140329 & -1.1907 & 0.118835 \tabularnewline
31 & -0.116603 & -0.9894 & 0.162889 \tabularnewline
32 & 0.054205 & 0.4599 & 0.32347 \tabularnewline
33 & -0.051726 & -0.4389 & 0.331022 \tabularnewline
34 & -0.007417 & -0.0629 & 0.474997 \tabularnewline
35 & -0.049796 & -0.4225 & 0.336949 \tabularnewline
36 & -0.011039 & -0.0937 & 0.462816 \tabularnewline
37 & 0.037138 & 0.3151 & 0.376789 \tabularnewline
38 & -0.114249 & -0.9694 & 0.167786 \tabularnewline
39 & 0.065931 & 0.5594 & 0.288798 \tabularnewline
40 & -0.16726 & -1.4192 & 0.080071 \tabularnewline
41 & -0.040557 & -0.3441 & 0.365873 \tabularnewline
42 & 0.11685 & 0.9915 & 0.16238 \tabularnewline
43 & -0.034086 & -0.2892 & 0.386617 \tabularnewline
44 & -0.08828 & -0.7491 & 0.228124 \tabularnewline
45 & -0.081722 & -0.6934 & 0.245133 \tabularnewline
46 & 0.032068 & 0.2721 & 0.393159 \tabularnewline
47 & 0.007425 & 0.063 & 0.474969 \tabularnewline
48 & 0.059078 & 0.5013 & 0.308846 \tabularnewline
\hline
\end{tabular}
%Source: https://freestatistics.org/blog/index.php?pk=75548&T=2

[TABLE]
[ROW][C]Partial Autocorrelation Function[/C][/ROW]
[ROW][C]Time lag k[/C][C]PACF(k)[/C][C]T-STAT[/C][C]P-value[/C][/ROW]
[ROW][C]1[/C][C]0.342787[/C][C]2.9086[/C][C]0.002412[/C][/ROW]
[ROW][C]2[/C][C]-0.067165[/C][C]-0.5699[/C][C]0.285254[/C][/ROW]
[ROW][C]3[/C][C]-0.149546[/C][C]-1.2689[/C][C]0.104274[/C][/ROW]
[ROW][C]4[/C][C]-0.087141[/C][C]-0.7394[/C][C]0.231029[/C][/ROW]
[ROW][C]5[/C][C]0.166022[/C][C]1.4087[/C][C]0.081607[/C][/ROW]
[ROW][C]6[/C][C]0.015558[/C][C]0.132[/C][C]0.447672[/C][/ROW]
[ROW][C]7[/C][C]0.051732[/C][C]0.439[/C][C]0.331002[/C][/ROW]
[ROW][C]8[/C][C]-0.175059[/C][C]-1.4854[/C][C]0.070898[/C][/ROW]
[ROW][C]9[/C][C]-0.012361[/C][C]-0.1049[/C][C]0.458379[/C][/ROW]
[ROW][C]10[/C][C]0.088733[/C][C]0.7529[/C][C]0.226976[/C][/ROW]
[ROW][C]11[/C][C]0.132033[/C][C]1.1203[/C][C]0.133147[/C][/ROW]
[ROW][C]12[/C][C]0.486586[/C][C]4.1288[/C][C]4.8e-05[/C][/ROW]
[ROW][C]13[/C][C]-0.251235[/C][C]-2.1318[/C][C]0.018218[/C][/ROW]
[ROW][C]14[/C][C]-0.029469[/C][C]-0.2501[/C][C]0.40163[/C][/ROW]
[ROW][C]15[/C][C]0.017986[/C][C]0.1526[/C][C]0.439565[/C][/ROW]
[ROW][C]16[/C][C]0.201623[/C][C]1.7108[/C][C]0.045709[/C][/ROW]
[ROW][C]17[/C][C]0.008193[/C][C]0.0695[/C][C]0.472385[/C][/ROW]
[ROW][C]18[/C][C]-0.174082[/C][C]-1.4771[/C][C]0.072[/C][/ROW]
[ROW][C]19[/C][C]-0.037438[/C][C]-0.3177[/C][C]0.375826[/C][/ROW]
[ROW][C]20[/C][C]-0.027967[/C][C]-0.2373[/C][C]0.406547[/C][/ROW]
[ROW][C]21[/C][C]0.053297[/C][C]0.4522[/C][C]0.326227[/C][/ROW]
[ROW][C]22[/C][C]-0.076301[/C][C]-0.6474[/C][C]0.259704[/C][/ROW]
[ROW][C]23[/C][C]0.026162[/C][C]0.222[/C][C]0.412476[/C][/ROW]
[ROW][C]24[/C][C]0.009317[/C][C]0.0791[/C][C]0.468602[/C][/ROW]
[ROW][C]25[/C][C]-0.077848[/C][C]-0.6606[/C][C]0.255501[/C][/ROW]
[ROW][C]26[/C][C]0.105121[/C][C]0.892[/C][C]0.187686[/C][/ROW]
[ROW][C]27[/C][C]-0.004842[/C][C]-0.0411[/C][C]0.483669[/C][/ROW]
[ROW][C]28[/C][C]0.050477[/C][C]0.4283[/C][C]0.334851[/C][/ROW]
[ROW][C]29[/C][C]-0.12816[/C][C]-1.0875[/C][C]0.140227[/C][/ROW]
[ROW][C]30[/C][C]-0.140329[/C][C]-1.1907[/C][C]0.118835[/C][/ROW]
[ROW][C]31[/C][C]-0.116603[/C][C]-0.9894[/C][C]0.162889[/C][/ROW]
[ROW][C]32[/C][C]0.054205[/C][C]0.4599[/C][C]0.32347[/C][/ROW]
[ROW][C]33[/C][C]-0.051726[/C][C]-0.4389[/C][C]0.331022[/C][/ROW]
[ROW][C]34[/C][C]-0.007417[/C][C]-0.0629[/C][C]0.474997[/C][/ROW]
[ROW][C]35[/C][C]-0.049796[/C][C]-0.4225[/C][C]0.336949[/C][/ROW]
[ROW][C]36[/C][C]-0.011039[/C][C]-0.0937[/C][C]0.462816[/C][/ROW]
[ROW][C]37[/C][C]0.037138[/C][C]0.3151[/C][C]0.376789[/C][/ROW]
[ROW][C]38[/C][C]-0.114249[/C][C]-0.9694[/C][C]0.167786[/C][/ROW]
[ROW][C]39[/C][C]0.065931[/C][C]0.5594[/C][C]0.288798[/C][/ROW]
[ROW][C]40[/C][C]-0.16726[/C][C]-1.4192[/C][C]0.080071[/C][/ROW]
[ROW][C]41[/C][C]-0.040557[/C][C]-0.3441[/C][C]0.365873[/C][/ROW]
[ROW][C]42[/C][C]0.11685[/C][C]0.9915[/C][C]0.16238[/C][/ROW]
[ROW][C]43[/C][C]-0.034086[/C][C]-0.2892[/C][C]0.386617[/C][/ROW]
[ROW][C]44[/C][C]-0.08828[/C][C]-0.7491[/C][C]0.228124[/C][/ROW]
[ROW][C]45[/C][C]-0.081722[/C][C]-0.6934[/C][C]0.245133[/C][/ROW]
[ROW][C]46[/C][C]0.032068[/C][C]0.2721[/C][C]0.393159[/C][/ROW]
[ROW][C]47[/C][C]0.007425[/C][C]0.063[/C][C]0.474969[/C][/ROW]
[ROW][C]48[/C][C]0.059078[/C][C]0.5013[/C][C]0.308846[/C][/ROW]
[/TABLE]
Source: https://freestatistics.org/blog/index.php?pk=75548&T=2

Globally Unique Identifier (entire table): ba.freestatistics.org/blog/index.php?pk=75548&T=2

As an alternative you can also use a QR Code:  

The GUIDs for individual cells are displayed in the table below:

Partial Autocorrelation Function
Time lag kPACF(k)T-STATP-value
10.3427872.90860.002412
2-0.067165-0.56990.285254
3-0.149546-1.26890.104274
4-0.087141-0.73940.231029
50.1660221.40870.081607
60.0155580.1320.447672
70.0517320.4390.331002
8-0.175059-1.48540.070898
9-0.012361-0.10490.458379
100.0887330.75290.226976
110.1320331.12030.133147
120.4865864.12884.8e-05
13-0.251235-2.13180.018218
14-0.029469-0.25010.40163
150.0179860.15260.439565
160.2016231.71080.045709
170.0081930.06950.472385
18-0.174082-1.47710.072
19-0.037438-0.31770.375826
20-0.027967-0.23730.406547
210.0532970.45220.326227
22-0.076301-0.64740.259704
230.0261620.2220.412476
240.0093170.07910.468602
25-0.077848-0.66060.255501
260.1051210.8920.187686
27-0.004842-0.04110.483669
280.0504770.42830.334851
29-0.12816-1.08750.140227
30-0.140329-1.19070.118835
31-0.116603-0.98940.162889
320.0542050.45990.32347
33-0.051726-0.43890.331022
34-0.007417-0.06290.474997
35-0.049796-0.42250.336949
36-0.011039-0.09370.462816
370.0371380.31510.376789
38-0.114249-0.96940.167786
390.0659310.55940.288798
40-0.16726-1.41920.080071
41-0.040557-0.34410.365873
420.116850.99150.16238
43-0.034086-0.28920.386617
44-0.08828-0.74910.228124
45-0.081722-0.69340.245133
460.0320680.27210.393159
470.0074250.0630.474969
480.0590780.50130.308846


Parameters (Session):
par1 = 48 ; par2 = 1 ; par3 = 0 ; par4 = 0 ; par5 = 12 ; par6 = White Noise ; par7 = 0.95 ;
Parameters (R input):
par1 = 48 ; par2 = 1 ; par3 = 0 ; par4 = 0 ; par5 = 12 ; par6 = White Noise ; par7 = 0.95 ;
R code (references can be found in the software module):
if (par1 == 'Default') {
par1 = 10*log10(length(x))
} else {
par1 <- as.numeric(par1)
}
par2 <- as.numeric(par2)
par3 <- as.numeric(par3)
par4 <- as.numeric(par4)
par5 <- as.numeric(par5)
if (par6 == 'White Noise') par6 <- 'white' else par6 <- 'ma'
par7 <- as.numeric(par7)
if (par2 == 0) {
x <- log(x)
} else {
x <- (x ^ par2 - 1) / par2
}
if (par3 > 0) x <- diff(x,lag=1,difference=par3)
if (par4 > 0) x <- diff(x,lag=par5,difference=par4)
bitmap(file='pic1.png')
racf <- acf(x, par1, main='Autocorrelation', xlab='time lag', ylab='ACF', ci.type=par6, ci=par7, sub=paste('(lambda=',par2,', d=',par3,', D=',par4,', CI=', par7, ', CI type=',par6,')',sep=''))
dev.off()
bitmap(file='pic2.png')
rpacf <- pacf(x,par1,main='Partial Autocorrelation',xlab='lags',ylab='PACF')
dev.off()
(myacf <- c(racf$acf))
(mypacf <- c(rpacf$acf))
lengthx <- length(x)
sqrtn <- sqrt(lengthx)
load(file='createtable')
a<-table.start()
a<-table.row.start(a)
a<-table.element(a,'Autocorrelation Function',4,TRUE)
a<-table.row.end(a)
a<-table.row.start(a)
a<-table.element(a,'Time lag k',header=TRUE)
a<-table.element(a,hyperlink('basics.htm','ACF(k)','click here for more information about the Autocorrelation Function'),header=TRUE)
a<-table.element(a,'T-STAT',header=TRUE)
a<-table.element(a,'P-value',header=TRUE)
a<-table.row.end(a)
for (i in 2:(par1+1)) {
a<-table.row.start(a)
a<-table.element(a,i-1,header=TRUE)
a<-table.element(a,round(myacf[i],6))
mytstat <- myacf[i]*sqrtn
a<-table.element(a,round(mytstat,4))
a<-table.element(a,round(1-pt(abs(mytstat),lengthx),6))
a<-table.row.end(a)
}
a<-table.end(a)
table.save(a,file='mytable.tab')
a<-table.start()
a<-table.row.start(a)
a<-table.element(a,'Partial Autocorrelation Function',4,TRUE)
a<-table.row.end(a)
a<-table.row.start(a)
a<-table.element(a,'Time lag k',header=TRUE)
a<-table.element(a,hyperlink('basics.htm','PACF(k)','click here for more information about the Partial Autocorrelation Function'),header=TRUE)
a<-table.element(a,'T-STAT',header=TRUE)
a<-table.element(a,'P-value',header=TRUE)
a<-table.row.end(a)
for (i in 1:par1) {
a<-table.row.start(a)
a<-table.element(a,i,header=TRUE)
a<-table.element(a,round(mypacf[i],6))
mytstat <- mypacf[i]*sqrtn
a<-table.element(a,round(mytstat,4))
a<-table.element(a,round(1-pt(abs(mytstat),lengthx),6))
a<-table.row.end(a)
}
a<-table.end(a)
table.save(a,file='mytable1.tab')