Free Statistics

of Irreproducible Research!

Author's title

Author*Unverified author*
R Software Modulerwasp_autocorrelation.wasp
Title produced by software(Partial) Autocorrelation Function
Date of computationWed, 05 May 2010 16:27:58 +0000
Cite this page as followsStatistical Computations at FreeStatistics.org, Office for Research Development and Education, URL https://freestatistics.org/blog/index.php?v=date/2010/May/05/t1273076967f039g7jg7wus2iv.htm/, Retrieved Sun, 28 Apr 2024 07:23:47 +0000
Statistical Computations at FreeStatistics.org, Office for Research Development and Education, URL https://freestatistics.org/blog/index.php?pk=75551, Retrieved Sun, 28 Apr 2024 07:23:47 +0000
QR Codes:

Original text written by user:
IsPrivate?No (this computation is public)
User-defined keywordsKDGP2W21
Estimated Impact129
Family? (F = Feedback message, R = changed R code, M = changed R Module, P = changed Parameters, D = changed Data)
-       [(Partial) Autocorrelation Function] [] [2010-05-05 16:27:58] [4b0ce05bd143e68bee12076814fe6457] [Current]
Feedback Forum

Post a new message
Dataseries X:
8027.7
8059.6
8059.5
7988.9
7950.2
8003.8
8037.5
8069
8157.6
8244.3
8329.4
8417
8432.5
8486.4
8531.1
8643.8
8727.9
8847.3
8904.3
9003.2
9025.3
9044.7
9120.7
9184.3
9247.2
9407.1
9488.9
9592.5
9666.2
9809.6
9932.7
10008.9
10103.4
10194.3
10328.8
10507.6
10601.2
10684
10819.9
11014.3
11043
11258.5
11267.9
11334.5
11297.2
11371.3
11340.1
11380.1
11477.9
11538.8
11596.4
11598.8
11645.8
11738.7
11935.5
12042.8
12127.6
12213.8
12303.5
12410.3
12534.1
12587.5
12683.2
12748.7
12915.9
12962.5
12965.9
13060.7
13099.9
13204
13321.1
13391.2
13366.9
13415.3
13324.6
13141.9
12925.4
12901.5
12973
13155


Summary of computational transaction
Raw Inputview raw input (R code)
Raw Outputview raw output of R engine
Computing time4 seconds
R Server'George Udny Yule' @ 72.249.76.132

\begin{tabular}{lllllllll}
\hline
Summary of computational transaction \tabularnewline
Raw Input & view raw input (R code)  \tabularnewline
Raw Output & view raw output of R engine  \tabularnewline
Computing time & 4 seconds \tabularnewline
R Server & 'George Udny Yule' @ 72.249.76.132 \tabularnewline
\hline
\end{tabular}
%Source: https://freestatistics.org/blog/index.php?pk=75551&T=0

[TABLE]
[ROW][C]Summary of computational transaction[/C][/ROW]
[ROW][C]Raw Input[/C][C]view raw input (R code) [/C][/ROW]
[ROW][C]Raw Output[/C][C]view raw output of R engine [/C][/ROW]
[ROW][C]Computing time[/C][C]4 seconds[/C][/ROW]
[ROW][C]R Server[/C][C]'George Udny Yule' @ 72.249.76.132[/C][/ROW]
[/TABLE]
Source: https://freestatistics.org/blog/index.php?pk=75551&T=0

Globally Unique Identifier (entire table): ba.freestatistics.org/blog/index.php?pk=75551&T=0

As an alternative you can also use a QR Code:  

The GUIDs for individual cells are displayed in the table below:

Summary of computational transaction
Raw Inputview raw input (R code)
Raw Outputview raw output of R engine
Computing time4 seconds
R Server'George Udny Yule' @ 72.249.76.132


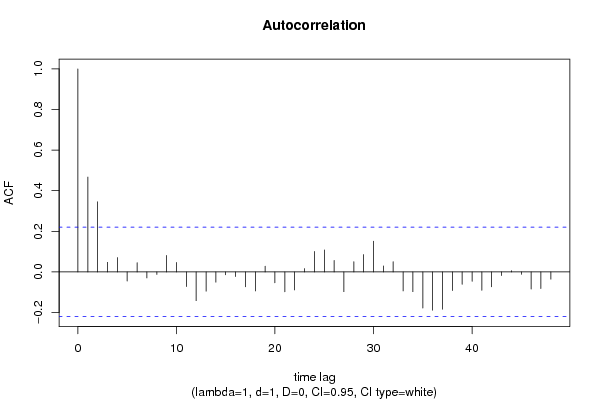
Autocorrelation Function
Time lag kACF(k)T-STATP-value
10.4673034.15354.1e-05
20.3452713.06880.001472
30.0473890.42120.337376
40.0703650.62540.266751
5-0.045368-0.40320.34393
60.0453590.40320.343961
7-0.029667-0.26370.396355
8-0.012729-0.11310.455105
90.0809760.71970.236907
100.0465930.41410.339952
11-0.072319-0.64280.261113
12-0.141771-1.26010.105674
13-0.095138-0.84560.200164
14-0.05066-0.45030.326871
15-0.014235-0.12650.449821
16-0.022847-0.20310.419803
17-0.073743-0.65540.257043
18-0.09362-0.83210.203928
190.0278950.24790.402414
20-0.053559-0.4760.31768
21-0.098334-0.8740.19238
22-0.089094-0.79190.215401
230.0163190.1450.442523
240.1008350.89620.186424
250.1084720.96410.168963
260.0563290.50070.309
27-0.097228-0.86420.195052
280.0501850.44610.328388
290.0857220.76190.22419
300.1511061.34310.091549
310.0292080.25960.397922
320.0500550.44490.328804
33-0.09409-0.83630.202757
34-0.097489-0.86650.19442
35-0.17798-1.58190.058831
36-0.18856-1.6760.04885
37-0.18368-1.63260.053268
38-0.091802-0.8160.208491
39-0.060987-0.54210.294649
40-0.046507-0.41340.340231
41-0.090965-0.80850.210611
42-0.073367-0.65210.258113
43-0.017899-0.15910.437003
440.0059980.05330.47881
45-0.012153-0.1080.457129
46-0.084575-0.75170.227227
47-0.082265-0.73120.233414
48-0.036233-0.3220.374134

\begin{tabular}{lllllllll}
\hline
Autocorrelation Function \tabularnewline
Time lag k & ACF(k) & T-STAT & P-value \tabularnewline
1 & 0.467303 & 4.1535 & 4.1e-05 \tabularnewline
2 & 0.345271 & 3.0688 & 0.001472 \tabularnewline
3 & 0.047389 & 0.4212 & 0.337376 \tabularnewline
4 & 0.070365 & 0.6254 & 0.266751 \tabularnewline
5 & -0.045368 & -0.4032 & 0.34393 \tabularnewline
6 & 0.045359 & 0.4032 & 0.343961 \tabularnewline
7 & -0.029667 & -0.2637 & 0.396355 \tabularnewline
8 & -0.012729 & -0.1131 & 0.455105 \tabularnewline
9 & 0.080976 & 0.7197 & 0.236907 \tabularnewline
10 & 0.046593 & 0.4141 & 0.339952 \tabularnewline
11 & -0.072319 & -0.6428 & 0.261113 \tabularnewline
12 & -0.141771 & -1.2601 & 0.105674 \tabularnewline
13 & -0.095138 & -0.8456 & 0.200164 \tabularnewline
14 & -0.05066 & -0.4503 & 0.326871 \tabularnewline
15 & -0.014235 & -0.1265 & 0.449821 \tabularnewline
16 & -0.022847 & -0.2031 & 0.419803 \tabularnewline
17 & -0.073743 & -0.6554 & 0.257043 \tabularnewline
18 & -0.09362 & -0.8321 & 0.203928 \tabularnewline
19 & 0.027895 & 0.2479 & 0.402414 \tabularnewline
20 & -0.053559 & -0.476 & 0.31768 \tabularnewline
21 & -0.098334 & -0.874 & 0.19238 \tabularnewline
22 & -0.089094 & -0.7919 & 0.215401 \tabularnewline
23 & 0.016319 & 0.145 & 0.442523 \tabularnewline
24 & 0.100835 & 0.8962 & 0.186424 \tabularnewline
25 & 0.108472 & 0.9641 & 0.168963 \tabularnewline
26 & 0.056329 & 0.5007 & 0.309 \tabularnewline
27 & -0.097228 & -0.8642 & 0.195052 \tabularnewline
28 & 0.050185 & 0.4461 & 0.328388 \tabularnewline
29 & 0.085722 & 0.7619 & 0.22419 \tabularnewline
30 & 0.151106 & 1.3431 & 0.091549 \tabularnewline
31 & 0.029208 & 0.2596 & 0.397922 \tabularnewline
32 & 0.050055 & 0.4449 & 0.328804 \tabularnewline
33 & -0.09409 & -0.8363 & 0.202757 \tabularnewline
34 & -0.097489 & -0.8665 & 0.19442 \tabularnewline
35 & -0.17798 & -1.5819 & 0.058831 \tabularnewline
36 & -0.18856 & -1.676 & 0.04885 \tabularnewline
37 & -0.18368 & -1.6326 & 0.053268 \tabularnewline
38 & -0.091802 & -0.816 & 0.208491 \tabularnewline
39 & -0.060987 & -0.5421 & 0.294649 \tabularnewline
40 & -0.046507 & -0.4134 & 0.340231 \tabularnewline
41 & -0.090965 & -0.8085 & 0.210611 \tabularnewline
42 & -0.073367 & -0.6521 & 0.258113 \tabularnewline
43 & -0.017899 & -0.1591 & 0.437003 \tabularnewline
44 & 0.005998 & 0.0533 & 0.47881 \tabularnewline
45 & -0.012153 & -0.108 & 0.457129 \tabularnewline
46 & -0.084575 & -0.7517 & 0.227227 \tabularnewline
47 & -0.082265 & -0.7312 & 0.233414 \tabularnewline
48 & -0.036233 & -0.322 & 0.374134 \tabularnewline
\hline
\end{tabular}
%Source: https://freestatistics.org/blog/index.php?pk=75551&T=1

[TABLE]
[ROW][C]Autocorrelation Function[/C][/ROW]
[ROW][C]Time lag k[/C][C]ACF(k)[/C][C]T-STAT[/C][C]P-value[/C][/ROW]
[ROW][C]1[/C][C]0.467303[/C][C]4.1535[/C][C]4.1e-05[/C][/ROW]
[ROW][C]2[/C][C]0.345271[/C][C]3.0688[/C][C]0.001472[/C][/ROW]
[ROW][C]3[/C][C]0.047389[/C][C]0.4212[/C][C]0.337376[/C][/ROW]
[ROW][C]4[/C][C]0.070365[/C][C]0.6254[/C][C]0.266751[/C][/ROW]
[ROW][C]5[/C][C]-0.045368[/C][C]-0.4032[/C][C]0.34393[/C][/ROW]
[ROW][C]6[/C][C]0.045359[/C][C]0.4032[/C][C]0.343961[/C][/ROW]
[ROW][C]7[/C][C]-0.029667[/C][C]-0.2637[/C][C]0.396355[/C][/ROW]
[ROW][C]8[/C][C]-0.012729[/C][C]-0.1131[/C][C]0.455105[/C][/ROW]
[ROW][C]9[/C][C]0.080976[/C][C]0.7197[/C][C]0.236907[/C][/ROW]
[ROW][C]10[/C][C]0.046593[/C][C]0.4141[/C][C]0.339952[/C][/ROW]
[ROW][C]11[/C][C]-0.072319[/C][C]-0.6428[/C][C]0.261113[/C][/ROW]
[ROW][C]12[/C][C]-0.141771[/C][C]-1.2601[/C][C]0.105674[/C][/ROW]
[ROW][C]13[/C][C]-0.095138[/C][C]-0.8456[/C][C]0.200164[/C][/ROW]
[ROW][C]14[/C][C]-0.05066[/C][C]-0.4503[/C][C]0.326871[/C][/ROW]
[ROW][C]15[/C][C]-0.014235[/C][C]-0.1265[/C][C]0.449821[/C][/ROW]
[ROW][C]16[/C][C]-0.022847[/C][C]-0.2031[/C][C]0.419803[/C][/ROW]
[ROW][C]17[/C][C]-0.073743[/C][C]-0.6554[/C][C]0.257043[/C][/ROW]
[ROW][C]18[/C][C]-0.09362[/C][C]-0.8321[/C][C]0.203928[/C][/ROW]
[ROW][C]19[/C][C]0.027895[/C][C]0.2479[/C][C]0.402414[/C][/ROW]
[ROW][C]20[/C][C]-0.053559[/C][C]-0.476[/C][C]0.31768[/C][/ROW]
[ROW][C]21[/C][C]-0.098334[/C][C]-0.874[/C][C]0.19238[/C][/ROW]
[ROW][C]22[/C][C]-0.089094[/C][C]-0.7919[/C][C]0.215401[/C][/ROW]
[ROW][C]23[/C][C]0.016319[/C][C]0.145[/C][C]0.442523[/C][/ROW]
[ROW][C]24[/C][C]0.100835[/C][C]0.8962[/C][C]0.186424[/C][/ROW]
[ROW][C]25[/C][C]0.108472[/C][C]0.9641[/C][C]0.168963[/C][/ROW]
[ROW][C]26[/C][C]0.056329[/C][C]0.5007[/C][C]0.309[/C][/ROW]
[ROW][C]27[/C][C]-0.097228[/C][C]-0.8642[/C][C]0.195052[/C][/ROW]
[ROW][C]28[/C][C]0.050185[/C][C]0.4461[/C][C]0.328388[/C][/ROW]
[ROW][C]29[/C][C]0.085722[/C][C]0.7619[/C][C]0.22419[/C][/ROW]
[ROW][C]30[/C][C]0.151106[/C][C]1.3431[/C][C]0.091549[/C][/ROW]
[ROW][C]31[/C][C]0.029208[/C][C]0.2596[/C][C]0.397922[/C][/ROW]
[ROW][C]32[/C][C]0.050055[/C][C]0.4449[/C][C]0.328804[/C][/ROW]
[ROW][C]33[/C][C]-0.09409[/C][C]-0.8363[/C][C]0.202757[/C][/ROW]
[ROW][C]34[/C][C]-0.097489[/C][C]-0.8665[/C][C]0.19442[/C][/ROW]
[ROW][C]35[/C][C]-0.17798[/C][C]-1.5819[/C][C]0.058831[/C][/ROW]
[ROW][C]36[/C][C]-0.18856[/C][C]-1.676[/C][C]0.04885[/C][/ROW]
[ROW][C]37[/C][C]-0.18368[/C][C]-1.6326[/C][C]0.053268[/C][/ROW]
[ROW][C]38[/C][C]-0.091802[/C][C]-0.816[/C][C]0.208491[/C][/ROW]
[ROW][C]39[/C][C]-0.060987[/C][C]-0.5421[/C][C]0.294649[/C][/ROW]
[ROW][C]40[/C][C]-0.046507[/C][C]-0.4134[/C][C]0.340231[/C][/ROW]
[ROW][C]41[/C][C]-0.090965[/C][C]-0.8085[/C][C]0.210611[/C][/ROW]
[ROW][C]42[/C][C]-0.073367[/C][C]-0.6521[/C][C]0.258113[/C][/ROW]
[ROW][C]43[/C][C]-0.017899[/C][C]-0.1591[/C][C]0.437003[/C][/ROW]
[ROW][C]44[/C][C]0.005998[/C][C]0.0533[/C][C]0.47881[/C][/ROW]
[ROW][C]45[/C][C]-0.012153[/C][C]-0.108[/C][C]0.457129[/C][/ROW]
[ROW][C]46[/C][C]-0.084575[/C][C]-0.7517[/C][C]0.227227[/C][/ROW]
[ROW][C]47[/C][C]-0.082265[/C][C]-0.7312[/C][C]0.233414[/C][/ROW]
[ROW][C]48[/C][C]-0.036233[/C][C]-0.322[/C][C]0.374134[/C][/ROW]
[/TABLE]
Source: https://freestatistics.org/blog/index.php?pk=75551&T=1

Globally Unique Identifier (entire table): ba.freestatistics.org/blog/index.php?pk=75551&T=1

As an alternative you can also use a QR Code:  

The GUIDs for individual cells are displayed in the table below:

Autocorrelation Function
Time lag kACF(k)T-STATP-value
10.4673034.15354.1e-05
20.3452713.06880.001472
30.0473890.42120.337376
40.0703650.62540.266751
5-0.045368-0.40320.34393
60.0453590.40320.343961
7-0.029667-0.26370.396355
8-0.012729-0.11310.455105
90.0809760.71970.236907
100.0465930.41410.339952
11-0.072319-0.64280.261113
12-0.141771-1.26010.105674
13-0.095138-0.84560.200164
14-0.05066-0.45030.326871
15-0.014235-0.12650.449821
16-0.022847-0.20310.419803
17-0.073743-0.65540.257043
18-0.09362-0.83210.203928
190.0278950.24790.402414
20-0.053559-0.4760.31768
21-0.098334-0.8740.19238
22-0.089094-0.79190.215401
230.0163190.1450.442523
240.1008350.89620.186424
250.1084720.96410.168963
260.0563290.50070.309
27-0.097228-0.86420.195052
280.0501850.44610.328388
290.0857220.76190.22419
300.1511061.34310.091549
310.0292080.25960.397922
320.0500550.44490.328804
33-0.09409-0.83630.202757
34-0.097489-0.86650.19442
35-0.17798-1.58190.058831
36-0.18856-1.6760.04885
37-0.18368-1.63260.053268
38-0.091802-0.8160.208491
39-0.060987-0.54210.294649
40-0.046507-0.41340.340231
41-0.090965-0.80850.210611
42-0.073367-0.65210.258113
43-0.017899-0.15910.437003
440.0059980.05330.47881
45-0.012153-0.1080.457129
46-0.084575-0.75170.227227
47-0.082265-0.73120.233414
48-0.036233-0.3220.374134


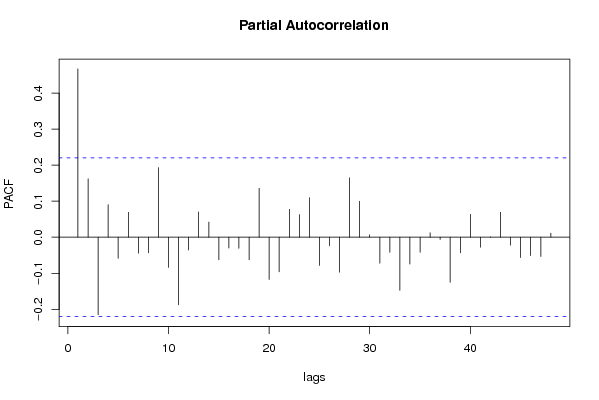
Partial Autocorrelation Function
Time lag kPACF(k)T-STATP-value
10.4673034.15354.1e-05
20.1623531.4430.076484
3-0.215013-1.91110.029811
40.090270.80230.212382
5-0.058365-0.51880.30269
60.0691280.61440.27035
7-0.044302-0.39380.347408
8-0.04324-0.38430.350886
90.1934111.71910.044758
10-0.084032-0.74690.228672
11-0.187485-1.66640.049797
12-0.035512-0.31560.376554
130.0702270.62420.26715
140.0421750.37490.354384
15-0.062696-0.55730.289464
16-0.030224-0.26860.394454
17-0.030772-0.27350.39259
18-0.062683-0.55710.289503
190.1358751.20770.115387
20-0.11723-1.0420.150303
21-0.095919-0.85250.198244
220.0775450.68920.246348
230.0631070.56090.288223
240.1097230.97520.16621
25-0.078485-0.69760.243742
26-0.023775-0.21130.416591
27-0.097065-0.86270.195447
280.1650141.46670.073217
290.0998750.88770.188696
300.0066570.05920.476484
31-0.072013-0.64010.261991
32-0.041939-0.37280.355161
33-0.147449-1.31060.096902
34-0.074653-0.66350.25446
35-0.041809-0.37160.355591
360.012180.10830.457031
37-0.006247-0.05550.477931
38-0.125118-1.11210.13474
39-0.043285-0.38470.350736
400.0638190.56720.28608
41-0.027746-0.24660.402923
420.0007730.00690.497267
430.0696640.61920.268787
44-0.022209-0.19740.422012
45-0.056379-0.50110.308846
46-0.050838-0.45190.326303
47-0.053293-0.47370.318517
480.0113660.1010.459894

\begin{tabular}{lllllllll}
\hline
Partial Autocorrelation Function \tabularnewline
Time lag k & PACF(k) & T-STAT & P-value \tabularnewline
1 & 0.467303 & 4.1535 & 4.1e-05 \tabularnewline
2 & 0.162353 & 1.443 & 0.076484 \tabularnewline
3 & -0.215013 & -1.9111 & 0.029811 \tabularnewline
4 & 0.09027 & 0.8023 & 0.212382 \tabularnewline
5 & -0.058365 & -0.5188 & 0.30269 \tabularnewline
6 & 0.069128 & 0.6144 & 0.27035 \tabularnewline
7 & -0.044302 & -0.3938 & 0.347408 \tabularnewline
8 & -0.04324 & -0.3843 & 0.350886 \tabularnewline
9 & 0.193411 & 1.7191 & 0.044758 \tabularnewline
10 & -0.084032 & -0.7469 & 0.228672 \tabularnewline
11 & -0.187485 & -1.6664 & 0.049797 \tabularnewline
12 & -0.035512 & -0.3156 & 0.376554 \tabularnewline
13 & 0.070227 & 0.6242 & 0.26715 \tabularnewline
14 & 0.042175 & 0.3749 & 0.354384 \tabularnewline
15 & -0.062696 & -0.5573 & 0.289464 \tabularnewline
16 & -0.030224 & -0.2686 & 0.394454 \tabularnewline
17 & -0.030772 & -0.2735 & 0.39259 \tabularnewline
18 & -0.062683 & -0.5571 & 0.289503 \tabularnewline
19 & 0.135875 & 1.2077 & 0.115387 \tabularnewline
20 & -0.11723 & -1.042 & 0.150303 \tabularnewline
21 & -0.095919 & -0.8525 & 0.198244 \tabularnewline
22 & 0.077545 & 0.6892 & 0.246348 \tabularnewline
23 & 0.063107 & 0.5609 & 0.288223 \tabularnewline
24 & 0.109723 & 0.9752 & 0.16621 \tabularnewline
25 & -0.078485 & -0.6976 & 0.243742 \tabularnewline
26 & -0.023775 & -0.2113 & 0.416591 \tabularnewline
27 & -0.097065 & -0.8627 & 0.195447 \tabularnewline
28 & 0.165014 & 1.4667 & 0.073217 \tabularnewline
29 & 0.099875 & 0.8877 & 0.188696 \tabularnewline
30 & 0.006657 & 0.0592 & 0.476484 \tabularnewline
31 & -0.072013 & -0.6401 & 0.261991 \tabularnewline
32 & -0.041939 & -0.3728 & 0.355161 \tabularnewline
33 & -0.147449 & -1.3106 & 0.096902 \tabularnewline
34 & -0.074653 & -0.6635 & 0.25446 \tabularnewline
35 & -0.041809 & -0.3716 & 0.355591 \tabularnewline
36 & 0.01218 & 0.1083 & 0.457031 \tabularnewline
37 & -0.006247 & -0.0555 & 0.477931 \tabularnewline
38 & -0.125118 & -1.1121 & 0.13474 \tabularnewline
39 & -0.043285 & -0.3847 & 0.350736 \tabularnewline
40 & 0.063819 & 0.5672 & 0.28608 \tabularnewline
41 & -0.027746 & -0.2466 & 0.402923 \tabularnewline
42 & 0.000773 & 0.0069 & 0.497267 \tabularnewline
43 & 0.069664 & 0.6192 & 0.268787 \tabularnewline
44 & -0.022209 & -0.1974 & 0.422012 \tabularnewline
45 & -0.056379 & -0.5011 & 0.308846 \tabularnewline
46 & -0.050838 & -0.4519 & 0.326303 \tabularnewline
47 & -0.053293 & -0.4737 & 0.318517 \tabularnewline
48 & 0.011366 & 0.101 & 0.459894 \tabularnewline
\hline
\end{tabular}
%Source: https://freestatistics.org/blog/index.php?pk=75551&T=2

[TABLE]
[ROW][C]Partial Autocorrelation Function[/C][/ROW]
[ROW][C]Time lag k[/C][C]PACF(k)[/C][C]T-STAT[/C][C]P-value[/C][/ROW]
[ROW][C]1[/C][C]0.467303[/C][C]4.1535[/C][C]4.1e-05[/C][/ROW]
[ROW][C]2[/C][C]0.162353[/C][C]1.443[/C][C]0.076484[/C][/ROW]
[ROW][C]3[/C][C]-0.215013[/C][C]-1.9111[/C][C]0.029811[/C][/ROW]
[ROW][C]4[/C][C]0.09027[/C][C]0.8023[/C][C]0.212382[/C][/ROW]
[ROW][C]5[/C][C]-0.058365[/C][C]-0.5188[/C][C]0.30269[/C][/ROW]
[ROW][C]6[/C][C]0.069128[/C][C]0.6144[/C][C]0.27035[/C][/ROW]
[ROW][C]7[/C][C]-0.044302[/C][C]-0.3938[/C][C]0.347408[/C][/ROW]
[ROW][C]8[/C][C]-0.04324[/C][C]-0.3843[/C][C]0.350886[/C][/ROW]
[ROW][C]9[/C][C]0.193411[/C][C]1.7191[/C][C]0.044758[/C][/ROW]
[ROW][C]10[/C][C]-0.084032[/C][C]-0.7469[/C][C]0.228672[/C][/ROW]
[ROW][C]11[/C][C]-0.187485[/C][C]-1.6664[/C][C]0.049797[/C][/ROW]
[ROW][C]12[/C][C]-0.035512[/C][C]-0.3156[/C][C]0.376554[/C][/ROW]
[ROW][C]13[/C][C]0.070227[/C][C]0.6242[/C][C]0.26715[/C][/ROW]
[ROW][C]14[/C][C]0.042175[/C][C]0.3749[/C][C]0.354384[/C][/ROW]
[ROW][C]15[/C][C]-0.062696[/C][C]-0.5573[/C][C]0.289464[/C][/ROW]
[ROW][C]16[/C][C]-0.030224[/C][C]-0.2686[/C][C]0.394454[/C][/ROW]
[ROW][C]17[/C][C]-0.030772[/C][C]-0.2735[/C][C]0.39259[/C][/ROW]
[ROW][C]18[/C][C]-0.062683[/C][C]-0.5571[/C][C]0.289503[/C][/ROW]
[ROW][C]19[/C][C]0.135875[/C][C]1.2077[/C][C]0.115387[/C][/ROW]
[ROW][C]20[/C][C]-0.11723[/C][C]-1.042[/C][C]0.150303[/C][/ROW]
[ROW][C]21[/C][C]-0.095919[/C][C]-0.8525[/C][C]0.198244[/C][/ROW]
[ROW][C]22[/C][C]0.077545[/C][C]0.6892[/C][C]0.246348[/C][/ROW]
[ROW][C]23[/C][C]0.063107[/C][C]0.5609[/C][C]0.288223[/C][/ROW]
[ROW][C]24[/C][C]0.109723[/C][C]0.9752[/C][C]0.16621[/C][/ROW]
[ROW][C]25[/C][C]-0.078485[/C][C]-0.6976[/C][C]0.243742[/C][/ROW]
[ROW][C]26[/C][C]-0.023775[/C][C]-0.2113[/C][C]0.416591[/C][/ROW]
[ROW][C]27[/C][C]-0.097065[/C][C]-0.8627[/C][C]0.195447[/C][/ROW]
[ROW][C]28[/C][C]0.165014[/C][C]1.4667[/C][C]0.073217[/C][/ROW]
[ROW][C]29[/C][C]0.099875[/C][C]0.8877[/C][C]0.188696[/C][/ROW]
[ROW][C]30[/C][C]0.006657[/C][C]0.0592[/C][C]0.476484[/C][/ROW]
[ROW][C]31[/C][C]-0.072013[/C][C]-0.6401[/C][C]0.261991[/C][/ROW]
[ROW][C]32[/C][C]-0.041939[/C][C]-0.3728[/C][C]0.355161[/C][/ROW]
[ROW][C]33[/C][C]-0.147449[/C][C]-1.3106[/C][C]0.096902[/C][/ROW]
[ROW][C]34[/C][C]-0.074653[/C][C]-0.6635[/C][C]0.25446[/C][/ROW]
[ROW][C]35[/C][C]-0.041809[/C][C]-0.3716[/C][C]0.355591[/C][/ROW]
[ROW][C]36[/C][C]0.01218[/C][C]0.1083[/C][C]0.457031[/C][/ROW]
[ROW][C]37[/C][C]-0.006247[/C][C]-0.0555[/C][C]0.477931[/C][/ROW]
[ROW][C]38[/C][C]-0.125118[/C][C]-1.1121[/C][C]0.13474[/C][/ROW]
[ROW][C]39[/C][C]-0.043285[/C][C]-0.3847[/C][C]0.350736[/C][/ROW]
[ROW][C]40[/C][C]0.063819[/C][C]0.5672[/C][C]0.28608[/C][/ROW]
[ROW][C]41[/C][C]-0.027746[/C][C]-0.2466[/C][C]0.402923[/C][/ROW]
[ROW][C]42[/C][C]0.000773[/C][C]0.0069[/C][C]0.497267[/C][/ROW]
[ROW][C]43[/C][C]0.069664[/C][C]0.6192[/C][C]0.268787[/C][/ROW]
[ROW][C]44[/C][C]-0.022209[/C][C]-0.1974[/C][C]0.422012[/C][/ROW]
[ROW][C]45[/C][C]-0.056379[/C][C]-0.5011[/C][C]0.308846[/C][/ROW]
[ROW][C]46[/C][C]-0.050838[/C][C]-0.4519[/C][C]0.326303[/C][/ROW]
[ROW][C]47[/C][C]-0.053293[/C][C]-0.4737[/C][C]0.318517[/C][/ROW]
[ROW][C]48[/C][C]0.011366[/C][C]0.101[/C][C]0.459894[/C][/ROW]
[/TABLE]
Source: https://freestatistics.org/blog/index.php?pk=75551&T=2

Globally Unique Identifier (entire table): ba.freestatistics.org/blog/index.php?pk=75551&T=2

As an alternative you can also use a QR Code:  

The GUIDs for individual cells are displayed in the table below:

Partial Autocorrelation Function
Time lag kPACF(k)T-STATP-value
10.4673034.15354.1e-05
20.1623531.4430.076484
3-0.215013-1.91110.029811
40.090270.80230.212382
5-0.058365-0.51880.30269
60.0691280.61440.27035
7-0.044302-0.39380.347408
8-0.04324-0.38430.350886
90.1934111.71910.044758
10-0.084032-0.74690.228672
11-0.187485-1.66640.049797
12-0.035512-0.31560.376554
130.0702270.62420.26715
140.0421750.37490.354384
15-0.062696-0.55730.289464
16-0.030224-0.26860.394454
17-0.030772-0.27350.39259
18-0.062683-0.55710.289503
190.1358751.20770.115387
20-0.11723-1.0420.150303
21-0.095919-0.85250.198244
220.0775450.68920.246348
230.0631070.56090.288223
240.1097230.97520.16621
25-0.078485-0.69760.243742
26-0.023775-0.21130.416591
27-0.097065-0.86270.195447
280.1650141.46670.073217
290.0998750.88770.188696
300.0066570.05920.476484
31-0.072013-0.64010.261991
32-0.041939-0.37280.355161
33-0.147449-1.31060.096902
34-0.074653-0.66350.25446
35-0.041809-0.37160.355591
360.012180.10830.457031
37-0.006247-0.05550.477931
38-0.125118-1.11210.13474
39-0.043285-0.38470.350736
400.0638190.56720.28608
41-0.027746-0.24660.402923
420.0007730.00690.497267
430.0696640.61920.268787
44-0.022209-0.19740.422012
45-0.056379-0.50110.308846
46-0.050838-0.45190.326303
47-0.053293-0.47370.318517
480.0113660.1010.459894


Parameters (Session):
par1 = 48 ; par2 = 1 ; par3 = 1 ; par4 = 0 ; par5 = 4 ; par6 = White Noise ; par7 = 0.95 ;
Parameters (R input):
par1 = 48 ; par2 = 1 ; par3 = 1 ; par4 = 0 ; par5 = 4 ; par6 = White Noise ; par7 = 0.95 ;
R code (references can be found in the software module):
if (par1 == 'Default') {
par1 = 10*log10(length(x))
} else {
par1 <- as.numeric(par1)
}
par2 <- as.numeric(par2)
par3 <- as.numeric(par3)
par4 <- as.numeric(par4)
par5 <- as.numeric(par5)
if (par6 == 'White Noise') par6 <- 'white' else par6 <- 'ma'
par7 <- as.numeric(par7)
if (par2 == 0) {
x <- log(x)
} else {
x <- (x ^ par2 - 1) / par2
}
if (par3 > 0) x <- diff(x,lag=1,difference=par3)
if (par4 > 0) x <- diff(x,lag=par5,difference=par4)
bitmap(file='pic1.png')
racf <- acf(x, par1, main='Autocorrelation', xlab='time lag', ylab='ACF', ci.type=par6, ci=par7, sub=paste('(lambda=',par2,', d=',par3,', D=',par4,', CI=', par7, ', CI type=',par6,')',sep=''))
dev.off()
bitmap(file='pic2.png')
rpacf <- pacf(x,par1,main='Partial Autocorrelation',xlab='lags',ylab='PACF')
dev.off()
(myacf <- c(racf$acf))
(mypacf <- c(rpacf$acf))
lengthx <- length(x)
sqrtn <- sqrt(lengthx)
load(file='createtable')
a<-table.start()
a<-table.row.start(a)
a<-table.element(a,'Autocorrelation Function',4,TRUE)
a<-table.row.end(a)
a<-table.row.start(a)
a<-table.element(a,'Time lag k',header=TRUE)
a<-table.element(a,hyperlink('basics.htm','ACF(k)','click here for more information about the Autocorrelation Function'),header=TRUE)
a<-table.element(a,'T-STAT',header=TRUE)
a<-table.element(a,'P-value',header=TRUE)
a<-table.row.end(a)
for (i in 2:(par1+1)) {
a<-table.row.start(a)
a<-table.element(a,i-1,header=TRUE)
a<-table.element(a,round(myacf[i],6))
mytstat <- myacf[i]*sqrtn
a<-table.element(a,round(mytstat,4))
a<-table.element(a,round(1-pt(abs(mytstat),lengthx),6))
a<-table.row.end(a)
}
a<-table.end(a)
table.save(a,file='mytable.tab')
a<-table.start()
a<-table.row.start(a)
a<-table.element(a,'Partial Autocorrelation Function',4,TRUE)
a<-table.row.end(a)
a<-table.row.start(a)
a<-table.element(a,'Time lag k',header=TRUE)
a<-table.element(a,hyperlink('basics.htm','PACF(k)','click here for more information about the Partial Autocorrelation Function'),header=TRUE)
a<-table.element(a,'T-STAT',header=TRUE)
a<-table.element(a,'P-value',header=TRUE)
a<-table.row.end(a)
for (i in 1:par1) {
a<-table.row.start(a)
a<-table.element(a,i,header=TRUE)
a<-table.element(a,round(mypacf[i],6))
mytstat <- mypacf[i]*sqrtn
a<-table.element(a,round(mytstat,4))
a<-table.element(a,round(1-pt(abs(mytstat),lengthx),6))
a<-table.row.end(a)
}
a<-table.end(a)
table.save(a,file='mytable1.tab')