Free Statistics

of Irreproducible Research!

Author's title

Author*Unverified author*
R Software Modulerwasp_autocorrelation.wasp
Title produced by software(Partial) Autocorrelation Function
Date of computationWed, 05 May 2010 16:47:18 +0000
Cite this page as followsStatistical Computations at FreeStatistics.org, Office for Research Development and Education, URL https://freestatistics.org/blog/index.php?v=date/2010/May/05/t12730780953l0sgzlt95824cq.htm/, Retrieved Sat, 27 Apr 2024 17:26:15 +0000
Statistical Computations at FreeStatistics.org, Office for Research Development and Education, URL https://freestatistics.org/blog/index.php?pk=75552, Retrieved Sat, 27 Apr 2024 17:26:15 +0000
QR Codes:

Original text written by user:
IsPrivate?No (this computation is public)
User-defined keywordsKDGP2W21
Estimated Impact111
Family? (F = Feedback message, R = changed R code, M = changed R Module, P = changed Parameters, D = changed Data)
-       [(Partial) Autocorrelation Function] [] [2010-05-05 16:47:18] [676a4f18bfa59791b951d67c8b4b8fd1] [Current]
Feedback Forum

Post a new message
Dataseries X:
77
70
67
76
85
106
108
120
108
111
109
104
104
117
111
110
116
118
115
111
112
97
106
93
95
97
81
71
75
70
72
80
78
80
81
99
87
100
95
128
112
104
102
108
103
99
96
85
78
74
106
100
109
87
107
106
109
83
84
83
65
68
61
75
66
78
68
68
174
64
48
45


Summary of computational transaction
Raw Inputview raw input (R code)
Raw Outputview raw output of R engine
Computing time2 seconds
R Server'Sir Ronald Aylmer Fisher' @ 193.190.124.24

\begin{tabular}{lllllllll}
\hline
Summary of computational transaction \tabularnewline
Raw Input & view raw input (R code)  \tabularnewline
Raw Output & view raw output of R engine  \tabularnewline
Computing time & 2 seconds \tabularnewline
R Server & 'Sir Ronald Aylmer Fisher' @ 193.190.124.24 \tabularnewline
\hline
\end{tabular}
%Source: https://freestatistics.org/blog/index.php?pk=75552&T=0

[TABLE]
[ROW][C]Summary of computational transaction[/C][/ROW]
[ROW][C]Raw Input[/C][C]view raw input (R code) [/C][/ROW]
[ROW][C]Raw Output[/C][C]view raw output of R engine [/C][/ROW]
[ROW][C]Computing time[/C][C]2 seconds[/C][/ROW]
[ROW][C]R Server[/C][C]'Sir Ronald Aylmer Fisher' @ 193.190.124.24[/C][/ROW]
[/TABLE]
Source: https://freestatistics.org/blog/index.php?pk=75552&T=0

Globally Unique Identifier (entire table): ba.freestatistics.org/blog/index.php?pk=75552&T=0

As an alternative you can also use a QR Code:  

The GUIDs for individual cells are displayed in the table below:

Summary of computational transaction
Raw Inputview raw input (R code)
Raw Outputview raw output of R engine
Computing time2 seconds
R Server'Sir Ronald Aylmer Fisher' @ 193.190.124.24


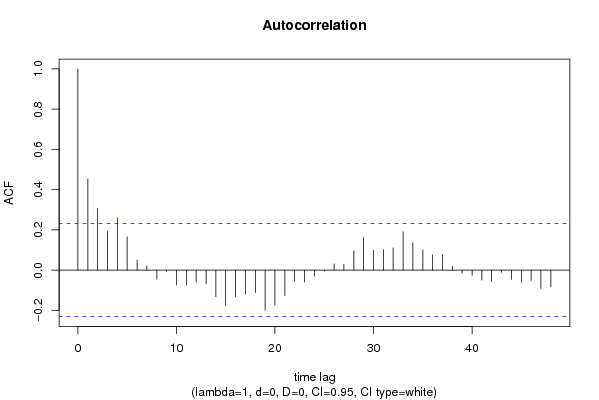
Autocorrelation Function
Time lag kACF(k)T-STATP-value
10.453293.84630.000128
20.3059692.59620.005709
30.192581.63410.053302
40.2610222.21480.014968
50.1663771.41180.081164
60.0502930.42680.335417
70.0208030.17650.43019
8-0.044739-0.37960.352672
9-0.00676-0.05740.477208
10-0.073515-0.62380.267365
11-0.072692-0.61680.269651
12-0.058771-0.49870.309761
13-0.067286-0.57090.28491
14-0.131664-1.11720.133809
15-0.175657-1.49050.070231
16-0.13326-1.13070.130958
17-0.118355-1.00430.159305
18-0.110778-0.940.175184
19-0.198912-1.68780.047886
20-0.173889-1.47550.072219
21-0.126196-1.07080.143916
22-0.055177-0.46820.32053
23-0.058524-0.49660.310494
24-0.028399-0.2410.405129
25-0.004564-0.03870.484608
260.0310310.26330.396532
270.0293120.24870.402144
280.0961670.8160.208594
290.1627961.38140.085719
300.0993910.84340.20091
310.1021460.86670.194482
320.1106730.93910.175411
330.1904431.6160.055238
340.1368421.16110.12471
350.1008710.85590.197442
360.0760390.64520.260421
370.0781020.66270.254814
380.0197340.16740.433744
39-0.014087-0.11950.452594
40-0.025691-0.2180.414025
41-0.049324-0.41850.338404
42-0.05614-0.47640.31763
43-0.010464-0.08880.464749
44-0.045865-0.38920.349146
45-0.060844-0.51630.303621
46-0.051461-0.43670.331831
47-0.091192-0.77380.220794
48-0.081777-0.69390.244987

\begin{tabular}{lllllllll}
\hline
Autocorrelation Function \tabularnewline
Time lag k & ACF(k) & T-STAT & P-value \tabularnewline
1 & 0.45329 & 3.8463 & 0.000128 \tabularnewline
2 & 0.305969 & 2.5962 & 0.005709 \tabularnewline
3 & 0.19258 & 1.6341 & 0.053302 \tabularnewline
4 & 0.261022 & 2.2148 & 0.014968 \tabularnewline
5 & 0.166377 & 1.4118 & 0.081164 \tabularnewline
6 & 0.050293 & 0.4268 & 0.335417 \tabularnewline
7 & 0.020803 & 0.1765 & 0.43019 \tabularnewline
8 & -0.044739 & -0.3796 & 0.352672 \tabularnewline
9 & -0.00676 & -0.0574 & 0.477208 \tabularnewline
10 & -0.073515 & -0.6238 & 0.267365 \tabularnewline
11 & -0.072692 & -0.6168 & 0.269651 \tabularnewline
12 & -0.058771 & -0.4987 & 0.309761 \tabularnewline
13 & -0.067286 & -0.5709 & 0.28491 \tabularnewline
14 & -0.131664 & -1.1172 & 0.133809 \tabularnewline
15 & -0.175657 & -1.4905 & 0.070231 \tabularnewline
16 & -0.13326 & -1.1307 & 0.130958 \tabularnewline
17 & -0.118355 & -1.0043 & 0.159305 \tabularnewline
18 & -0.110778 & -0.94 & 0.175184 \tabularnewline
19 & -0.198912 & -1.6878 & 0.047886 \tabularnewline
20 & -0.173889 & -1.4755 & 0.072219 \tabularnewline
21 & -0.126196 & -1.0708 & 0.143916 \tabularnewline
22 & -0.055177 & -0.4682 & 0.32053 \tabularnewline
23 & -0.058524 & -0.4966 & 0.310494 \tabularnewline
24 & -0.028399 & -0.241 & 0.405129 \tabularnewline
25 & -0.004564 & -0.0387 & 0.484608 \tabularnewline
26 & 0.031031 & 0.2633 & 0.396532 \tabularnewline
27 & 0.029312 & 0.2487 & 0.402144 \tabularnewline
28 & 0.096167 & 0.816 & 0.208594 \tabularnewline
29 & 0.162796 & 1.3814 & 0.085719 \tabularnewline
30 & 0.099391 & 0.8434 & 0.20091 \tabularnewline
31 & 0.102146 & 0.8667 & 0.194482 \tabularnewline
32 & 0.110673 & 0.9391 & 0.175411 \tabularnewline
33 & 0.190443 & 1.616 & 0.055238 \tabularnewline
34 & 0.136842 & 1.1611 & 0.12471 \tabularnewline
35 & 0.100871 & 0.8559 & 0.197442 \tabularnewline
36 & 0.076039 & 0.6452 & 0.260421 \tabularnewline
37 & 0.078102 & 0.6627 & 0.254814 \tabularnewline
38 & 0.019734 & 0.1674 & 0.433744 \tabularnewline
39 & -0.014087 & -0.1195 & 0.452594 \tabularnewline
40 & -0.025691 & -0.218 & 0.414025 \tabularnewline
41 & -0.049324 & -0.4185 & 0.338404 \tabularnewline
42 & -0.05614 & -0.4764 & 0.31763 \tabularnewline
43 & -0.010464 & -0.0888 & 0.464749 \tabularnewline
44 & -0.045865 & -0.3892 & 0.349146 \tabularnewline
45 & -0.060844 & -0.5163 & 0.303621 \tabularnewline
46 & -0.051461 & -0.4367 & 0.331831 \tabularnewline
47 & -0.091192 & -0.7738 & 0.220794 \tabularnewline
48 & -0.081777 & -0.6939 & 0.244987 \tabularnewline
\hline
\end{tabular}
%Source: https://freestatistics.org/blog/index.php?pk=75552&T=1

[TABLE]
[ROW][C]Autocorrelation Function[/C][/ROW]
[ROW][C]Time lag k[/C][C]ACF(k)[/C][C]T-STAT[/C][C]P-value[/C][/ROW]
[ROW][C]1[/C][C]0.45329[/C][C]3.8463[/C][C]0.000128[/C][/ROW]
[ROW][C]2[/C][C]0.305969[/C][C]2.5962[/C][C]0.005709[/C][/ROW]
[ROW][C]3[/C][C]0.19258[/C][C]1.6341[/C][C]0.053302[/C][/ROW]
[ROW][C]4[/C][C]0.261022[/C][C]2.2148[/C][C]0.014968[/C][/ROW]
[ROW][C]5[/C][C]0.166377[/C][C]1.4118[/C][C]0.081164[/C][/ROW]
[ROW][C]6[/C][C]0.050293[/C][C]0.4268[/C][C]0.335417[/C][/ROW]
[ROW][C]7[/C][C]0.020803[/C][C]0.1765[/C][C]0.43019[/C][/ROW]
[ROW][C]8[/C][C]-0.044739[/C][C]-0.3796[/C][C]0.352672[/C][/ROW]
[ROW][C]9[/C][C]-0.00676[/C][C]-0.0574[/C][C]0.477208[/C][/ROW]
[ROW][C]10[/C][C]-0.073515[/C][C]-0.6238[/C][C]0.267365[/C][/ROW]
[ROW][C]11[/C][C]-0.072692[/C][C]-0.6168[/C][C]0.269651[/C][/ROW]
[ROW][C]12[/C][C]-0.058771[/C][C]-0.4987[/C][C]0.309761[/C][/ROW]
[ROW][C]13[/C][C]-0.067286[/C][C]-0.5709[/C][C]0.28491[/C][/ROW]
[ROW][C]14[/C][C]-0.131664[/C][C]-1.1172[/C][C]0.133809[/C][/ROW]
[ROW][C]15[/C][C]-0.175657[/C][C]-1.4905[/C][C]0.070231[/C][/ROW]
[ROW][C]16[/C][C]-0.13326[/C][C]-1.1307[/C][C]0.130958[/C][/ROW]
[ROW][C]17[/C][C]-0.118355[/C][C]-1.0043[/C][C]0.159305[/C][/ROW]
[ROW][C]18[/C][C]-0.110778[/C][C]-0.94[/C][C]0.175184[/C][/ROW]
[ROW][C]19[/C][C]-0.198912[/C][C]-1.6878[/C][C]0.047886[/C][/ROW]
[ROW][C]20[/C][C]-0.173889[/C][C]-1.4755[/C][C]0.072219[/C][/ROW]
[ROW][C]21[/C][C]-0.126196[/C][C]-1.0708[/C][C]0.143916[/C][/ROW]
[ROW][C]22[/C][C]-0.055177[/C][C]-0.4682[/C][C]0.32053[/C][/ROW]
[ROW][C]23[/C][C]-0.058524[/C][C]-0.4966[/C][C]0.310494[/C][/ROW]
[ROW][C]24[/C][C]-0.028399[/C][C]-0.241[/C][C]0.405129[/C][/ROW]
[ROW][C]25[/C][C]-0.004564[/C][C]-0.0387[/C][C]0.484608[/C][/ROW]
[ROW][C]26[/C][C]0.031031[/C][C]0.2633[/C][C]0.396532[/C][/ROW]
[ROW][C]27[/C][C]0.029312[/C][C]0.2487[/C][C]0.402144[/C][/ROW]
[ROW][C]28[/C][C]0.096167[/C][C]0.816[/C][C]0.208594[/C][/ROW]
[ROW][C]29[/C][C]0.162796[/C][C]1.3814[/C][C]0.085719[/C][/ROW]
[ROW][C]30[/C][C]0.099391[/C][C]0.8434[/C][C]0.20091[/C][/ROW]
[ROW][C]31[/C][C]0.102146[/C][C]0.8667[/C][C]0.194482[/C][/ROW]
[ROW][C]32[/C][C]0.110673[/C][C]0.9391[/C][C]0.175411[/C][/ROW]
[ROW][C]33[/C][C]0.190443[/C][C]1.616[/C][C]0.055238[/C][/ROW]
[ROW][C]34[/C][C]0.136842[/C][C]1.1611[/C][C]0.12471[/C][/ROW]
[ROW][C]35[/C][C]0.100871[/C][C]0.8559[/C][C]0.197442[/C][/ROW]
[ROW][C]36[/C][C]0.076039[/C][C]0.6452[/C][C]0.260421[/C][/ROW]
[ROW][C]37[/C][C]0.078102[/C][C]0.6627[/C][C]0.254814[/C][/ROW]
[ROW][C]38[/C][C]0.019734[/C][C]0.1674[/C][C]0.433744[/C][/ROW]
[ROW][C]39[/C][C]-0.014087[/C][C]-0.1195[/C][C]0.452594[/C][/ROW]
[ROW][C]40[/C][C]-0.025691[/C][C]-0.218[/C][C]0.414025[/C][/ROW]
[ROW][C]41[/C][C]-0.049324[/C][C]-0.4185[/C][C]0.338404[/C][/ROW]
[ROW][C]42[/C][C]-0.05614[/C][C]-0.4764[/C][C]0.31763[/C][/ROW]
[ROW][C]43[/C][C]-0.010464[/C][C]-0.0888[/C][C]0.464749[/C][/ROW]
[ROW][C]44[/C][C]-0.045865[/C][C]-0.3892[/C][C]0.349146[/C][/ROW]
[ROW][C]45[/C][C]-0.060844[/C][C]-0.5163[/C][C]0.303621[/C][/ROW]
[ROW][C]46[/C][C]-0.051461[/C][C]-0.4367[/C][C]0.331831[/C][/ROW]
[ROW][C]47[/C][C]-0.091192[/C][C]-0.7738[/C][C]0.220794[/C][/ROW]
[ROW][C]48[/C][C]-0.081777[/C][C]-0.6939[/C][C]0.244987[/C][/ROW]
[/TABLE]
Source: https://freestatistics.org/blog/index.php?pk=75552&T=1

Globally Unique Identifier (entire table): ba.freestatistics.org/blog/index.php?pk=75552&T=1

As an alternative you can also use a QR Code:  

The GUIDs for individual cells are displayed in the table below:

Autocorrelation Function
Time lag kACF(k)T-STATP-value
10.453293.84630.000128
20.3059692.59620.005709
30.192581.63410.053302
40.2610222.21480.014968
50.1663771.41180.081164
60.0502930.42680.335417
70.0208030.17650.43019
8-0.044739-0.37960.352672
9-0.00676-0.05740.477208
10-0.073515-0.62380.267365
11-0.072692-0.61680.269651
12-0.058771-0.49870.309761
13-0.067286-0.57090.28491
14-0.131664-1.11720.133809
15-0.175657-1.49050.070231
16-0.13326-1.13070.130958
17-0.118355-1.00430.159305
18-0.110778-0.940.175184
19-0.198912-1.68780.047886
20-0.173889-1.47550.072219
21-0.126196-1.07080.143916
22-0.055177-0.46820.32053
23-0.058524-0.49660.310494
24-0.028399-0.2410.405129
25-0.004564-0.03870.484608
260.0310310.26330.396532
270.0293120.24870.402144
280.0961670.8160.208594
290.1627961.38140.085719
300.0993910.84340.20091
310.1021460.86670.194482
320.1106730.93910.175411
330.1904431.6160.055238
340.1368421.16110.12471
350.1008710.85590.197442
360.0760390.64520.260421
370.0781020.66270.254814
380.0197340.16740.433744
39-0.014087-0.11950.452594
40-0.025691-0.2180.414025
41-0.049324-0.41850.338404
42-0.05614-0.47640.31763
43-0.010464-0.08880.464749
44-0.045865-0.38920.349146
45-0.060844-0.51630.303621
46-0.051461-0.43670.331831
47-0.091192-0.77380.220794
48-0.081777-0.69390.244987


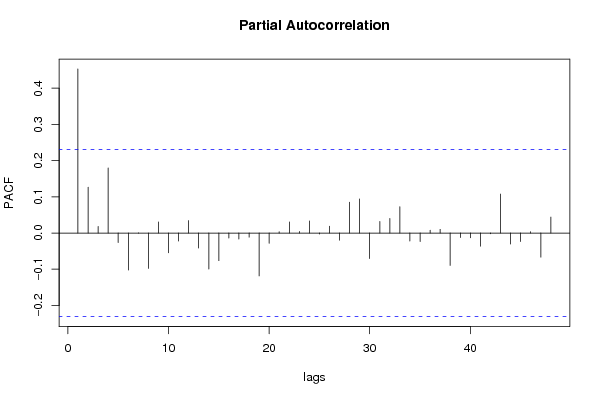
Partial Autocorrelation Function
Time lag kPACF(k)T-STATP-value
10.453293.84630.000128
20.1264861.07330.143368
30.0180290.1530.43942
40.1797931.52560.065746
5-0.026107-0.22150.412655
6-0.102235-0.86750.194276
7-4e-04-0.00340.498649
8-0.097673-0.82880.204982
90.0305320.25910.398158
10-0.054311-0.46080.323151
11-0.022187-0.18830.4256
120.0343740.29170.385688
13-0.04136-0.35090.363325
14-0.099681-0.84580.200227
15-0.07626-0.64710.259817
16-0.013791-0.1170.453584
17-0.016522-0.14020.444448
18-0.011313-0.0960.461895
19-0.118462-1.00520.159087
20-0.028441-0.24130.404994
210.0035830.03040.487915
220.0305240.2590.398185
230.0044590.03780.484961
240.0330740.28060.389896
25-0.002748-0.02330.49073
260.0188450.15990.436702
27-0.019605-0.16640.434173
280.0852890.72370.235798
290.0939130.79690.21407
30-0.070332-0.59680.27626
310.0321730.2730.392819
320.0403570.34240.366509
330.0729520.6190.26893
34-0.022011-0.18680.426183
35-0.023706-0.20120.420572
360.0080090.0680.473005
370.0102140.08670.465588
38-0.089397-0.75860.225297
39-0.012207-0.10360.458895
40-0.013316-0.1130.455175
41-0.036174-0.30690.379886
42-0.001973-0.01670.493345
430.1075580.91270.182234
44-0.030234-0.25650.399131
45-0.023442-0.19890.421446
460.0037340.03170.487404
47-0.066628-0.56540.286795
480.0440430.37370.354856

\begin{tabular}{lllllllll}
\hline
Partial Autocorrelation Function \tabularnewline
Time lag k & PACF(k) & T-STAT & P-value \tabularnewline
1 & 0.45329 & 3.8463 & 0.000128 \tabularnewline
2 & 0.126486 & 1.0733 & 0.143368 \tabularnewline
3 & 0.018029 & 0.153 & 0.43942 \tabularnewline
4 & 0.179793 & 1.5256 & 0.065746 \tabularnewline
5 & -0.026107 & -0.2215 & 0.412655 \tabularnewline
6 & -0.102235 & -0.8675 & 0.194276 \tabularnewline
7 & -4e-04 & -0.0034 & 0.498649 \tabularnewline
8 & -0.097673 & -0.8288 & 0.204982 \tabularnewline
9 & 0.030532 & 0.2591 & 0.398158 \tabularnewline
10 & -0.054311 & -0.4608 & 0.323151 \tabularnewline
11 & -0.022187 & -0.1883 & 0.4256 \tabularnewline
12 & 0.034374 & 0.2917 & 0.385688 \tabularnewline
13 & -0.04136 & -0.3509 & 0.363325 \tabularnewline
14 & -0.099681 & -0.8458 & 0.200227 \tabularnewline
15 & -0.07626 & -0.6471 & 0.259817 \tabularnewline
16 & -0.013791 & -0.117 & 0.453584 \tabularnewline
17 & -0.016522 & -0.1402 & 0.444448 \tabularnewline
18 & -0.011313 & -0.096 & 0.461895 \tabularnewline
19 & -0.118462 & -1.0052 & 0.159087 \tabularnewline
20 & -0.028441 & -0.2413 & 0.404994 \tabularnewline
21 & 0.003583 & 0.0304 & 0.487915 \tabularnewline
22 & 0.030524 & 0.259 & 0.398185 \tabularnewline
23 & 0.004459 & 0.0378 & 0.484961 \tabularnewline
24 & 0.033074 & 0.2806 & 0.389896 \tabularnewline
25 & -0.002748 & -0.0233 & 0.49073 \tabularnewline
26 & 0.018845 & 0.1599 & 0.436702 \tabularnewline
27 & -0.019605 & -0.1664 & 0.434173 \tabularnewline
28 & 0.085289 & 0.7237 & 0.235798 \tabularnewline
29 & 0.093913 & 0.7969 & 0.21407 \tabularnewline
30 & -0.070332 & -0.5968 & 0.27626 \tabularnewline
31 & 0.032173 & 0.273 & 0.392819 \tabularnewline
32 & 0.040357 & 0.3424 & 0.366509 \tabularnewline
33 & 0.072952 & 0.619 & 0.26893 \tabularnewline
34 & -0.022011 & -0.1868 & 0.426183 \tabularnewline
35 & -0.023706 & -0.2012 & 0.420572 \tabularnewline
36 & 0.008009 & 0.068 & 0.473005 \tabularnewline
37 & 0.010214 & 0.0867 & 0.465588 \tabularnewline
38 & -0.089397 & -0.7586 & 0.225297 \tabularnewline
39 & -0.012207 & -0.1036 & 0.458895 \tabularnewline
40 & -0.013316 & -0.113 & 0.455175 \tabularnewline
41 & -0.036174 & -0.3069 & 0.379886 \tabularnewline
42 & -0.001973 & -0.0167 & 0.493345 \tabularnewline
43 & 0.107558 & 0.9127 & 0.182234 \tabularnewline
44 & -0.030234 & -0.2565 & 0.399131 \tabularnewline
45 & -0.023442 & -0.1989 & 0.421446 \tabularnewline
46 & 0.003734 & 0.0317 & 0.487404 \tabularnewline
47 & -0.066628 & -0.5654 & 0.286795 \tabularnewline
48 & 0.044043 & 0.3737 & 0.354856 \tabularnewline
\hline
\end{tabular}
%Source: https://freestatistics.org/blog/index.php?pk=75552&T=2

[TABLE]
[ROW][C]Partial Autocorrelation Function[/C][/ROW]
[ROW][C]Time lag k[/C][C]PACF(k)[/C][C]T-STAT[/C][C]P-value[/C][/ROW]
[ROW][C]1[/C][C]0.45329[/C][C]3.8463[/C][C]0.000128[/C][/ROW]
[ROW][C]2[/C][C]0.126486[/C][C]1.0733[/C][C]0.143368[/C][/ROW]
[ROW][C]3[/C][C]0.018029[/C][C]0.153[/C][C]0.43942[/C][/ROW]
[ROW][C]4[/C][C]0.179793[/C][C]1.5256[/C][C]0.065746[/C][/ROW]
[ROW][C]5[/C][C]-0.026107[/C][C]-0.2215[/C][C]0.412655[/C][/ROW]
[ROW][C]6[/C][C]-0.102235[/C][C]-0.8675[/C][C]0.194276[/C][/ROW]
[ROW][C]7[/C][C]-4e-04[/C][C]-0.0034[/C][C]0.498649[/C][/ROW]
[ROW][C]8[/C][C]-0.097673[/C][C]-0.8288[/C][C]0.204982[/C][/ROW]
[ROW][C]9[/C][C]0.030532[/C][C]0.2591[/C][C]0.398158[/C][/ROW]
[ROW][C]10[/C][C]-0.054311[/C][C]-0.4608[/C][C]0.323151[/C][/ROW]
[ROW][C]11[/C][C]-0.022187[/C][C]-0.1883[/C][C]0.4256[/C][/ROW]
[ROW][C]12[/C][C]0.034374[/C][C]0.2917[/C][C]0.385688[/C][/ROW]
[ROW][C]13[/C][C]-0.04136[/C][C]-0.3509[/C][C]0.363325[/C][/ROW]
[ROW][C]14[/C][C]-0.099681[/C][C]-0.8458[/C][C]0.200227[/C][/ROW]
[ROW][C]15[/C][C]-0.07626[/C][C]-0.6471[/C][C]0.259817[/C][/ROW]
[ROW][C]16[/C][C]-0.013791[/C][C]-0.117[/C][C]0.453584[/C][/ROW]
[ROW][C]17[/C][C]-0.016522[/C][C]-0.1402[/C][C]0.444448[/C][/ROW]
[ROW][C]18[/C][C]-0.011313[/C][C]-0.096[/C][C]0.461895[/C][/ROW]
[ROW][C]19[/C][C]-0.118462[/C][C]-1.0052[/C][C]0.159087[/C][/ROW]
[ROW][C]20[/C][C]-0.028441[/C][C]-0.2413[/C][C]0.404994[/C][/ROW]
[ROW][C]21[/C][C]0.003583[/C][C]0.0304[/C][C]0.487915[/C][/ROW]
[ROW][C]22[/C][C]0.030524[/C][C]0.259[/C][C]0.398185[/C][/ROW]
[ROW][C]23[/C][C]0.004459[/C][C]0.0378[/C][C]0.484961[/C][/ROW]
[ROW][C]24[/C][C]0.033074[/C][C]0.2806[/C][C]0.389896[/C][/ROW]
[ROW][C]25[/C][C]-0.002748[/C][C]-0.0233[/C][C]0.49073[/C][/ROW]
[ROW][C]26[/C][C]0.018845[/C][C]0.1599[/C][C]0.436702[/C][/ROW]
[ROW][C]27[/C][C]-0.019605[/C][C]-0.1664[/C][C]0.434173[/C][/ROW]
[ROW][C]28[/C][C]0.085289[/C][C]0.7237[/C][C]0.235798[/C][/ROW]
[ROW][C]29[/C][C]0.093913[/C][C]0.7969[/C][C]0.21407[/C][/ROW]
[ROW][C]30[/C][C]-0.070332[/C][C]-0.5968[/C][C]0.27626[/C][/ROW]
[ROW][C]31[/C][C]0.032173[/C][C]0.273[/C][C]0.392819[/C][/ROW]
[ROW][C]32[/C][C]0.040357[/C][C]0.3424[/C][C]0.366509[/C][/ROW]
[ROW][C]33[/C][C]0.072952[/C][C]0.619[/C][C]0.26893[/C][/ROW]
[ROW][C]34[/C][C]-0.022011[/C][C]-0.1868[/C][C]0.426183[/C][/ROW]
[ROW][C]35[/C][C]-0.023706[/C][C]-0.2012[/C][C]0.420572[/C][/ROW]
[ROW][C]36[/C][C]0.008009[/C][C]0.068[/C][C]0.473005[/C][/ROW]
[ROW][C]37[/C][C]0.010214[/C][C]0.0867[/C][C]0.465588[/C][/ROW]
[ROW][C]38[/C][C]-0.089397[/C][C]-0.7586[/C][C]0.225297[/C][/ROW]
[ROW][C]39[/C][C]-0.012207[/C][C]-0.1036[/C][C]0.458895[/C][/ROW]
[ROW][C]40[/C][C]-0.013316[/C][C]-0.113[/C][C]0.455175[/C][/ROW]
[ROW][C]41[/C][C]-0.036174[/C][C]-0.3069[/C][C]0.379886[/C][/ROW]
[ROW][C]42[/C][C]-0.001973[/C][C]-0.0167[/C][C]0.493345[/C][/ROW]
[ROW][C]43[/C][C]0.107558[/C][C]0.9127[/C][C]0.182234[/C][/ROW]
[ROW][C]44[/C][C]-0.030234[/C][C]-0.2565[/C][C]0.399131[/C][/ROW]
[ROW][C]45[/C][C]-0.023442[/C][C]-0.1989[/C][C]0.421446[/C][/ROW]
[ROW][C]46[/C][C]0.003734[/C][C]0.0317[/C][C]0.487404[/C][/ROW]
[ROW][C]47[/C][C]-0.066628[/C][C]-0.5654[/C][C]0.286795[/C][/ROW]
[ROW][C]48[/C][C]0.044043[/C][C]0.3737[/C][C]0.354856[/C][/ROW]
[/TABLE]
Source: https://freestatistics.org/blog/index.php?pk=75552&T=2

Globally Unique Identifier (entire table): ba.freestatistics.org/blog/index.php?pk=75552&T=2

As an alternative you can also use a QR Code:  

The GUIDs for individual cells are displayed in the table below:

Partial Autocorrelation Function
Time lag kPACF(k)T-STATP-value
10.453293.84630.000128
20.1264861.07330.143368
30.0180290.1530.43942
40.1797931.52560.065746
5-0.026107-0.22150.412655
6-0.102235-0.86750.194276
7-4e-04-0.00340.498649
8-0.097673-0.82880.204982
90.0305320.25910.398158
10-0.054311-0.46080.323151
11-0.022187-0.18830.4256
120.0343740.29170.385688
13-0.04136-0.35090.363325
14-0.099681-0.84580.200227
15-0.07626-0.64710.259817
16-0.013791-0.1170.453584
17-0.016522-0.14020.444448
18-0.011313-0.0960.461895
19-0.118462-1.00520.159087
20-0.028441-0.24130.404994
210.0035830.03040.487915
220.0305240.2590.398185
230.0044590.03780.484961
240.0330740.28060.389896
25-0.002748-0.02330.49073
260.0188450.15990.436702
27-0.019605-0.16640.434173
280.0852890.72370.235798
290.0939130.79690.21407
30-0.070332-0.59680.27626
310.0321730.2730.392819
320.0403570.34240.366509
330.0729520.6190.26893
34-0.022011-0.18680.426183
35-0.023706-0.20120.420572
360.0080090.0680.473005
370.0102140.08670.465588
38-0.089397-0.75860.225297
39-0.012207-0.10360.458895
40-0.013316-0.1130.455175
41-0.036174-0.30690.379886
42-0.001973-0.01670.493345
430.1075580.91270.182234
44-0.030234-0.25650.399131
45-0.023442-0.19890.421446
460.0037340.03170.487404
47-0.066628-0.56540.286795
480.0440430.37370.354856


Parameters (Session):
par1 = 48 ; par2 = 1 ; par3 = 0 ; par4 = 0 ; par5 = 12 ; par6 = White Noise ; par7 = 0.95 ;
Parameters (R input):
par1 = 48 ; par2 = 1 ; par3 = 0 ; par4 = 0 ; par5 = 12 ; par6 = White Noise ; par7 = 0.95 ;
R code (references can be found in the software module):
if (par1 == 'Default') {
par1 = 10*log10(length(x))
} else {
par1 <- as.numeric(par1)
}
par2 <- as.numeric(par2)
par3 <- as.numeric(par3)
par4 <- as.numeric(par4)
par5 <- as.numeric(par5)
if (par6 == 'White Noise') par6 <- 'white' else par6 <- 'ma'
par7 <- as.numeric(par7)
if (par2 == 0) {
x <- log(x)
} else {
x <- (x ^ par2 - 1) / par2
}
if (par3 > 0) x <- diff(x,lag=1,difference=par3)
if (par4 > 0) x <- diff(x,lag=par5,difference=par4)
bitmap(file='pic1.png')
racf <- acf(x, par1, main='Autocorrelation', xlab='time lag', ylab='ACF', ci.type=par6, ci=par7, sub=paste('(lambda=',par2,', d=',par3,', D=',par4,', CI=', par7, ', CI type=',par6,')',sep=''))
dev.off()
bitmap(file='pic2.png')
rpacf <- pacf(x,par1,main='Partial Autocorrelation',xlab='lags',ylab='PACF')
dev.off()
(myacf <- c(racf$acf))
(mypacf <- c(rpacf$acf))
lengthx <- length(x)
sqrtn <- sqrt(lengthx)
load(file='createtable')
a<-table.start()
a<-table.row.start(a)
a<-table.element(a,'Autocorrelation Function',4,TRUE)
a<-table.row.end(a)
a<-table.row.start(a)
a<-table.element(a,'Time lag k',header=TRUE)
a<-table.element(a,hyperlink('basics.htm','ACF(k)','click here for more information about the Autocorrelation Function'),header=TRUE)
a<-table.element(a,'T-STAT',header=TRUE)
a<-table.element(a,'P-value',header=TRUE)
a<-table.row.end(a)
for (i in 2:(par1+1)) {
a<-table.row.start(a)
a<-table.element(a,i-1,header=TRUE)
a<-table.element(a,round(myacf[i],6))
mytstat <- myacf[i]*sqrtn
a<-table.element(a,round(mytstat,4))
a<-table.element(a,round(1-pt(abs(mytstat),lengthx),6))
a<-table.row.end(a)
}
a<-table.end(a)
table.save(a,file='mytable.tab')
a<-table.start()
a<-table.row.start(a)
a<-table.element(a,'Partial Autocorrelation Function',4,TRUE)
a<-table.row.end(a)
a<-table.row.start(a)
a<-table.element(a,'Time lag k',header=TRUE)
a<-table.element(a,hyperlink('basics.htm','PACF(k)','click here for more information about the Partial Autocorrelation Function'),header=TRUE)
a<-table.element(a,'T-STAT',header=TRUE)
a<-table.element(a,'P-value',header=TRUE)
a<-table.row.end(a)
for (i in 1:par1) {
a<-table.row.start(a)
a<-table.element(a,i,header=TRUE)
a<-table.element(a,round(mypacf[i],6))
mytstat <- mypacf[i]*sqrtn
a<-table.element(a,round(mytstat,4))
a<-table.element(a,round(1-pt(abs(mytstat),lengthx),6))
a<-table.row.end(a)
}
a<-table.end(a)
table.save(a,file='mytable1.tab')