Free Statistics

of Irreproducible Research!

Author's title

Author*Unverified author*
R Software Modulerwasp_autocorrelation.wasp
Title produced by software(Partial) Autocorrelation Function
Date of computationWed, 05 May 2010 16:49:43 +0000
Cite this page as followsStatistical Computations at FreeStatistics.org, Office for Research Development and Education, URL https://freestatistics.org/blog/index.php?v=date/2010/May/05/t1273078223jj6dm0y7wnmmxko.htm/, Retrieved Sun, 28 Apr 2024 08:27:56 +0000
Statistical Computations at FreeStatistics.org, Office for Research Development and Education, URL https://freestatistics.org/blog/index.php?pk=75553, Retrieved Sun, 28 Apr 2024 08:27:56 +0000
QR Codes:

Original text written by user:
IsPrivate?No (this computation is public)
User-defined keywordsKDGP2W21
Estimated Impact141
Family? (F = Feedback message, R = changed R code, M = changed R Module, P = changed Parameters, D = changed Data)
-       [(Partial) Autocorrelation Function] [] [2010-05-05 16:49:43] [676a4f18bfa59791b951d67c8b4b8fd1] [Current]
Feedback Forum

Post a new message
Dataseries X:
77
70
67
76
85
106
108
120
108
111
109
104
104
117
111
110
116
118
115
111
112
97
106
93
95
97
81
71
75
70
72
80
78
80
81
99
87
100
95
128
112
104
102
108
103
99
96
85
78
74
106
100
109
87
107
106
109
83
84
83
65
68
61
75
66
78
68
68
174
64
48
45


Summary of computational transaction
Raw Inputview raw input (R code)
Raw Outputview raw output of R engine
Computing time2 seconds
R Server'George Udny Yule' @ 72.249.76.132

\begin{tabular}{lllllllll}
\hline
Summary of computational transaction \tabularnewline
Raw Input & view raw input (R code)  \tabularnewline
Raw Output & view raw output of R engine  \tabularnewline
Computing time & 2 seconds \tabularnewline
R Server & 'George Udny Yule' @ 72.249.76.132 \tabularnewline
\hline
\end{tabular}
%Source: https://freestatistics.org/blog/index.php?pk=75553&T=0

[TABLE]
[ROW][C]Summary of computational transaction[/C][/ROW]
[ROW][C]Raw Input[/C][C]view raw input (R code) [/C][/ROW]
[ROW][C]Raw Output[/C][C]view raw output of R engine [/C][/ROW]
[ROW][C]Computing time[/C][C]2 seconds[/C][/ROW]
[ROW][C]R Server[/C][C]'George Udny Yule' @ 72.249.76.132[/C][/ROW]
[/TABLE]
Source: https://freestatistics.org/blog/index.php?pk=75553&T=0

Globally Unique Identifier (entire table): ba.freestatistics.org/blog/index.php?pk=75553&T=0

As an alternative you can also use a QR Code:  

The GUIDs for individual cells are displayed in the table below:

Summary of computational transaction
Raw Inputview raw input (R code)
Raw Outputview raw output of R engine
Computing time2 seconds
R Server'George Udny Yule' @ 72.249.76.132


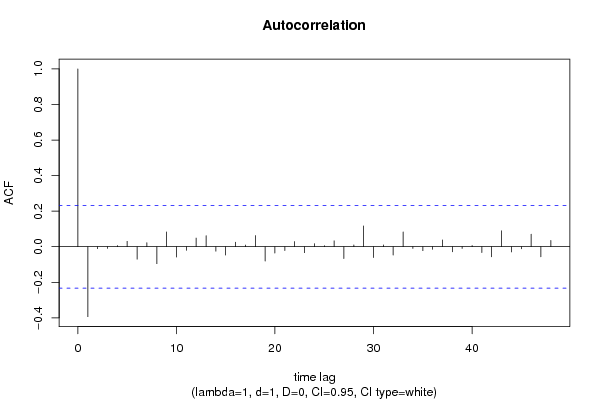
Autocorrelation Function
Time lag kACF(k)T-STATP-value
1-0.393273-3.31380.000726
2-0.011104-0.09360.462861
3-0.009425-0.07940.468461
40.0067530.05690.477393
50.030780.25940.398056
6-0.069996-0.58980.2786
70.0226710.1910.424525
8-0.095044-0.80090.212944
90.0831180.70040.242993
10-0.057839-0.48740.313753
11-0.020454-0.17230.431827
120.0486350.40980.341593
130.0623710.52550.300421
14-0.025007-0.21070.416857
15-0.04701-0.39610.346604
160.0253150.21330.415849
170.009430.07950.468446
180.0625980.52750.299758
19-0.080887-0.68160.248864
20-0.035615-0.30010.38249
21-0.021348-0.17990.42888
220.0293710.24750.402623
23-0.033725-0.28420.388553
240.0173320.1460.442152
250.0056180.04730.481189
260.0336120.28320.388917
27-0.06626-0.55830.289191
280.0099210.08360.466807
290.1171730.98730.16342
30-0.061054-0.51450.304266
310.0103910.08760.465237
32-0.046868-0.39490.347045
330.0832890.70180.242547
34-0.009391-0.07910.468576
35-0.02205-0.18580.426567
36-0.014508-0.12220.451525
370.0385560.32490.373113
38-0.028596-0.2410.405143
39-0.009835-0.08290.467093
400.0063730.05370.478664
41-0.033137-0.27920.390445
42-0.056468-0.47580.317837
430.0896260.75520.226312
44-0.029285-0.24680.402904
45-0.011591-0.09770.461234
460.0706050.59490.27689
47-0.056974-0.48010.316326
480.0355370.29940.382738

\begin{tabular}{lllllllll}
\hline
Autocorrelation Function \tabularnewline
Time lag k & ACF(k) & T-STAT & P-value \tabularnewline
1 & -0.393273 & -3.3138 & 0.000726 \tabularnewline
2 & -0.011104 & -0.0936 & 0.462861 \tabularnewline
3 & -0.009425 & -0.0794 & 0.468461 \tabularnewline
4 & 0.006753 & 0.0569 & 0.477393 \tabularnewline
5 & 0.03078 & 0.2594 & 0.398056 \tabularnewline
6 & -0.069996 & -0.5898 & 0.2786 \tabularnewline
7 & 0.022671 & 0.191 & 0.424525 \tabularnewline
8 & -0.095044 & -0.8009 & 0.212944 \tabularnewline
9 & 0.083118 & 0.7004 & 0.242993 \tabularnewline
10 & -0.057839 & -0.4874 & 0.313753 \tabularnewline
11 & -0.020454 & -0.1723 & 0.431827 \tabularnewline
12 & 0.048635 & 0.4098 & 0.341593 \tabularnewline
13 & 0.062371 & 0.5255 & 0.300421 \tabularnewline
14 & -0.025007 & -0.2107 & 0.416857 \tabularnewline
15 & -0.04701 & -0.3961 & 0.346604 \tabularnewline
16 & 0.025315 & 0.2133 & 0.415849 \tabularnewline
17 & 0.00943 & 0.0795 & 0.468446 \tabularnewline
18 & 0.062598 & 0.5275 & 0.299758 \tabularnewline
19 & -0.080887 & -0.6816 & 0.248864 \tabularnewline
20 & -0.035615 & -0.3001 & 0.38249 \tabularnewline
21 & -0.021348 & -0.1799 & 0.42888 \tabularnewline
22 & 0.029371 & 0.2475 & 0.402623 \tabularnewline
23 & -0.033725 & -0.2842 & 0.388553 \tabularnewline
24 & 0.017332 & 0.146 & 0.442152 \tabularnewline
25 & 0.005618 & 0.0473 & 0.481189 \tabularnewline
26 & 0.033612 & 0.2832 & 0.388917 \tabularnewline
27 & -0.06626 & -0.5583 & 0.289191 \tabularnewline
28 & 0.009921 & 0.0836 & 0.466807 \tabularnewline
29 & 0.117173 & 0.9873 & 0.16342 \tabularnewline
30 & -0.061054 & -0.5145 & 0.304266 \tabularnewline
31 & 0.010391 & 0.0876 & 0.465237 \tabularnewline
32 & -0.046868 & -0.3949 & 0.347045 \tabularnewline
33 & 0.083289 & 0.7018 & 0.242547 \tabularnewline
34 & -0.009391 & -0.0791 & 0.468576 \tabularnewline
35 & -0.02205 & -0.1858 & 0.426567 \tabularnewline
36 & -0.014508 & -0.1222 & 0.451525 \tabularnewline
37 & 0.038556 & 0.3249 & 0.373113 \tabularnewline
38 & -0.028596 & -0.241 & 0.405143 \tabularnewline
39 & -0.009835 & -0.0829 & 0.467093 \tabularnewline
40 & 0.006373 & 0.0537 & 0.478664 \tabularnewline
41 & -0.033137 & -0.2792 & 0.390445 \tabularnewline
42 & -0.056468 & -0.4758 & 0.317837 \tabularnewline
43 & 0.089626 & 0.7552 & 0.226312 \tabularnewline
44 & -0.029285 & -0.2468 & 0.402904 \tabularnewline
45 & -0.011591 & -0.0977 & 0.461234 \tabularnewline
46 & 0.070605 & 0.5949 & 0.27689 \tabularnewline
47 & -0.056974 & -0.4801 & 0.316326 \tabularnewline
48 & 0.035537 & 0.2994 & 0.382738 \tabularnewline
\hline
\end{tabular}
%Source: https://freestatistics.org/blog/index.php?pk=75553&T=1

[TABLE]
[ROW][C]Autocorrelation Function[/C][/ROW]
[ROW][C]Time lag k[/C][C]ACF(k)[/C][C]T-STAT[/C][C]P-value[/C][/ROW]
[ROW][C]1[/C][C]-0.393273[/C][C]-3.3138[/C][C]0.000726[/C][/ROW]
[ROW][C]2[/C][C]-0.011104[/C][C]-0.0936[/C][C]0.462861[/C][/ROW]
[ROW][C]3[/C][C]-0.009425[/C][C]-0.0794[/C][C]0.468461[/C][/ROW]
[ROW][C]4[/C][C]0.006753[/C][C]0.0569[/C][C]0.477393[/C][/ROW]
[ROW][C]5[/C][C]0.03078[/C][C]0.2594[/C][C]0.398056[/C][/ROW]
[ROW][C]6[/C][C]-0.069996[/C][C]-0.5898[/C][C]0.2786[/C][/ROW]
[ROW][C]7[/C][C]0.022671[/C][C]0.191[/C][C]0.424525[/C][/ROW]
[ROW][C]8[/C][C]-0.095044[/C][C]-0.8009[/C][C]0.212944[/C][/ROW]
[ROW][C]9[/C][C]0.083118[/C][C]0.7004[/C][C]0.242993[/C][/ROW]
[ROW][C]10[/C][C]-0.057839[/C][C]-0.4874[/C][C]0.313753[/C][/ROW]
[ROW][C]11[/C][C]-0.020454[/C][C]-0.1723[/C][C]0.431827[/C][/ROW]
[ROW][C]12[/C][C]0.048635[/C][C]0.4098[/C][C]0.341593[/C][/ROW]
[ROW][C]13[/C][C]0.062371[/C][C]0.5255[/C][C]0.300421[/C][/ROW]
[ROW][C]14[/C][C]-0.025007[/C][C]-0.2107[/C][C]0.416857[/C][/ROW]
[ROW][C]15[/C][C]-0.04701[/C][C]-0.3961[/C][C]0.346604[/C][/ROW]
[ROW][C]16[/C][C]0.025315[/C][C]0.2133[/C][C]0.415849[/C][/ROW]
[ROW][C]17[/C][C]0.00943[/C][C]0.0795[/C][C]0.468446[/C][/ROW]
[ROW][C]18[/C][C]0.062598[/C][C]0.5275[/C][C]0.299758[/C][/ROW]
[ROW][C]19[/C][C]-0.080887[/C][C]-0.6816[/C][C]0.248864[/C][/ROW]
[ROW][C]20[/C][C]-0.035615[/C][C]-0.3001[/C][C]0.38249[/C][/ROW]
[ROW][C]21[/C][C]-0.021348[/C][C]-0.1799[/C][C]0.42888[/C][/ROW]
[ROW][C]22[/C][C]0.029371[/C][C]0.2475[/C][C]0.402623[/C][/ROW]
[ROW][C]23[/C][C]-0.033725[/C][C]-0.2842[/C][C]0.388553[/C][/ROW]
[ROW][C]24[/C][C]0.017332[/C][C]0.146[/C][C]0.442152[/C][/ROW]
[ROW][C]25[/C][C]0.005618[/C][C]0.0473[/C][C]0.481189[/C][/ROW]
[ROW][C]26[/C][C]0.033612[/C][C]0.2832[/C][C]0.388917[/C][/ROW]
[ROW][C]27[/C][C]-0.06626[/C][C]-0.5583[/C][C]0.289191[/C][/ROW]
[ROW][C]28[/C][C]0.009921[/C][C]0.0836[/C][C]0.466807[/C][/ROW]
[ROW][C]29[/C][C]0.117173[/C][C]0.9873[/C][C]0.16342[/C][/ROW]
[ROW][C]30[/C][C]-0.061054[/C][C]-0.5145[/C][C]0.304266[/C][/ROW]
[ROW][C]31[/C][C]0.010391[/C][C]0.0876[/C][C]0.465237[/C][/ROW]
[ROW][C]32[/C][C]-0.046868[/C][C]-0.3949[/C][C]0.347045[/C][/ROW]
[ROW][C]33[/C][C]0.083289[/C][C]0.7018[/C][C]0.242547[/C][/ROW]
[ROW][C]34[/C][C]-0.009391[/C][C]-0.0791[/C][C]0.468576[/C][/ROW]
[ROW][C]35[/C][C]-0.02205[/C][C]-0.1858[/C][C]0.426567[/C][/ROW]
[ROW][C]36[/C][C]-0.014508[/C][C]-0.1222[/C][C]0.451525[/C][/ROW]
[ROW][C]37[/C][C]0.038556[/C][C]0.3249[/C][C]0.373113[/C][/ROW]
[ROW][C]38[/C][C]-0.028596[/C][C]-0.241[/C][C]0.405143[/C][/ROW]
[ROW][C]39[/C][C]-0.009835[/C][C]-0.0829[/C][C]0.467093[/C][/ROW]
[ROW][C]40[/C][C]0.006373[/C][C]0.0537[/C][C]0.478664[/C][/ROW]
[ROW][C]41[/C][C]-0.033137[/C][C]-0.2792[/C][C]0.390445[/C][/ROW]
[ROW][C]42[/C][C]-0.056468[/C][C]-0.4758[/C][C]0.317837[/C][/ROW]
[ROW][C]43[/C][C]0.089626[/C][C]0.7552[/C][C]0.226312[/C][/ROW]
[ROW][C]44[/C][C]-0.029285[/C][C]-0.2468[/C][C]0.402904[/C][/ROW]
[ROW][C]45[/C][C]-0.011591[/C][C]-0.0977[/C][C]0.461234[/C][/ROW]
[ROW][C]46[/C][C]0.070605[/C][C]0.5949[/C][C]0.27689[/C][/ROW]
[ROW][C]47[/C][C]-0.056974[/C][C]-0.4801[/C][C]0.316326[/C][/ROW]
[ROW][C]48[/C][C]0.035537[/C][C]0.2994[/C][C]0.382738[/C][/ROW]
[/TABLE]
Source: https://freestatistics.org/blog/index.php?pk=75553&T=1

Globally Unique Identifier (entire table): ba.freestatistics.org/blog/index.php?pk=75553&T=1

As an alternative you can also use a QR Code:  

The GUIDs for individual cells are displayed in the table below:

Autocorrelation Function
Time lag kACF(k)T-STATP-value
1-0.393273-3.31380.000726
2-0.011104-0.09360.462861
3-0.009425-0.07940.468461
40.0067530.05690.477393
50.030780.25940.398056
6-0.069996-0.58980.2786
70.0226710.1910.424525
8-0.095044-0.80090.212944
90.0831180.70040.242993
10-0.057839-0.48740.313753
11-0.020454-0.17230.431827
120.0486350.40980.341593
130.0623710.52550.300421
14-0.025007-0.21070.416857
15-0.04701-0.39610.346604
160.0253150.21330.415849
170.009430.07950.468446
180.0625980.52750.299758
19-0.080887-0.68160.248864
20-0.035615-0.30010.38249
21-0.021348-0.17990.42888
220.0293710.24750.402623
23-0.033725-0.28420.388553
240.0173320.1460.442152
250.0056180.04730.481189
260.0336120.28320.388917
27-0.06626-0.55830.289191
280.0099210.08360.466807
290.1171730.98730.16342
30-0.061054-0.51450.304266
310.0103910.08760.465237
32-0.046868-0.39490.347045
330.0832890.70180.242547
34-0.009391-0.07910.468576
35-0.02205-0.18580.426567
36-0.014508-0.12220.451525
370.0385560.32490.373113
38-0.028596-0.2410.405143
39-0.009835-0.08290.467093
400.0063730.05370.478664
41-0.033137-0.27920.390445
42-0.056468-0.47580.317837
430.0896260.75520.226312
44-0.029285-0.24680.402904
45-0.011591-0.09770.461234
460.0706050.59490.27689
47-0.056974-0.48010.316326
480.0355370.29940.382738


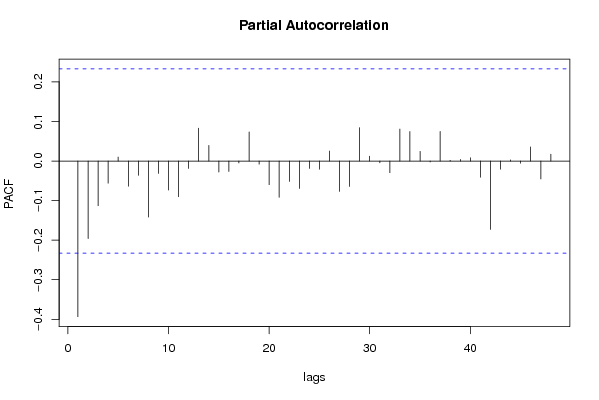
Partial Autocorrelation Function
Time lag kPACF(k)T-STATP-value
1-0.393273-3.31380.000726
2-0.196096-1.65230.051441
3-0.112899-0.95130.172338
4-0.056148-0.47310.318793
50.0100330.08450.466434
6-0.063527-0.53530.297062
7-0.036251-0.30550.380457
8-0.141642-1.19350.118324
9-0.031353-0.26420.396202
10-0.073438-0.61880.269016
11-0.090324-0.76110.224565
12-0.018631-0.1570.437851
130.0827990.69770.243828
140.0394830.33270.370174
15-0.027987-0.23580.407126
16-0.026213-0.22090.41291
17-0.004987-0.0420.483301
180.0734870.61920.268879
19-0.008084-0.06810.472941
20-0.060002-0.50560.307356
21-0.091825-0.77370.220829
22-0.051607-0.43490.332495
23-0.06923-0.58330.280755
24-0.018937-0.15960.436839
25-0.02053-0.1730.431576
260.025260.21280.416028
27-0.076889-0.64790.259576
28-0.064289-0.54170.294859
290.0842330.70980.240088
300.0122930.10360.458895
31-0.004502-0.03790.484922
32-0.029507-0.24860.402181
330.0806810.67980.249411
340.0745190.62790.266039
350.0243450.20510.419026
36-0.002343-0.01970.492151
370.074680.62930.265599
380.0016950.01430.494323
390.0039280.03310.486844
400.00810.06820.472889
41-0.041052-0.34590.365217
42-0.172934-1.45720.07474
43-0.02056-0.17320.431478
440.0025730.02170.491382
45-0.005478-0.04620.481658
460.035460.29880.382986
47-0.045341-0.38210.351782
480.0173180.14590.442198

\begin{tabular}{lllllllll}
\hline
Partial Autocorrelation Function \tabularnewline
Time lag k & PACF(k) & T-STAT & P-value \tabularnewline
1 & -0.393273 & -3.3138 & 0.000726 \tabularnewline
2 & -0.196096 & -1.6523 & 0.051441 \tabularnewline
3 & -0.112899 & -0.9513 & 0.172338 \tabularnewline
4 & -0.056148 & -0.4731 & 0.318793 \tabularnewline
5 & 0.010033 & 0.0845 & 0.466434 \tabularnewline
6 & -0.063527 & -0.5353 & 0.297062 \tabularnewline
7 & -0.036251 & -0.3055 & 0.380457 \tabularnewline
8 & -0.141642 & -1.1935 & 0.118324 \tabularnewline
9 & -0.031353 & -0.2642 & 0.396202 \tabularnewline
10 & -0.073438 & -0.6188 & 0.269016 \tabularnewline
11 & -0.090324 & -0.7611 & 0.224565 \tabularnewline
12 & -0.018631 & -0.157 & 0.437851 \tabularnewline
13 & 0.082799 & 0.6977 & 0.243828 \tabularnewline
14 & 0.039483 & 0.3327 & 0.370174 \tabularnewline
15 & -0.027987 & -0.2358 & 0.407126 \tabularnewline
16 & -0.026213 & -0.2209 & 0.41291 \tabularnewline
17 & -0.004987 & -0.042 & 0.483301 \tabularnewline
18 & 0.073487 & 0.6192 & 0.268879 \tabularnewline
19 & -0.008084 & -0.0681 & 0.472941 \tabularnewline
20 & -0.060002 & -0.5056 & 0.307356 \tabularnewline
21 & -0.091825 & -0.7737 & 0.220829 \tabularnewline
22 & -0.051607 & -0.4349 & 0.332495 \tabularnewline
23 & -0.06923 & -0.5833 & 0.280755 \tabularnewline
24 & -0.018937 & -0.1596 & 0.436839 \tabularnewline
25 & -0.02053 & -0.173 & 0.431576 \tabularnewline
26 & 0.02526 & 0.2128 & 0.416028 \tabularnewline
27 & -0.076889 & -0.6479 & 0.259576 \tabularnewline
28 & -0.064289 & -0.5417 & 0.294859 \tabularnewline
29 & 0.084233 & 0.7098 & 0.240088 \tabularnewline
30 & 0.012293 & 0.1036 & 0.458895 \tabularnewline
31 & -0.004502 & -0.0379 & 0.484922 \tabularnewline
32 & -0.029507 & -0.2486 & 0.402181 \tabularnewline
33 & 0.080681 & 0.6798 & 0.249411 \tabularnewline
34 & 0.074519 & 0.6279 & 0.266039 \tabularnewline
35 & 0.024345 & 0.2051 & 0.419026 \tabularnewline
36 & -0.002343 & -0.0197 & 0.492151 \tabularnewline
37 & 0.07468 & 0.6293 & 0.265599 \tabularnewline
38 & 0.001695 & 0.0143 & 0.494323 \tabularnewline
39 & 0.003928 & 0.0331 & 0.486844 \tabularnewline
40 & 0.0081 & 0.0682 & 0.472889 \tabularnewline
41 & -0.041052 & -0.3459 & 0.365217 \tabularnewline
42 & -0.172934 & -1.4572 & 0.07474 \tabularnewline
43 & -0.02056 & -0.1732 & 0.431478 \tabularnewline
44 & 0.002573 & 0.0217 & 0.491382 \tabularnewline
45 & -0.005478 & -0.0462 & 0.481658 \tabularnewline
46 & 0.03546 & 0.2988 & 0.382986 \tabularnewline
47 & -0.045341 & -0.3821 & 0.351782 \tabularnewline
48 & 0.017318 & 0.1459 & 0.442198 \tabularnewline
\hline
\end{tabular}
%Source: https://freestatistics.org/blog/index.php?pk=75553&T=2

[TABLE]
[ROW][C]Partial Autocorrelation Function[/C][/ROW]
[ROW][C]Time lag k[/C][C]PACF(k)[/C][C]T-STAT[/C][C]P-value[/C][/ROW]
[ROW][C]1[/C][C]-0.393273[/C][C]-3.3138[/C][C]0.000726[/C][/ROW]
[ROW][C]2[/C][C]-0.196096[/C][C]-1.6523[/C][C]0.051441[/C][/ROW]
[ROW][C]3[/C][C]-0.112899[/C][C]-0.9513[/C][C]0.172338[/C][/ROW]
[ROW][C]4[/C][C]-0.056148[/C][C]-0.4731[/C][C]0.318793[/C][/ROW]
[ROW][C]5[/C][C]0.010033[/C][C]0.0845[/C][C]0.466434[/C][/ROW]
[ROW][C]6[/C][C]-0.063527[/C][C]-0.5353[/C][C]0.297062[/C][/ROW]
[ROW][C]7[/C][C]-0.036251[/C][C]-0.3055[/C][C]0.380457[/C][/ROW]
[ROW][C]8[/C][C]-0.141642[/C][C]-1.1935[/C][C]0.118324[/C][/ROW]
[ROW][C]9[/C][C]-0.031353[/C][C]-0.2642[/C][C]0.396202[/C][/ROW]
[ROW][C]10[/C][C]-0.073438[/C][C]-0.6188[/C][C]0.269016[/C][/ROW]
[ROW][C]11[/C][C]-0.090324[/C][C]-0.7611[/C][C]0.224565[/C][/ROW]
[ROW][C]12[/C][C]-0.018631[/C][C]-0.157[/C][C]0.437851[/C][/ROW]
[ROW][C]13[/C][C]0.082799[/C][C]0.6977[/C][C]0.243828[/C][/ROW]
[ROW][C]14[/C][C]0.039483[/C][C]0.3327[/C][C]0.370174[/C][/ROW]
[ROW][C]15[/C][C]-0.027987[/C][C]-0.2358[/C][C]0.407126[/C][/ROW]
[ROW][C]16[/C][C]-0.026213[/C][C]-0.2209[/C][C]0.41291[/C][/ROW]
[ROW][C]17[/C][C]-0.004987[/C][C]-0.042[/C][C]0.483301[/C][/ROW]
[ROW][C]18[/C][C]0.073487[/C][C]0.6192[/C][C]0.268879[/C][/ROW]
[ROW][C]19[/C][C]-0.008084[/C][C]-0.0681[/C][C]0.472941[/C][/ROW]
[ROW][C]20[/C][C]-0.060002[/C][C]-0.5056[/C][C]0.307356[/C][/ROW]
[ROW][C]21[/C][C]-0.091825[/C][C]-0.7737[/C][C]0.220829[/C][/ROW]
[ROW][C]22[/C][C]-0.051607[/C][C]-0.4349[/C][C]0.332495[/C][/ROW]
[ROW][C]23[/C][C]-0.06923[/C][C]-0.5833[/C][C]0.280755[/C][/ROW]
[ROW][C]24[/C][C]-0.018937[/C][C]-0.1596[/C][C]0.436839[/C][/ROW]
[ROW][C]25[/C][C]-0.02053[/C][C]-0.173[/C][C]0.431576[/C][/ROW]
[ROW][C]26[/C][C]0.02526[/C][C]0.2128[/C][C]0.416028[/C][/ROW]
[ROW][C]27[/C][C]-0.076889[/C][C]-0.6479[/C][C]0.259576[/C][/ROW]
[ROW][C]28[/C][C]-0.064289[/C][C]-0.5417[/C][C]0.294859[/C][/ROW]
[ROW][C]29[/C][C]0.084233[/C][C]0.7098[/C][C]0.240088[/C][/ROW]
[ROW][C]30[/C][C]0.012293[/C][C]0.1036[/C][C]0.458895[/C][/ROW]
[ROW][C]31[/C][C]-0.004502[/C][C]-0.0379[/C][C]0.484922[/C][/ROW]
[ROW][C]32[/C][C]-0.029507[/C][C]-0.2486[/C][C]0.402181[/C][/ROW]
[ROW][C]33[/C][C]0.080681[/C][C]0.6798[/C][C]0.249411[/C][/ROW]
[ROW][C]34[/C][C]0.074519[/C][C]0.6279[/C][C]0.266039[/C][/ROW]
[ROW][C]35[/C][C]0.024345[/C][C]0.2051[/C][C]0.419026[/C][/ROW]
[ROW][C]36[/C][C]-0.002343[/C][C]-0.0197[/C][C]0.492151[/C][/ROW]
[ROW][C]37[/C][C]0.07468[/C][C]0.6293[/C][C]0.265599[/C][/ROW]
[ROW][C]38[/C][C]0.001695[/C][C]0.0143[/C][C]0.494323[/C][/ROW]
[ROW][C]39[/C][C]0.003928[/C][C]0.0331[/C][C]0.486844[/C][/ROW]
[ROW][C]40[/C][C]0.0081[/C][C]0.0682[/C][C]0.472889[/C][/ROW]
[ROW][C]41[/C][C]-0.041052[/C][C]-0.3459[/C][C]0.365217[/C][/ROW]
[ROW][C]42[/C][C]-0.172934[/C][C]-1.4572[/C][C]0.07474[/C][/ROW]
[ROW][C]43[/C][C]-0.02056[/C][C]-0.1732[/C][C]0.431478[/C][/ROW]
[ROW][C]44[/C][C]0.002573[/C][C]0.0217[/C][C]0.491382[/C][/ROW]
[ROW][C]45[/C][C]-0.005478[/C][C]-0.0462[/C][C]0.481658[/C][/ROW]
[ROW][C]46[/C][C]0.03546[/C][C]0.2988[/C][C]0.382986[/C][/ROW]
[ROW][C]47[/C][C]-0.045341[/C][C]-0.3821[/C][C]0.351782[/C][/ROW]
[ROW][C]48[/C][C]0.017318[/C][C]0.1459[/C][C]0.442198[/C][/ROW]
[/TABLE]
Source: https://freestatistics.org/blog/index.php?pk=75553&T=2

Globally Unique Identifier (entire table): ba.freestatistics.org/blog/index.php?pk=75553&T=2

As an alternative you can also use a QR Code:  

The GUIDs for individual cells are displayed in the table below:

Partial Autocorrelation Function
Time lag kPACF(k)T-STATP-value
1-0.393273-3.31380.000726
2-0.196096-1.65230.051441
3-0.112899-0.95130.172338
4-0.056148-0.47310.318793
50.0100330.08450.466434
6-0.063527-0.53530.297062
7-0.036251-0.30550.380457
8-0.141642-1.19350.118324
9-0.031353-0.26420.396202
10-0.073438-0.61880.269016
11-0.090324-0.76110.224565
12-0.018631-0.1570.437851
130.0827990.69770.243828
140.0394830.33270.370174
15-0.027987-0.23580.407126
16-0.026213-0.22090.41291
17-0.004987-0.0420.483301
180.0734870.61920.268879
19-0.008084-0.06810.472941
20-0.060002-0.50560.307356
21-0.091825-0.77370.220829
22-0.051607-0.43490.332495
23-0.06923-0.58330.280755
24-0.018937-0.15960.436839
25-0.02053-0.1730.431576
260.025260.21280.416028
27-0.076889-0.64790.259576
28-0.064289-0.54170.294859
290.0842330.70980.240088
300.0122930.10360.458895
31-0.004502-0.03790.484922
32-0.029507-0.24860.402181
330.0806810.67980.249411
340.0745190.62790.266039
350.0243450.20510.419026
36-0.002343-0.01970.492151
370.074680.62930.265599
380.0016950.01430.494323
390.0039280.03310.486844
400.00810.06820.472889
41-0.041052-0.34590.365217
42-0.172934-1.45720.07474
43-0.02056-0.17320.431478
440.0025730.02170.491382
45-0.005478-0.04620.481658
460.035460.29880.382986
47-0.045341-0.38210.351782
480.0173180.14590.442198


Parameters (Session):
par1 = 48 ; par2 = 1 ; par3 = 1 ; par4 = 0 ; par5 = 12 ; par6 = White Noise ; par7 = 0.95 ;
Parameters (R input):
par1 = 48 ; par2 = 1 ; par3 = 1 ; par4 = 0 ; par5 = 12 ; par6 = White Noise ; par7 = 0.95 ;
R code (references can be found in the software module):
if (par1 == 'Default') {
par1 = 10*log10(length(x))
} else {
par1 <- as.numeric(par1)
}
par2 <- as.numeric(par2)
par3 <- as.numeric(par3)
par4 <- as.numeric(par4)
par5 <- as.numeric(par5)
if (par6 == 'White Noise') par6 <- 'white' else par6 <- 'ma'
par7 <- as.numeric(par7)
if (par2 == 0) {
x <- log(x)
} else {
x <- (x ^ par2 - 1) / par2
}
if (par3 > 0) x <- diff(x,lag=1,difference=par3)
if (par4 > 0) x <- diff(x,lag=par5,difference=par4)
bitmap(file='pic1.png')
racf <- acf(x, par1, main='Autocorrelation', xlab='time lag', ylab='ACF', ci.type=par6, ci=par7, sub=paste('(lambda=',par2,', d=',par3,', D=',par4,', CI=', par7, ', CI type=',par6,')',sep=''))
dev.off()
bitmap(file='pic2.png')
rpacf <- pacf(x,par1,main='Partial Autocorrelation',xlab='lags',ylab='PACF')
dev.off()
(myacf <- c(racf$acf))
(mypacf <- c(rpacf$acf))
lengthx <- length(x)
sqrtn <- sqrt(lengthx)
load(file='createtable')
a<-table.start()
a<-table.row.start(a)
a<-table.element(a,'Autocorrelation Function',4,TRUE)
a<-table.row.end(a)
a<-table.row.start(a)
a<-table.element(a,'Time lag k',header=TRUE)
a<-table.element(a,hyperlink('basics.htm','ACF(k)','click here for more information about the Autocorrelation Function'),header=TRUE)
a<-table.element(a,'T-STAT',header=TRUE)
a<-table.element(a,'P-value',header=TRUE)
a<-table.row.end(a)
for (i in 2:(par1+1)) {
a<-table.row.start(a)
a<-table.element(a,i-1,header=TRUE)
a<-table.element(a,round(myacf[i],6))
mytstat <- myacf[i]*sqrtn
a<-table.element(a,round(mytstat,4))
a<-table.element(a,round(1-pt(abs(mytstat),lengthx),6))
a<-table.row.end(a)
}
a<-table.end(a)
table.save(a,file='mytable.tab')
a<-table.start()
a<-table.row.start(a)
a<-table.element(a,'Partial Autocorrelation Function',4,TRUE)
a<-table.row.end(a)
a<-table.row.start(a)
a<-table.element(a,'Time lag k',header=TRUE)
a<-table.element(a,hyperlink('basics.htm','PACF(k)','click here for more information about the Partial Autocorrelation Function'),header=TRUE)
a<-table.element(a,'T-STAT',header=TRUE)
a<-table.element(a,'P-value',header=TRUE)
a<-table.row.end(a)
for (i in 1:par1) {
a<-table.row.start(a)
a<-table.element(a,i,header=TRUE)
a<-table.element(a,round(mypacf[i],6))
mytstat <- mypacf[i]*sqrtn
a<-table.element(a,round(mytstat,4))
a<-table.element(a,round(1-pt(abs(mytstat),lengthx),6))
a<-table.row.end(a)
}
a<-table.end(a)
table.save(a,file='mytable1.tab')