Free Statistics

of Irreproducible Research!

Author's title

Author*Unverified author*
R Software Modulerwasp_autocorrelation.wasp
Title produced by software(Partial) Autocorrelation Function
Date of computationWed, 05 May 2010 17:40:08 +0000
Cite this page as followsStatistical Computations at FreeStatistics.org, Office for Research Development and Education, URL https://freestatistics.org/blog/index.php?v=date/2010/May/05/t12730812400t75qpayl9es8za.htm/, Retrieved Sat, 27 Apr 2024 13:19:52 +0000
Statistical Computations at FreeStatistics.org, Office for Research Development and Education, URL https://freestatistics.org/blog/index.php?pk=75558, Retrieved Sat, 27 Apr 2024 13:19:52 +0000
QR Codes:

Original text written by user:
IsPrivate?No (this computation is public)
User-defined keywordsKDGP2W21
Estimated Impact126
Family? (F = Feedback message, R = changed R code, M = changed R Module, P = changed Parameters, D = changed Data)
-       [(Partial) Autocorrelation Function] [Jeroen De Laet op...] [2010-05-05 17:40:08] [9646448ed4269a7a4a2c0c7243faa64c] [Current]
Feedback Forum

Post a new message
Dataseries X:
15136
16733
20016
17708
18019
19227
22893
23739
21133
22591
26786
29740
15028
17977
20008
21354
19498
22125
25817
28779
20960
22254
27392
29945
16933
17892
20533
23569
22417
22084
26580
27454
24081
23451
28991
31386
16896
20045
23471
21747
25621
23859
25500
30998
24475
23145
29701
34365
17556
22077
25702
22214
26886
23191
27831
35406
23195
25110
30009
36242
18450
21845
26488
22394
28057
25451
24872
33424
24052
28449
33533
37351
19969
21701
26249
24493
24603
26485
30723
34569
26689
26157
32064
38870
21337
19419
23166
28286
24570
24001
33151
24878
26804
28967
33311
40226
20504
23060
23562
27562
23940
24584
34303
25517
23494
29095
32903
34379
16991
21109
23740
25552
21752
20294
29009
25500
24166
26960
31222
38641
14672
17543
25453
32683
22449
22316
27595
25451
25421
25288
32568
35110
16052
22146
21198
19543
22084
23816
29961
26773
26635
26972
30207
38687
16974
21697
24179
23757
25013
24019
30345
24488
25156
25650
30923
37240
17466
19463
24352
26805
25236
24735
29356
31234
22724
28496
32857
37198
13652
22784
23565
26323
23779
27549
29660
23356


Summary of computational transaction
Raw Inputview raw input (R code)
Raw Outputview raw output of R engine
Computing time1 seconds
R Server'RServer@AstonUniversity' @ vre.aston.ac.uk

\begin{tabular}{lllllllll}
\hline
Summary of computational transaction \tabularnewline
Raw Input & view raw input (R code)  \tabularnewline
Raw Output & view raw output of R engine  \tabularnewline
Computing time & 1 seconds \tabularnewline
R Server & 'RServer@AstonUniversity' @ vre.aston.ac.uk \tabularnewline
\hline
\end{tabular}
%Source: https://freestatistics.org/blog/index.php?pk=75558&T=0

[TABLE]
[ROW][C]Summary of computational transaction[/C][/ROW]
[ROW][C]Raw Input[/C][C]view raw input (R code) [/C][/ROW]
[ROW][C]Raw Output[/C][C]view raw output of R engine [/C][/ROW]
[ROW][C]Computing time[/C][C]1 seconds[/C][/ROW]
[ROW][C]R Server[/C][C]'RServer@AstonUniversity' @ vre.aston.ac.uk[/C][/ROW]
[/TABLE]
Source: https://freestatistics.org/blog/index.php?pk=75558&T=0

Globally Unique Identifier (entire table): ba.freestatistics.org/blog/index.php?pk=75558&T=0

As an alternative you can also use a QR Code:  

The GUIDs for individual cells are displayed in the table below:

Summary of computational transaction
Raw Inputview raw input (R code)
Raw Outputview raw output of R engine
Computing time1 seconds
R Server'RServer@AstonUniversity' @ vre.aston.ac.uk


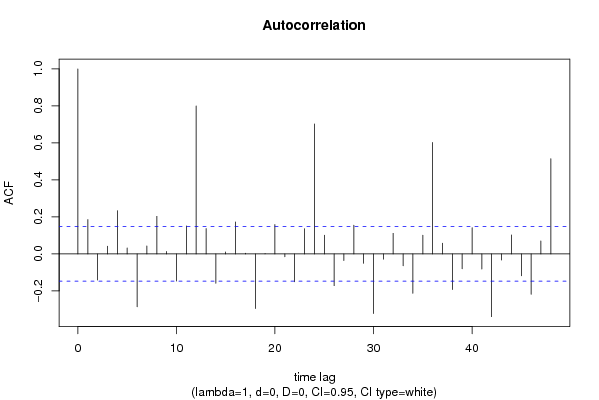
Autocorrelation Function
Time lag kACF(k)T-STATP-value
10.1853472.45890.007452
2-0.141008-1.87070.031524
30.0410750.54490.29325
40.2335183.0980.001134
50.0320120.42470.335793
6-0.286061-3.7950.000101
70.0429930.57040.284579
80.202982.69280.003885
90.012850.17050.432416
10-0.146686-1.9460.026623
110.1513642.00810.023082
120.79996110.61270
130.1367861.81470.035639
14-0.158822-2.1070.018267
150.0101270.13430.446641
160.1729662.29460.011467
170.0039050.05180.479369
18-0.295296-3.91756.4e-05
19-0.000863-0.01140.495441
200.1584312.10180.018496
21-0.015128-0.20070.420585
22-0.150342-1.99450.02382
230.1358161.80180.036644
240.7027049.32240
250.1014811.34630.089968
26-0.171725-2.27820.011959
27-0.03592-0.47650.317143
280.1553482.06090.020391
29-0.051143-0.67850.249177
30-0.322636-4.28021.5e-05
31-0.028421-0.3770.353298
320.1112311.47570.070912
33-0.063989-0.84890.198541
34-0.212963-2.82530.002635
350.1008131.33740.091404
360.6025167.99330
370.0575190.76310.22322
38-0.192574-2.55480.005736
39-0.080489-1.06780.143534
400.1419371.8830.030675
41-0.081686-1.08370.139992
42-0.339273-4.5016e-06
43-0.033585-0.44560.328233
440.1022611.35660.088316
45-0.118328-1.56980.05913
46-0.217989-2.89190.002156
470.0700380.92920.17704
480.5146936.82820

\begin{tabular}{lllllllll}
\hline
Autocorrelation Function \tabularnewline
Time lag k & ACF(k) & T-STAT & P-value \tabularnewline
1 & 0.185347 & 2.4589 & 0.007452 \tabularnewline
2 & -0.141008 & -1.8707 & 0.031524 \tabularnewline
3 & 0.041075 & 0.5449 & 0.29325 \tabularnewline
4 & 0.233518 & 3.098 & 0.001134 \tabularnewline
5 & 0.032012 & 0.4247 & 0.335793 \tabularnewline
6 & -0.286061 & -3.795 & 0.000101 \tabularnewline
7 & 0.042993 & 0.5704 & 0.284579 \tabularnewline
8 & 0.20298 & 2.6928 & 0.003885 \tabularnewline
9 & 0.01285 & 0.1705 & 0.432416 \tabularnewline
10 & -0.146686 & -1.946 & 0.026623 \tabularnewline
11 & 0.151364 & 2.0081 & 0.023082 \tabularnewline
12 & 0.799961 & 10.6127 & 0 \tabularnewline
13 & 0.136786 & 1.8147 & 0.035639 \tabularnewline
14 & -0.158822 & -2.107 & 0.018267 \tabularnewline
15 & 0.010127 & 0.1343 & 0.446641 \tabularnewline
16 & 0.172966 & 2.2946 & 0.011467 \tabularnewline
17 & 0.003905 & 0.0518 & 0.479369 \tabularnewline
18 & -0.295296 & -3.9175 & 6.4e-05 \tabularnewline
19 & -0.000863 & -0.0114 & 0.495441 \tabularnewline
20 & 0.158431 & 2.1018 & 0.018496 \tabularnewline
21 & -0.015128 & -0.2007 & 0.420585 \tabularnewline
22 & -0.150342 & -1.9945 & 0.02382 \tabularnewline
23 & 0.135816 & 1.8018 & 0.036644 \tabularnewline
24 & 0.702704 & 9.3224 & 0 \tabularnewline
25 & 0.101481 & 1.3463 & 0.089968 \tabularnewline
26 & -0.171725 & -2.2782 & 0.011959 \tabularnewline
27 & -0.03592 & -0.4765 & 0.317143 \tabularnewline
28 & 0.155348 & 2.0609 & 0.020391 \tabularnewline
29 & -0.051143 & -0.6785 & 0.249177 \tabularnewline
30 & -0.322636 & -4.2802 & 1.5e-05 \tabularnewline
31 & -0.028421 & -0.377 & 0.353298 \tabularnewline
32 & 0.111231 & 1.4757 & 0.070912 \tabularnewline
33 & -0.063989 & -0.8489 & 0.198541 \tabularnewline
34 & -0.212963 & -2.8253 & 0.002635 \tabularnewline
35 & 0.100813 & 1.3374 & 0.091404 \tabularnewline
36 & 0.602516 & 7.9933 & 0 \tabularnewline
37 & 0.057519 & 0.7631 & 0.22322 \tabularnewline
38 & -0.192574 & -2.5548 & 0.005736 \tabularnewline
39 & -0.080489 & -1.0678 & 0.143534 \tabularnewline
40 & 0.141937 & 1.883 & 0.030675 \tabularnewline
41 & -0.081686 & -1.0837 & 0.139992 \tabularnewline
42 & -0.339273 & -4.501 & 6e-06 \tabularnewline
43 & -0.033585 & -0.4456 & 0.328233 \tabularnewline
44 & 0.102261 & 1.3566 & 0.088316 \tabularnewline
45 & -0.118328 & -1.5698 & 0.05913 \tabularnewline
46 & -0.217989 & -2.8919 & 0.002156 \tabularnewline
47 & 0.070038 & 0.9292 & 0.17704 \tabularnewline
48 & 0.514693 & 6.8282 & 0 \tabularnewline
\hline
\end{tabular}
%Source: https://freestatistics.org/blog/index.php?pk=75558&T=1

[TABLE]
[ROW][C]Autocorrelation Function[/C][/ROW]
[ROW][C]Time lag k[/C][C]ACF(k)[/C][C]T-STAT[/C][C]P-value[/C][/ROW]
[ROW][C]1[/C][C]0.185347[/C][C]2.4589[/C][C]0.007452[/C][/ROW]
[ROW][C]2[/C][C]-0.141008[/C][C]-1.8707[/C][C]0.031524[/C][/ROW]
[ROW][C]3[/C][C]0.041075[/C][C]0.5449[/C][C]0.29325[/C][/ROW]
[ROW][C]4[/C][C]0.233518[/C][C]3.098[/C][C]0.001134[/C][/ROW]
[ROW][C]5[/C][C]0.032012[/C][C]0.4247[/C][C]0.335793[/C][/ROW]
[ROW][C]6[/C][C]-0.286061[/C][C]-3.795[/C][C]0.000101[/C][/ROW]
[ROW][C]7[/C][C]0.042993[/C][C]0.5704[/C][C]0.284579[/C][/ROW]
[ROW][C]8[/C][C]0.20298[/C][C]2.6928[/C][C]0.003885[/C][/ROW]
[ROW][C]9[/C][C]0.01285[/C][C]0.1705[/C][C]0.432416[/C][/ROW]
[ROW][C]10[/C][C]-0.146686[/C][C]-1.946[/C][C]0.026623[/C][/ROW]
[ROW][C]11[/C][C]0.151364[/C][C]2.0081[/C][C]0.023082[/C][/ROW]
[ROW][C]12[/C][C]0.799961[/C][C]10.6127[/C][C]0[/C][/ROW]
[ROW][C]13[/C][C]0.136786[/C][C]1.8147[/C][C]0.035639[/C][/ROW]
[ROW][C]14[/C][C]-0.158822[/C][C]-2.107[/C][C]0.018267[/C][/ROW]
[ROW][C]15[/C][C]0.010127[/C][C]0.1343[/C][C]0.446641[/C][/ROW]
[ROW][C]16[/C][C]0.172966[/C][C]2.2946[/C][C]0.011467[/C][/ROW]
[ROW][C]17[/C][C]0.003905[/C][C]0.0518[/C][C]0.479369[/C][/ROW]
[ROW][C]18[/C][C]-0.295296[/C][C]-3.9175[/C][C]6.4e-05[/C][/ROW]
[ROW][C]19[/C][C]-0.000863[/C][C]-0.0114[/C][C]0.495441[/C][/ROW]
[ROW][C]20[/C][C]0.158431[/C][C]2.1018[/C][C]0.018496[/C][/ROW]
[ROW][C]21[/C][C]-0.015128[/C][C]-0.2007[/C][C]0.420585[/C][/ROW]
[ROW][C]22[/C][C]-0.150342[/C][C]-1.9945[/C][C]0.02382[/C][/ROW]
[ROW][C]23[/C][C]0.135816[/C][C]1.8018[/C][C]0.036644[/C][/ROW]
[ROW][C]24[/C][C]0.702704[/C][C]9.3224[/C][C]0[/C][/ROW]
[ROW][C]25[/C][C]0.101481[/C][C]1.3463[/C][C]0.089968[/C][/ROW]
[ROW][C]26[/C][C]-0.171725[/C][C]-2.2782[/C][C]0.011959[/C][/ROW]
[ROW][C]27[/C][C]-0.03592[/C][C]-0.4765[/C][C]0.317143[/C][/ROW]
[ROW][C]28[/C][C]0.155348[/C][C]2.0609[/C][C]0.020391[/C][/ROW]
[ROW][C]29[/C][C]-0.051143[/C][C]-0.6785[/C][C]0.249177[/C][/ROW]
[ROW][C]30[/C][C]-0.322636[/C][C]-4.2802[/C][C]1.5e-05[/C][/ROW]
[ROW][C]31[/C][C]-0.028421[/C][C]-0.377[/C][C]0.353298[/C][/ROW]
[ROW][C]32[/C][C]0.111231[/C][C]1.4757[/C][C]0.070912[/C][/ROW]
[ROW][C]33[/C][C]-0.063989[/C][C]-0.8489[/C][C]0.198541[/C][/ROW]
[ROW][C]34[/C][C]-0.212963[/C][C]-2.8253[/C][C]0.002635[/C][/ROW]
[ROW][C]35[/C][C]0.100813[/C][C]1.3374[/C][C]0.091404[/C][/ROW]
[ROW][C]36[/C][C]0.602516[/C][C]7.9933[/C][C]0[/C][/ROW]
[ROW][C]37[/C][C]0.057519[/C][C]0.7631[/C][C]0.22322[/C][/ROW]
[ROW][C]38[/C][C]-0.192574[/C][C]-2.5548[/C][C]0.005736[/C][/ROW]
[ROW][C]39[/C][C]-0.080489[/C][C]-1.0678[/C][C]0.143534[/C][/ROW]
[ROW][C]40[/C][C]0.141937[/C][C]1.883[/C][C]0.030675[/C][/ROW]
[ROW][C]41[/C][C]-0.081686[/C][C]-1.0837[/C][C]0.139992[/C][/ROW]
[ROW][C]42[/C][C]-0.339273[/C][C]-4.501[/C][C]6e-06[/C][/ROW]
[ROW][C]43[/C][C]-0.033585[/C][C]-0.4456[/C][C]0.328233[/C][/ROW]
[ROW][C]44[/C][C]0.102261[/C][C]1.3566[/C][C]0.088316[/C][/ROW]
[ROW][C]45[/C][C]-0.118328[/C][C]-1.5698[/C][C]0.05913[/C][/ROW]
[ROW][C]46[/C][C]-0.217989[/C][C]-2.8919[/C][C]0.002156[/C][/ROW]
[ROW][C]47[/C][C]0.070038[/C][C]0.9292[/C][C]0.17704[/C][/ROW]
[ROW][C]48[/C][C]0.514693[/C][C]6.8282[/C][C]0[/C][/ROW]
[/TABLE]
Source: https://freestatistics.org/blog/index.php?pk=75558&T=1

Globally Unique Identifier (entire table): ba.freestatistics.org/blog/index.php?pk=75558&T=1

As an alternative you can also use a QR Code:  

The GUIDs for individual cells are displayed in the table below:

Autocorrelation Function
Time lag kACF(k)T-STATP-value
10.1853472.45890.007452
2-0.141008-1.87070.031524
30.0410750.54490.29325
40.2335183.0980.001134
50.0320120.42470.335793
6-0.286061-3.7950.000101
70.0429930.57040.284579
80.202982.69280.003885
90.012850.17050.432416
10-0.146686-1.9460.026623
110.1513642.00810.023082
120.79996110.61270
130.1367861.81470.035639
14-0.158822-2.1070.018267
150.0101270.13430.446641
160.1729662.29460.011467
170.0039050.05180.479369
18-0.295296-3.91756.4e-05
19-0.000863-0.01140.495441
200.1584312.10180.018496
21-0.015128-0.20070.420585
22-0.150342-1.99450.02382
230.1358161.80180.036644
240.7027049.32240
250.1014811.34630.089968
26-0.171725-2.27820.011959
27-0.03592-0.47650.317143
280.1553482.06090.020391
29-0.051143-0.67850.249177
30-0.322636-4.28021.5e-05
31-0.028421-0.3770.353298
320.1112311.47570.070912
33-0.063989-0.84890.198541
34-0.212963-2.82530.002635
350.1008131.33740.091404
360.6025167.99330
370.0575190.76310.22322
38-0.192574-2.55480.005736
39-0.080489-1.06780.143534
400.1419371.8830.030675
41-0.081686-1.08370.139992
42-0.339273-4.5016e-06
43-0.033585-0.44560.328233
440.1022611.35660.088316
45-0.118328-1.56980.05913
46-0.217989-2.89190.002156
470.0700380.92920.17704
480.5146936.82820


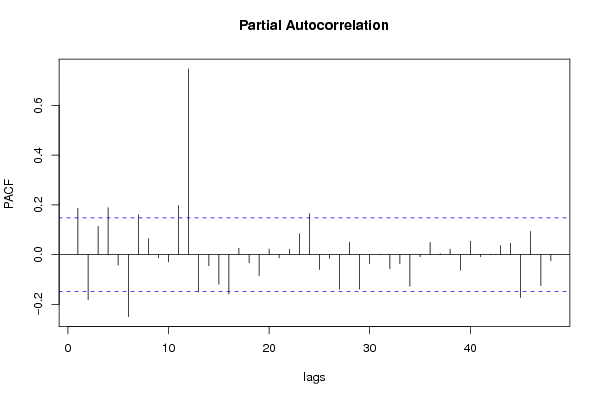
Partial Autocorrelation Function
Time lag kPACF(k)T-STATP-value
10.1853472.45890.007452
2-0.1816-2.40920.008509
30.1131031.50050.067642
40.1883332.49850.006694
5-0.042053-0.55790.288812
6-0.249792-3.31390.000559
70.1592162.11220.018038
80.064240.85220.19762
9-0.012637-0.16760.433528
10-0.029498-0.39130.34801
110.1978212.62440.004722
120.7472899.91390
13-0.150629-1.99830.023611
14-0.044401-0.5890.278294
15-0.118886-1.57720.058272
16-0.159114-2.11090.018097
170.0259210.34390.365675
18-0.03269-0.43370.332526
19-0.084525-1.12140.131832
200.0222250.29490.384227
21-0.012819-0.17010.43258
220.0212890.28240.38897
230.0843671.11930.132278
240.1644262.18140.015242
25-0.06-0.7960.213554
26-0.015418-0.20450.41908
27-0.139221-1.8470.033215
280.0499850.66310.25406
29-0.138269-1.83430.034146
30-0.036472-0.48390.314543
31-0.000617-0.00820.496742
32-0.056886-0.75470.225726
33-0.03655-0.48490.31418
34-0.127669-1.69370.046043
35-0.008704-0.11550.454101
360.0488140.64760.259046
370.003320.0440.482459
380.0221350.29370.384682
39-0.063092-0.8370.201861
400.0540860.71750.236999
41-0.00844-0.1120.455489
420.0012660.01680.493312
430.0363150.48180.315282
440.0458860.60870.271738
45-0.173025-2.29540.011444
460.0928771.23220.109768
47-0.124486-1.65150.050211
48-0.024733-0.32810.371607

\begin{tabular}{lllllllll}
\hline
Partial Autocorrelation Function \tabularnewline
Time lag k & PACF(k) & T-STAT & P-value \tabularnewline
1 & 0.185347 & 2.4589 & 0.007452 \tabularnewline
2 & -0.1816 & -2.4092 & 0.008509 \tabularnewline
3 & 0.113103 & 1.5005 & 0.067642 \tabularnewline
4 & 0.188333 & 2.4985 & 0.006694 \tabularnewline
5 & -0.042053 & -0.5579 & 0.288812 \tabularnewline
6 & -0.249792 & -3.3139 & 0.000559 \tabularnewline
7 & 0.159216 & 2.1122 & 0.018038 \tabularnewline
8 & 0.06424 & 0.8522 & 0.19762 \tabularnewline
9 & -0.012637 & -0.1676 & 0.433528 \tabularnewline
10 & -0.029498 & -0.3913 & 0.34801 \tabularnewline
11 & 0.197821 & 2.6244 & 0.004722 \tabularnewline
12 & 0.747289 & 9.9139 & 0 \tabularnewline
13 & -0.150629 & -1.9983 & 0.023611 \tabularnewline
14 & -0.044401 & -0.589 & 0.278294 \tabularnewline
15 & -0.118886 & -1.5772 & 0.058272 \tabularnewline
16 & -0.159114 & -2.1109 & 0.018097 \tabularnewline
17 & 0.025921 & 0.3439 & 0.365675 \tabularnewline
18 & -0.03269 & -0.4337 & 0.332526 \tabularnewline
19 & -0.084525 & -1.1214 & 0.131832 \tabularnewline
20 & 0.022225 & 0.2949 & 0.384227 \tabularnewline
21 & -0.012819 & -0.1701 & 0.43258 \tabularnewline
22 & 0.021289 & 0.2824 & 0.38897 \tabularnewline
23 & 0.084367 & 1.1193 & 0.132278 \tabularnewline
24 & 0.164426 & 2.1814 & 0.015242 \tabularnewline
25 & -0.06 & -0.796 & 0.213554 \tabularnewline
26 & -0.015418 & -0.2045 & 0.41908 \tabularnewline
27 & -0.139221 & -1.847 & 0.033215 \tabularnewline
28 & 0.049985 & 0.6631 & 0.25406 \tabularnewline
29 & -0.138269 & -1.8343 & 0.034146 \tabularnewline
30 & -0.036472 & -0.4839 & 0.314543 \tabularnewline
31 & -0.000617 & -0.0082 & 0.496742 \tabularnewline
32 & -0.056886 & -0.7547 & 0.225726 \tabularnewline
33 & -0.03655 & -0.4849 & 0.31418 \tabularnewline
34 & -0.127669 & -1.6937 & 0.046043 \tabularnewline
35 & -0.008704 & -0.1155 & 0.454101 \tabularnewline
36 & 0.048814 & 0.6476 & 0.259046 \tabularnewline
37 & 0.00332 & 0.044 & 0.482459 \tabularnewline
38 & 0.022135 & 0.2937 & 0.384682 \tabularnewline
39 & -0.063092 & -0.837 & 0.201861 \tabularnewline
40 & 0.054086 & 0.7175 & 0.236999 \tabularnewline
41 & -0.00844 & -0.112 & 0.455489 \tabularnewline
42 & 0.001266 & 0.0168 & 0.493312 \tabularnewline
43 & 0.036315 & 0.4818 & 0.315282 \tabularnewline
44 & 0.045886 & 0.6087 & 0.271738 \tabularnewline
45 & -0.173025 & -2.2954 & 0.011444 \tabularnewline
46 & 0.092877 & 1.2322 & 0.109768 \tabularnewline
47 & -0.124486 & -1.6515 & 0.050211 \tabularnewline
48 & -0.024733 & -0.3281 & 0.371607 \tabularnewline
\hline
\end{tabular}
%Source: https://freestatistics.org/blog/index.php?pk=75558&T=2

[TABLE]
[ROW][C]Partial Autocorrelation Function[/C][/ROW]
[ROW][C]Time lag k[/C][C]PACF(k)[/C][C]T-STAT[/C][C]P-value[/C][/ROW]
[ROW][C]1[/C][C]0.185347[/C][C]2.4589[/C][C]0.007452[/C][/ROW]
[ROW][C]2[/C][C]-0.1816[/C][C]-2.4092[/C][C]0.008509[/C][/ROW]
[ROW][C]3[/C][C]0.113103[/C][C]1.5005[/C][C]0.067642[/C][/ROW]
[ROW][C]4[/C][C]0.188333[/C][C]2.4985[/C][C]0.006694[/C][/ROW]
[ROW][C]5[/C][C]-0.042053[/C][C]-0.5579[/C][C]0.288812[/C][/ROW]
[ROW][C]6[/C][C]-0.249792[/C][C]-3.3139[/C][C]0.000559[/C][/ROW]
[ROW][C]7[/C][C]0.159216[/C][C]2.1122[/C][C]0.018038[/C][/ROW]
[ROW][C]8[/C][C]0.06424[/C][C]0.8522[/C][C]0.19762[/C][/ROW]
[ROW][C]9[/C][C]-0.012637[/C][C]-0.1676[/C][C]0.433528[/C][/ROW]
[ROW][C]10[/C][C]-0.029498[/C][C]-0.3913[/C][C]0.34801[/C][/ROW]
[ROW][C]11[/C][C]0.197821[/C][C]2.6244[/C][C]0.004722[/C][/ROW]
[ROW][C]12[/C][C]0.747289[/C][C]9.9139[/C][C]0[/C][/ROW]
[ROW][C]13[/C][C]-0.150629[/C][C]-1.9983[/C][C]0.023611[/C][/ROW]
[ROW][C]14[/C][C]-0.044401[/C][C]-0.589[/C][C]0.278294[/C][/ROW]
[ROW][C]15[/C][C]-0.118886[/C][C]-1.5772[/C][C]0.058272[/C][/ROW]
[ROW][C]16[/C][C]-0.159114[/C][C]-2.1109[/C][C]0.018097[/C][/ROW]
[ROW][C]17[/C][C]0.025921[/C][C]0.3439[/C][C]0.365675[/C][/ROW]
[ROW][C]18[/C][C]-0.03269[/C][C]-0.4337[/C][C]0.332526[/C][/ROW]
[ROW][C]19[/C][C]-0.084525[/C][C]-1.1214[/C][C]0.131832[/C][/ROW]
[ROW][C]20[/C][C]0.022225[/C][C]0.2949[/C][C]0.384227[/C][/ROW]
[ROW][C]21[/C][C]-0.012819[/C][C]-0.1701[/C][C]0.43258[/C][/ROW]
[ROW][C]22[/C][C]0.021289[/C][C]0.2824[/C][C]0.38897[/C][/ROW]
[ROW][C]23[/C][C]0.084367[/C][C]1.1193[/C][C]0.132278[/C][/ROW]
[ROW][C]24[/C][C]0.164426[/C][C]2.1814[/C][C]0.015242[/C][/ROW]
[ROW][C]25[/C][C]-0.06[/C][C]-0.796[/C][C]0.213554[/C][/ROW]
[ROW][C]26[/C][C]-0.015418[/C][C]-0.2045[/C][C]0.41908[/C][/ROW]
[ROW][C]27[/C][C]-0.139221[/C][C]-1.847[/C][C]0.033215[/C][/ROW]
[ROW][C]28[/C][C]0.049985[/C][C]0.6631[/C][C]0.25406[/C][/ROW]
[ROW][C]29[/C][C]-0.138269[/C][C]-1.8343[/C][C]0.034146[/C][/ROW]
[ROW][C]30[/C][C]-0.036472[/C][C]-0.4839[/C][C]0.314543[/C][/ROW]
[ROW][C]31[/C][C]-0.000617[/C][C]-0.0082[/C][C]0.496742[/C][/ROW]
[ROW][C]32[/C][C]-0.056886[/C][C]-0.7547[/C][C]0.225726[/C][/ROW]
[ROW][C]33[/C][C]-0.03655[/C][C]-0.4849[/C][C]0.31418[/C][/ROW]
[ROW][C]34[/C][C]-0.127669[/C][C]-1.6937[/C][C]0.046043[/C][/ROW]
[ROW][C]35[/C][C]-0.008704[/C][C]-0.1155[/C][C]0.454101[/C][/ROW]
[ROW][C]36[/C][C]0.048814[/C][C]0.6476[/C][C]0.259046[/C][/ROW]
[ROW][C]37[/C][C]0.00332[/C][C]0.044[/C][C]0.482459[/C][/ROW]
[ROW][C]38[/C][C]0.022135[/C][C]0.2937[/C][C]0.384682[/C][/ROW]
[ROW][C]39[/C][C]-0.063092[/C][C]-0.837[/C][C]0.201861[/C][/ROW]
[ROW][C]40[/C][C]0.054086[/C][C]0.7175[/C][C]0.236999[/C][/ROW]
[ROW][C]41[/C][C]-0.00844[/C][C]-0.112[/C][C]0.455489[/C][/ROW]
[ROW][C]42[/C][C]0.001266[/C][C]0.0168[/C][C]0.493312[/C][/ROW]
[ROW][C]43[/C][C]0.036315[/C][C]0.4818[/C][C]0.315282[/C][/ROW]
[ROW][C]44[/C][C]0.045886[/C][C]0.6087[/C][C]0.271738[/C][/ROW]
[ROW][C]45[/C][C]-0.173025[/C][C]-2.2954[/C][C]0.011444[/C][/ROW]
[ROW][C]46[/C][C]0.092877[/C][C]1.2322[/C][C]0.109768[/C][/ROW]
[ROW][C]47[/C][C]-0.124486[/C][C]-1.6515[/C][C]0.050211[/C][/ROW]
[ROW][C]48[/C][C]-0.024733[/C][C]-0.3281[/C][C]0.371607[/C][/ROW]
[/TABLE]
Source: https://freestatistics.org/blog/index.php?pk=75558&T=2

Globally Unique Identifier (entire table): ba.freestatistics.org/blog/index.php?pk=75558&T=2

As an alternative you can also use a QR Code:  

The GUIDs for individual cells are displayed in the table below:

Partial Autocorrelation Function
Time lag kPACF(k)T-STATP-value
10.1853472.45890.007452
2-0.1816-2.40920.008509
30.1131031.50050.067642
40.1883332.49850.006694
5-0.042053-0.55790.288812
6-0.249792-3.31390.000559
70.1592162.11220.018038
80.064240.85220.19762
9-0.012637-0.16760.433528
10-0.029498-0.39130.34801
110.1978212.62440.004722
120.7472899.91390
13-0.150629-1.99830.023611
14-0.044401-0.5890.278294
15-0.118886-1.57720.058272
16-0.159114-2.11090.018097
170.0259210.34390.365675
18-0.03269-0.43370.332526
19-0.084525-1.12140.131832
200.0222250.29490.384227
21-0.012819-0.17010.43258
220.0212890.28240.38897
230.0843671.11930.132278
240.1644262.18140.015242
25-0.06-0.7960.213554
26-0.015418-0.20450.41908
27-0.139221-1.8470.033215
280.0499850.66310.25406
29-0.138269-1.83430.034146
30-0.036472-0.48390.314543
31-0.000617-0.00820.496742
32-0.056886-0.75470.225726
33-0.03655-0.48490.31418
34-0.127669-1.69370.046043
35-0.008704-0.11550.454101
360.0488140.64760.259046
370.003320.0440.482459
380.0221350.29370.384682
39-0.063092-0.8370.201861
400.0540860.71750.236999
41-0.00844-0.1120.455489
420.0012660.01680.493312
430.0363150.48180.315282
440.0458860.60870.271738
45-0.173025-2.29540.011444
460.0928771.23220.109768
47-0.124486-1.65150.050211
48-0.024733-0.32810.371607


Parameters (Session):
par1 = 48 ; par2 = 1 ; par3 = 0 ; par4 = 0 ; par5 = 12 ; par6 = White Noise ; par7 = 0.95 ;
Parameters (R input):
par1 = 48 ; par2 = 1 ; par3 = 0 ; par4 = 0 ; par5 = 12 ; par6 = White Noise ; par7 = 0.95 ;
R code (references can be found in the software module):
if (par1 == 'Default') {
par1 = 10*log10(length(x))
} else {
par1 <- as.numeric(par1)
}
par2 <- as.numeric(par2)
par3 <- as.numeric(par3)
par4 <- as.numeric(par4)
par5 <- as.numeric(par5)
if (par6 == 'White Noise') par6 <- 'white' else par6 <- 'ma'
par7 <- as.numeric(par7)
if (par2 == 0) {
x <- log(x)
} else {
x <- (x ^ par2 - 1) / par2
}
if (par3 > 0) x <- diff(x,lag=1,difference=par3)
if (par4 > 0) x <- diff(x,lag=par5,difference=par4)
bitmap(file='pic1.png')
racf <- acf(x, par1, main='Autocorrelation', xlab='time lag', ylab='ACF', ci.type=par6, ci=par7, sub=paste('(lambda=',par2,', d=',par3,', D=',par4,', CI=', par7, ', CI type=',par6,')',sep=''))
dev.off()
bitmap(file='pic2.png')
rpacf <- pacf(x,par1,main='Partial Autocorrelation',xlab='lags',ylab='PACF')
dev.off()
(myacf <- c(racf$acf))
(mypacf <- c(rpacf$acf))
lengthx <- length(x)
sqrtn <- sqrt(lengthx)
load(file='createtable')
a<-table.start()
a<-table.row.start(a)
a<-table.element(a,'Autocorrelation Function',4,TRUE)
a<-table.row.end(a)
a<-table.row.start(a)
a<-table.element(a,'Time lag k',header=TRUE)
a<-table.element(a,hyperlink('basics.htm','ACF(k)','click here for more information about the Autocorrelation Function'),header=TRUE)
a<-table.element(a,'T-STAT',header=TRUE)
a<-table.element(a,'P-value',header=TRUE)
a<-table.row.end(a)
for (i in 2:(par1+1)) {
a<-table.row.start(a)
a<-table.element(a,i-1,header=TRUE)
a<-table.element(a,round(myacf[i],6))
mytstat <- myacf[i]*sqrtn
a<-table.element(a,round(mytstat,4))
a<-table.element(a,round(1-pt(abs(mytstat),lengthx),6))
a<-table.row.end(a)
}
a<-table.end(a)
table.save(a,file='mytable.tab')
a<-table.start()
a<-table.row.start(a)
a<-table.element(a,'Partial Autocorrelation Function',4,TRUE)
a<-table.row.end(a)
a<-table.row.start(a)
a<-table.element(a,'Time lag k',header=TRUE)
a<-table.element(a,hyperlink('basics.htm','PACF(k)','click here for more information about the Partial Autocorrelation Function'),header=TRUE)
a<-table.element(a,'T-STAT',header=TRUE)
a<-table.element(a,'P-value',header=TRUE)
a<-table.row.end(a)
for (i in 1:par1) {
a<-table.row.start(a)
a<-table.element(a,i,header=TRUE)
a<-table.element(a,round(mypacf[i],6))
mytstat <- mypacf[i]*sqrtn
a<-table.element(a,round(mytstat,4))
a<-table.element(a,round(1-pt(abs(mytstat),lengthx),6))
a<-table.row.end(a)
}
a<-table.end(a)
table.save(a,file='mytable1.tab')