Free Statistics

of Irreproducible Research!

Author's title

Author*Unverified author*
R Software Modulerwasp_autocorrelation.wasp
Title produced by software(Partial) Autocorrelation Function
Date of computationWed, 05 May 2010 18:45:35 +0000
Cite this page as followsStatistical Computations at FreeStatistics.org, Office for Research Development and Education, URL https://freestatistics.org/blog/index.php?v=date/2010/May/05/t1273085221nacrvmy15m0chas.htm/, Retrieved Sun, 28 Apr 2024 05:54:23 +0000
Statistical Computations at FreeStatistics.org, Office for Research Development and Education, URL https://freestatistics.org/blog/index.php?pk=75566, Retrieved Sun, 28 Apr 2024 05:54:23 +0000
QR Codes:

Original text written by user:
IsPrivate?No (this computation is public)
User-defined keywordsKDGP2W21
Estimated Impact153
Family? (F = Feedback message, R = changed R code, M = changed R Module, P = changed Parameters, D = changed Data)
-       [(Partial) Autocorrelation Function] [] [2010-05-05 18:45:35] [850dbf9e683f79d78a1e8310559edb6e] [Current]
Feedback Forum

Post a new message
Dataseries X:
306
303
344
254
309
310
379
294
356
318
405
545
268
243
273
273
236
222
302
285
309
322
362
471
198
253
173
186
185
105
228
214
189
270
277
378
185
182
258
179
197
168
250
211
260
234
305
347
203
217
227
242
185
175
252
319
202
254
336
431
150
280
187
279
193
227
225
205
259
254
275
394
159
230
188
195
189
220
274


Summary of computational transaction
Raw Inputview raw input (R code)
Raw Outputview raw output of R engine
Computing time1 seconds
R Server'Sir Ronald Aylmer Fisher' @ 193.190.124.24

\begin{tabular}{lllllllll}
\hline
Summary of computational transaction \tabularnewline
Raw Input & view raw input (R code)  \tabularnewline
Raw Output & view raw output of R engine  \tabularnewline
Computing time & 1 seconds \tabularnewline
R Server & 'Sir Ronald Aylmer Fisher' @ 193.190.124.24 \tabularnewline
\hline
\end{tabular}
%Source: https://freestatistics.org/blog/index.php?pk=75566&T=0

[TABLE]
[ROW][C]Summary of computational transaction[/C][/ROW]
[ROW][C]Raw Input[/C][C]view raw input (R code) [/C][/ROW]
[ROW][C]Raw Output[/C][C]view raw output of R engine [/C][/ROW]
[ROW][C]Computing time[/C][C]1 seconds[/C][/ROW]
[ROW][C]R Server[/C][C]'Sir Ronald Aylmer Fisher' @ 193.190.124.24[/C][/ROW]
[/TABLE]
Source: https://freestatistics.org/blog/index.php?pk=75566&T=0

Globally Unique Identifier (entire table): ba.freestatistics.org/blog/index.php?pk=75566&T=0

As an alternative you can also use a QR Code:  

The GUIDs for individual cells are displayed in the table below:

Summary of computational transaction
Raw Inputview raw input (R code)
Raw Outputview raw output of R engine
Computing time1 seconds
R Server'Sir Ronald Aylmer Fisher' @ 193.190.124.24


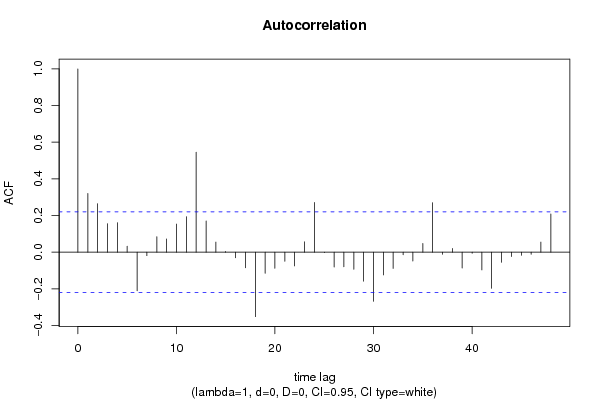
Autocorrelation Function
Time lag kACF(k)T-STATP-value
10.3206582.85010.002786
20.2642742.34890.010664
30.1549821.37750.086122
40.1602771.42460.07911
50.0319780.28420.38849
6-0.210939-1.87490.032253
7-0.01898-0.16870.433232
80.0847290.75310.226817
90.0725120.64450.26056
100.1532871.36240.088465
110.1930331.71570.045067
120.5455214.84873e-06
130.1702721.51340.067083
140.054810.48720.313747
150.0036310.03230.487166
16-0.03085-0.27420.392322
17-0.085197-0.75720.225578
18-0.351997-3.12860.00123
19-0.114843-1.02070.155245
20-0.088172-0.78370.217782
21-0.049259-0.43780.331356
22-0.074905-0.66580.25375
230.0561990.49950.309404
240.2711632.41010.009135
25-0.001767-0.01570.493754
26-0.081647-0.72570.235085
27-0.080119-0.71210.239246
28-0.093518-0.83120.204182
29-0.158263-1.40670.081723
30-0.267811-2.38040.009853
31-0.124191-1.10380.136507
32-0.08863-0.78780.216597
33-0.014446-0.12840.449079
34-0.048372-0.42990.334205
350.0470250.4180.338551
360.2697642.39770.009429
37-0.011309-0.10050.460095
380.0206190.18330.427528
39-0.086417-0.76810.222361
40-0.006551-0.05820.476857
41-0.096875-0.8610.195909
42-0.197221-1.75290.041746
43-0.054769-0.48680.313876
44-0.023773-0.21130.416599
45-0.016541-0.1470.441745
46-0.011712-0.10410.458677
470.0548080.48710.313752
480.2085631.85370.033754

\begin{tabular}{lllllllll}
\hline
Autocorrelation Function \tabularnewline
Time lag k & ACF(k) & T-STAT & P-value \tabularnewline
1 & 0.320658 & 2.8501 & 0.002786 \tabularnewline
2 & 0.264274 & 2.3489 & 0.010664 \tabularnewline
3 & 0.154982 & 1.3775 & 0.086122 \tabularnewline
4 & 0.160277 & 1.4246 & 0.07911 \tabularnewline
5 & 0.031978 & 0.2842 & 0.38849 \tabularnewline
6 & -0.210939 & -1.8749 & 0.032253 \tabularnewline
7 & -0.01898 & -0.1687 & 0.433232 \tabularnewline
8 & 0.084729 & 0.7531 & 0.226817 \tabularnewline
9 & 0.072512 & 0.6445 & 0.26056 \tabularnewline
10 & 0.153287 & 1.3624 & 0.088465 \tabularnewline
11 & 0.193033 & 1.7157 & 0.045067 \tabularnewline
12 & 0.545521 & 4.8487 & 3e-06 \tabularnewline
13 & 0.170272 & 1.5134 & 0.067083 \tabularnewline
14 & 0.05481 & 0.4872 & 0.313747 \tabularnewline
15 & 0.003631 & 0.0323 & 0.487166 \tabularnewline
16 & -0.03085 & -0.2742 & 0.392322 \tabularnewline
17 & -0.085197 & -0.7572 & 0.225578 \tabularnewline
18 & -0.351997 & -3.1286 & 0.00123 \tabularnewline
19 & -0.114843 & -1.0207 & 0.155245 \tabularnewline
20 & -0.088172 & -0.7837 & 0.217782 \tabularnewline
21 & -0.049259 & -0.4378 & 0.331356 \tabularnewline
22 & -0.074905 & -0.6658 & 0.25375 \tabularnewline
23 & 0.056199 & 0.4995 & 0.309404 \tabularnewline
24 & 0.271163 & 2.4101 & 0.009135 \tabularnewline
25 & -0.001767 & -0.0157 & 0.493754 \tabularnewline
26 & -0.081647 & -0.7257 & 0.235085 \tabularnewline
27 & -0.080119 & -0.7121 & 0.239246 \tabularnewline
28 & -0.093518 & -0.8312 & 0.204182 \tabularnewline
29 & -0.158263 & -1.4067 & 0.081723 \tabularnewline
30 & -0.267811 & -2.3804 & 0.009853 \tabularnewline
31 & -0.124191 & -1.1038 & 0.136507 \tabularnewline
32 & -0.08863 & -0.7878 & 0.216597 \tabularnewline
33 & -0.014446 & -0.1284 & 0.449079 \tabularnewline
34 & -0.048372 & -0.4299 & 0.334205 \tabularnewline
35 & 0.047025 & 0.418 & 0.338551 \tabularnewline
36 & 0.269764 & 2.3977 & 0.009429 \tabularnewline
37 & -0.011309 & -0.1005 & 0.460095 \tabularnewline
38 & 0.020619 & 0.1833 & 0.427528 \tabularnewline
39 & -0.086417 & -0.7681 & 0.222361 \tabularnewline
40 & -0.006551 & -0.0582 & 0.476857 \tabularnewline
41 & -0.096875 & -0.861 & 0.195909 \tabularnewline
42 & -0.197221 & -1.7529 & 0.041746 \tabularnewline
43 & -0.054769 & -0.4868 & 0.313876 \tabularnewline
44 & -0.023773 & -0.2113 & 0.416599 \tabularnewline
45 & -0.016541 & -0.147 & 0.441745 \tabularnewline
46 & -0.011712 & -0.1041 & 0.458677 \tabularnewline
47 & 0.054808 & 0.4871 & 0.313752 \tabularnewline
48 & 0.208563 & 1.8537 & 0.033754 \tabularnewline
\hline
\end{tabular}
%Source: https://freestatistics.org/blog/index.php?pk=75566&T=1

[TABLE]
[ROW][C]Autocorrelation Function[/C][/ROW]
[ROW][C]Time lag k[/C][C]ACF(k)[/C][C]T-STAT[/C][C]P-value[/C][/ROW]
[ROW][C]1[/C][C]0.320658[/C][C]2.8501[/C][C]0.002786[/C][/ROW]
[ROW][C]2[/C][C]0.264274[/C][C]2.3489[/C][C]0.010664[/C][/ROW]
[ROW][C]3[/C][C]0.154982[/C][C]1.3775[/C][C]0.086122[/C][/ROW]
[ROW][C]4[/C][C]0.160277[/C][C]1.4246[/C][C]0.07911[/C][/ROW]
[ROW][C]5[/C][C]0.031978[/C][C]0.2842[/C][C]0.38849[/C][/ROW]
[ROW][C]6[/C][C]-0.210939[/C][C]-1.8749[/C][C]0.032253[/C][/ROW]
[ROW][C]7[/C][C]-0.01898[/C][C]-0.1687[/C][C]0.433232[/C][/ROW]
[ROW][C]8[/C][C]0.084729[/C][C]0.7531[/C][C]0.226817[/C][/ROW]
[ROW][C]9[/C][C]0.072512[/C][C]0.6445[/C][C]0.26056[/C][/ROW]
[ROW][C]10[/C][C]0.153287[/C][C]1.3624[/C][C]0.088465[/C][/ROW]
[ROW][C]11[/C][C]0.193033[/C][C]1.7157[/C][C]0.045067[/C][/ROW]
[ROW][C]12[/C][C]0.545521[/C][C]4.8487[/C][C]3e-06[/C][/ROW]
[ROW][C]13[/C][C]0.170272[/C][C]1.5134[/C][C]0.067083[/C][/ROW]
[ROW][C]14[/C][C]0.05481[/C][C]0.4872[/C][C]0.313747[/C][/ROW]
[ROW][C]15[/C][C]0.003631[/C][C]0.0323[/C][C]0.487166[/C][/ROW]
[ROW][C]16[/C][C]-0.03085[/C][C]-0.2742[/C][C]0.392322[/C][/ROW]
[ROW][C]17[/C][C]-0.085197[/C][C]-0.7572[/C][C]0.225578[/C][/ROW]
[ROW][C]18[/C][C]-0.351997[/C][C]-3.1286[/C][C]0.00123[/C][/ROW]
[ROW][C]19[/C][C]-0.114843[/C][C]-1.0207[/C][C]0.155245[/C][/ROW]
[ROW][C]20[/C][C]-0.088172[/C][C]-0.7837[/C][C]0.217782[/C][/ROW]
[ROW][C]21[/C][C]-0.049259[/C][C]-0.4378[/C][C]0.331356[/C][/ROW]
[ROW][C]22[/C][C]-0.074905[/C][C]-0.6658[/C][C]0.25375[/C][/ROW]
[ROW][C]23[/C][C]0.056199[/C][C]0.4995[/C][C]0.309404[/C][/ROW]
[ROW][C]24[/C][C]0.271163[/C][C]2.4101[/C][C]0.009135[/C][/ROW]
[ROW][C]25[/C][C]-0.001767[/C][C]-0.0157[/C][C]0.493754[/C][/ROW]
[ROW][C]26[/C][C]-0.081647[/C][C]-0.7257[/C][C]0.235085[/C][/ROW]
[ROW][C]27[/C][C]-0.080119[/C][C]-0.7121[/C][C]0.239246[/C][/ROW]
[ROW][C]28[/C][C]-0.093518[/C][C]-0.8312[/C][C]0.204182[/C][/ROW]
[ROW][C]29[/C][C]-0.158263[/C][C]-1.4067[/C][C]0.081723[/C][/ROW]
[ROW][C]30[/C][C]-0.267811[/C][C]-2.3804[/C][C]0.009853[/C][/ROW]
[ROW][C]31[/C][C]-0.124191[/C][C]-1.1038[/C][C]0.136507[/C][/ROW]
[ROW][C]32[/C][C]-0.08863[/C][C]-0.7878[/C][C]0.216597[/C][/ROW]
[ROW][C]33[/C][C]-0.014446[/C][C]-0.1284[/C][C]0.449079[/C][/ROW]
[ROW][C]34[/C][C]-0.048372[/C][C]-0.4299[/C][C]0.334205[/C][/ROW]
[ROW][C]35[/C][C]0.047025[/C][C]0.418[/C][C]0.338551[/C][/ROW]
[ROW][C]36[/C][C]0.269764[/C][C]2.3977[/C][C]0.009429[/C][/ROW]
[ROW][C]37[/C][C]-0.011309[/C][C]-0.1005[/C][C]0.460095[/C][/ROW]
[ROW][C]38[/C][C]0.020619[/C][C]0.1833[/C][C]0.427528[/C][/ROW]
[ROW][C]39[/C][C]-0.086417[/C][C]-0.7681[/C][C]0.222361[/C][/ROW]
[ROW][C]40[/C][C]-0.006551[/C][C]-0.0582[/C][C]0.476857[/C][/ROW]
[ROW][C]41[/C][C]-0.096875[/C][C]-0.861[/C][C]0.195909[/C][/ROW]
[ROW][C]42[/C][C]-0.197221[/C][C]-1.7529[/C][C]0.041746[/C][/ROW]
[ROW][C]43[/C][C]-0.054769[/C][C]-0.4868[/C][C]0.313876[/C][/ROW]
[ROW][C]44[/C][C]-0.023773[/C][C]-0.2113[/C][C]0.416599[/C][/ROW]
[ROW][C]45[/C][C]-0.016541[/C][C]-0.147[/C][C]0.441745[/C][/ROW]
[ROW][C]46[/C][C]-0.011712[/C][C]-0.1041[/C][C]0.458677[/C][/ROW]
[ROW][C]47[/C][C]0.054808[/C][C]0.4871[/C][C]0.313752[/C][/ROW]
[ROW][C]48[/C][C]0.208563[/C][C]1.8537[/C][C]0.033754[/C][/ROW]
[/TABLE]
Source: https://freestatistics.org/blog/index.php?pk=75566&T=1

Globally Unique Identifier (entire table): ba.freestatistics.org/blog/index.php?pk=75566&T=1

As an alternative you can also use a QR Code:  

The GUIDs for individual cells are displayed in the table below:

Autocorrelation Function
Time lag kACF(k)T-STATP-value
10.3206582.85010.002786
20.2642742.34890.010664
30.1549821.37750.086122
40.1602771.42460.07911
50.0319780.28420.38849
6-0.210939-1.87490.032253
7-0.01898-0.16870.433232
80.0847290.75310.226817
90.0725120.64450.26056
100.1532871.36240.088465
110.1930331.71570.045067
120.5455214.84873e-06
130.1702721.51340.067083
140.054810.48720.313747
150.0036310.03230.487166
16-0.03085-0.27420.392322
17-0.085197-0.75720.225578
18-0.351997-3.12860.00123
19-0.114843-1.02070.155245
20-0.088172-0.78370.217782
21-0.049259-0.43780.331356
22-0.074905-0.66580.25375
230.0561990.49950.309404
240.2711632.41010.009135
25-0.001767-0.01570.493754
26-0.081647-0.72570.235085
27-0.080119-0.71210.239246
28-0.093518-0.83120.204182
29-0.158263-1.40670.081723
30-0.267811-2.38040.009853
31-0.124191-1.10380.136507
32-0.08863-0.78780.216597
33-0.014446-0.12840.449079
34-0.048372-0.42990.334205
350.0470250.4180.338551
360.2697642.39770.009429
37-0.011309-0.10050.460095
380.0206190.18330.427528
39-0.086417-0.76810.222361
40-0.006551-0.05820.476857
41-0.096875-0.8610.195909
42-0.197221-1.75290.041746
43-0.054769-0.48680.313876
44-0.023773-0.21130.416599
45-0.016541-0.1470.441745
46-0.011712-0.10410.458677
470.0548080.48710.313752
480.2085631.85370.033754


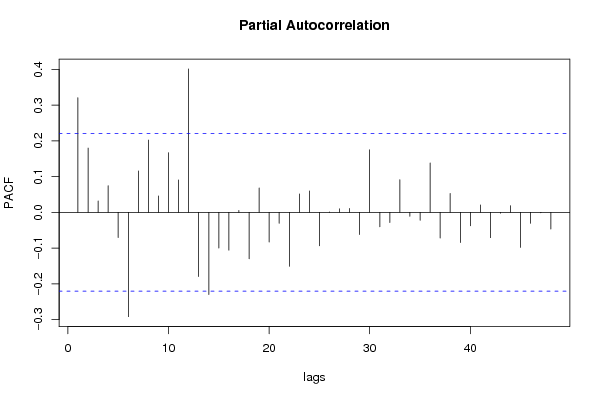
Partial Autocorrelation Function
Time lag kPACF(k)T-STATP-value
10.3206582.85010.002786
20.1799561.59950.056853
30.0320070.28450.388392
40.0747430.66430.254207
5-0.070507-0.62670.266337
6-0.291861-2.59410.00565
70.1161491.03240.152528
80.2023511.79850.037956
90.0457250.40640.34277
100.1671841.4860.070634
110.0905110.80450.211768
120.4014383.56810.000307
13-0.179324-1.59390.05748
14-0.229984-2.04410.022136
15-0.099891-0.88790.188657
16-0.10571-0.93960.175151
170.0053540.04760.481084
18-0.130069-1.15610.125566
190.06810.60530.273361
20-0.083201-0.73950.230896
21-0.030518-0.27120.393453
22-0.150924-1.34140.09181
230.0514350.45720.324403
240.0599960.53330.297678
25-0.093393-0.83010.204494
260.0012180.01080.495694
270.0099490.08840.46488
280.0109980.09770.46119
29-0.062108-0.5520.291244
300.1750841.55620.061831
31-0.040448-0.35950.360088
32-0.028591-0.25410.400029
330.0914540.81290.209371
34-0.010995-0.09770.461198
35-0.022055-0.1960.422546
360.1383031.22930.111311
37-0.07161-0.63650.26315
380.053140.47230.319002
39-0.084159-0.7480.228335
40-0.037784-0.33580.368945
410.0209870.18650.426252
42-0.070687-0.62830.265816
43-0.002124-0.01890.492493
440.0187330.16650.434094
45-0.098023-0.87120.19313
46-0.030568-0.27170.393284
47-0.001243-0.0110.495606
48-0.046537-0.41360.340133

\begin{tabular}{lllllllll}
\hline
Partial Autocorrelation Function \tabularnewline
Time lag k & PACF(k) & T-STAT & P-value \tabularnewline
1 & 0.320658 & 2.8501 & 0.002786 \tabularnewline
2 & 0.179956 & 1.5995 & 0.056853 \tabularnewline
3 & 0.032007 & 0.2845 & 0.388392 \tabularnewline
4 & 0.074743 & 0.6643 & 0.254207 \tabularnewline
5 & -0.070507 & -0.6267 & 0.266337 \tabularnewline
6 & -0.291861 & -2.5941 & 0.00565 \tabularnewline
7 & 0.116149 & 1.0324 & 0.152528 \tabularnewline
8 & 0.202351 & 1.7985 & 0.037956 \tabularnewline
9 & 0.045725 & 0.4064 & 0.34277 \tabularnewline
10 & 0.167184 & 1.486 & 0.070634 \tabularnewline
11 & 0.090511 & 0.8045 & 0.211768 \tabularnewline
12 & 0.401438 & 3.5681 & 0.000307 \tabularnewline
13 & -0.179324 & -1.5939 & 0.05748 \tabularnewline
14 & -0.229984 & -2.0441 & 0.022136 \tabularnewline
15 & -0.099891 & -0.8879 & 0.188657 \tabularnewline
16 & -0.10571 & -0.9396 & 0.175151 \tabularnewline
17 & 0.005354 & 0.0476 & 0.481084 \tabularnewline
18 & -0.130069 & -1.1561 & 0.125566 \tabularnewline
19 & 0.0681 & 0.6053 & 0.273361 \tabularnewline
20 & -0.083201 & -0.7395 & 0.230896 \tabularnewline
21 & -0.030518 & -0.2712 & 0.393453 \tabularnewline
22 & -0.150924 & -1.3414 & 0.09181 \tabularnewline
23 & 0.051435 & 0.4572 & 0.324403 \tabularnewline
24 & 0.059996 & 0.5333 & 0.297678 \tabularnewline
25 & -0.093393 & -0.8301 & 0.204494 \tabularnewline
26 & 0.001218 & 0.0108 & 0.495694 \tabularnewline
27 & 0.009949 & 0.0884 & 0.46488 \tabularnewline
28 & 0.010998 & 0.0977 & 0.46119 \tabularnewline
29 & -0.062108 & -0.552 & 0.291244 \tabularnewline
30 & 0.175084 & 1.5562 & 0.061831 \tabularnewline
31 & -0.040448 & -0.3595 & 0.360088 \tabularnewline
32 & -0.028591 & -0.2541 & 0.400029 \tabularnewline
33 & 0.091454 & 0.8129 & 0.209371 \tabularnewline
34 & -0.010995 & -0.0977 & 0.461198 \tabularnewline
35 & -0.022055 & -0.196 & 0.422546 \tabularnewline
36 & 0.138303 & 1.2293 & 0.111311 \tabularnewline
37 & -0.07161 & -0.6365 & 0.26315 \tabularnewline
38 & 0.05314 & 0.4723 & 0.319002 \tabularnewline
39 & -0.084159 & -0.748 & 0.228335 \tabularnewline
40 & -0.037784 & -0.3358 & 0.368945 \tabularnewline
41 & 0.020987 & 0.1865 & 0.426252 \tabularnewline
42 & -0.070687 & -0.6283 & 0.265816 \tabularnewline
43 & -0.002124 & -0.0189 & 0.492493 \tabularnewline
44 & 0.018733 & 0.1665 & 0.434094 \tabularnewline
45 & -0.098023 & -0.8712 & 0.19313 \tabularnewline
46 & -0.030568 & -0.2717 & 0.393284 \tabularnewline
47 & -0.001243 & -0.011 & 0.495606 \tabularnewline
48 & -0.046537 & -0.4136 & 0.340133 \tabularnewline
\hline
\end{tabular}
%Source: https://freestatistics.org/blog/index.php?pk=75566&T=2

[TABLE]
[ROW][C]Partial Autocorrelation Function[/C][/ROW]
[ROW][C]Time lag k[/C][C]PACF(k)[/C][C]T-STAT[/C][C]P-value[/C][/ROW]
[ROW][C]1[/C][C]0.320658[/C][C]2.8501[/C][C]0.002786[/C][/ROW]
[ROW][C]2[/C][C]0.179956[/C][C]1.5995[/C][C]0.056853[/C][/ROW]
[ROW][C]3[/C][C]0.032007[/C][C]0.2845[/C][C]0.388392[/C][/ROW]
[ROW][C]4[/C][C]0.074743[/C][C]0.6643[/C][C]0.254207[/C][/ROW]
[ROW][C]5[/C][C]-0.070507[/C][C]-0.6267[/C][C]0.266337[/C][/ROW]
[ROW][C]6[/C][C]-0.291861[/C][C]-2.5941[/C][C]0.00565[/C][/ROW]
[ROW][C]7[/C][C]0.116149[/C][C]1.0324[/C][C]0.152528[/C][/ROW]
[ROW][C]8[/C][C]0.202351[/C][C]1.7985[/C][C]0.037956[/C][/ROW]
[ROW][C]9[/C][C]0.045725[/C][C]0.4064[/C][C]0.34277[/C][/ROW]
[ROW][C]10[/C][C]0.167184[/C][C]1.486[/C][C]0.070634[/C][/ROW]
[ROW][C]11[/C][C]0.090511[/C][C]0.8045[/C][C]0.211768[/C][/ROW]
[ROW][C]12[/C][C]0.401438[/C][C]3.5681[/C][C]0.000307[/C][/ROW]
[ROW][C]13[/C][C]-0.179324[/C][C]-1.5939[/C][C]0.05748[/C][/ROW]
[ROW][C]14[/C][C]-0.229984[/C][C]-2.0441[/C][C]0.022136[/C][/ROW]
[ROW][C]15[/C][C]-0.099891[/C][C]-0.8879[/C][C]0.188657[/C][/ROW]
[ROW][C]16[/C][C]-0.10571[/C][C]-0.9396[/C][C]0.175151[/C][/ROW]
[ROW][C]17[/C][C]0.005354[/C][C]0.0476[/C][C]0.481084[/C][/ROW]
[ROW][C]18[/C][C]-0.130069[/C][C]-1.1561[/C][C]0.125566[/C][/ROW]
[ROW][C]19[/C][C]0.0681[/C][C]0.6053[/C][C]0.273361[/C][/ROW]
[ROW][C]20[/C][C]-0.083201[/C][C]-0.7395[/C][C]0.230896[/C][/ROW]
[ROW][C]21[/C][C]-0.030518[/C][C]-0.2712[/C][C]0.393453[/C][/ROW]
[ROW][C]22[/C][C]-0.150924[/C][C]-1.3414[/C][C]0.09181[/C][/ROW]
[ROW][C]23[/C][C]0.051435[/C][C]0.4572[/C][C]0.324403[/C][/ROW]
[ROW][C]24[/C][C]0.059996[/C][C]0.5333[/C][C]0.297678[/C][/ROW]
[ROW][C]25[/C][C]-0.093393[/C][C]-0.8301[/C][C]0.204494[/C][/ROW]
[ROW][C]26[/C][C]0.001218[/C][C]0.0108[/C][C]0.495694[/C][/ROW]
[ROW][C]27[/C][C]0.009949[/C][C]0.0884[/C][C]0.46488[/C][/ROW]
[ROW][C]28[/C][C]0.010998[/C][C]0.0977[/C][C]0.46119[/C][/ROW]
[ROW][C]29[/C][C]-0.062108[/C][C]-0.552[/C][C]0.291244[/C][/ROW]
[ROW][C]30[/C][C]0.175084[/C][C]1.5562[/C][C]0.061831[/C][/ROW]
[ROW][C]31[/C][C]-0.040448[/C][C]-0.3595[/C][C]0.360088[/C][/ROW]
[ROW][C]32[/C][C]-0.028591[/C][C]-0.2541[/C][C]0.400029[/C][/ROW]
[ROW][C]33[/C][C]0.091454[/C][C]0.8129[/C][C]0.209371[/C][/ROW]
[ROW][C]34[/C][C]-0.010995[/C][C]-0.0977[/C][C]0.461198[/C][/ROW]
[ROW][C]35[/C][C]-0.022055[/C][C]-0.196[/C][C]0.422546[/C][/ROW]
[ROW][C]36[/C][C]0.138303[/C][C]1.2293[/C][C]0.111311[/C][/ROW]
[ROW][C]37[/C][C]-0.07161[/C][C]-0.6365[/C][C]0.26315[/C][/ROW]
[ROW][C]38[/C][C]0.05314[/C][C]0.4723[/C][C]0.319002[/C][/ROW]
[ROW][C]39[/C][C]-0.084159[/C][C]-0.748[/C][C]0.228335[/C][/ROW]
[ROW][C]40[/C][C]-0.037784[/C][C]-0.3358[/C][C]0.368945[/C][/ROW]
[ROW][C]41[/C][C]0.020987[/C][C]0.1865[/C][C]0.426252[/C][/ROW]
[ROW][C]42[/C][C]-0.070687[/C][C]-0.6283[/C][C]0.265816[/C][/ROW]
[ROW][C]43[/C][C]-0.002124[/C][C]-0.0189[/C][C]0.492493[/C][/ROW]
[ROW][C]44[/C][C]0.018733[/C][C]0.1665[/C][C]0.434094[/C][/ROW]
[ROW][C]45[/C][C]-0.098023[/C][C]-0.8712[/C][C]0.19313[/C][/ROW]
[ROW][C]46[/C][C]-0.030568[/C][C]-0.2717[/C][C]0.393284[/C][/ROW]
[ROW][C]47[/C][C]-0.001243[/C][C]-0.011[/C][C]0.495606[/C][/ROW]
[ROW][C]48[/C][C]-0.046537[/C][C]-0.4136[/C][C]0.340133[/C][/ROW]
[/TABLE]
Source: https://freestatistics.org/blog/index.php?pk=75566&T=2

Globally Unique Identifier (entire table): ba.freestatistics.org/blog/index.php?pk=75566&T=2

As an alternative you can also use a QR Code:  

The GUIDs for individual cells are displayed in the table below:

Partial Autocorrelation Function
Time lag kPACF(k)T-STATP-value
10.3206582.85010.002786
20.1799561.59950.056853
30.0320070.28450.388392
40.0747430.66430.254207
5-0.070507-0.62670.266337
6-0.291861-2.59410.00565
70.1161491.03240.152528
80.2023511.79850.037956
90.0457250.40640.34277
100.1671841.4860.070634
110.0905110.80450.211768
120.4014383.56810.000307
13-0.179324-1.59390.05748
14-0.229984-2.04410.022136
15-0.099891-0.88790.188657
16-0.10571-0.93960.175151
170.0053540.04760.481084
18-0.130069-1.15610.125566
190.06810.60530.273361
20-0.083201-0.73950.230896
21-0.030518-0.27120.393453
22-0.150924-1.34140.09181
230.0514350.45720.324403
240.0599960.53330.297678
25-0.093393-0.83010.204494
260.0012180.01080.495694
270.0099490.08840.46488
280.0109980.09770.46119
29-0.062108-0.5520.291244
300.1750841.55620.061831
31-0.040448-0.35950.360088
32-0.028591-0.25410.400029
330.0914540.81290.209371
34-0.010995-0.09770.461198
35-0.022055-0.1960.422546
360.1383031.22930.111311
37-0.07161-0.63650.26315
380.053140.47230.319002
39-0.084159-0.7480.228335
40-0.037784-0.33580.368945
410.0209870.18650.426252
42-0.070687-0.62830.265816
43-0.002124-0.01890.492493
440.0187330.16650.434094
45-0.098023-0.87120.19313
46-0.030568-0.27170.393284
47-0.001243-0.0110.495606
48-0.046537-0.41360.340133


Parameters (Session):
par1 = 48 ; par2 = 1 ; par3 = 0 ; par4 = 0 ; par5 = 12 ; par6 = White Noise ; par7 = 0.95 ;
Parameters (R input):
par1 = 48 ; par2 = 1 ; par3 = 0 ; par4 = 0 ; par5 = 12 ; par6 = White Noise ; par7 = 0.95 ;
R code (references can be found in the software module):
if (par1 == 'Default') {
par1 = 10*log10(length(x))
} else {
par1 <- as.numeric(par1)
}
par2 <- as.numeric(par2)
par3 <- as.numeric(par3)
par4 <- as.numeric(par4)
par5 <- as.numeric(par5)
if (par6 == 'White Noise') par6 <- 'white' else par6 <- 'ma'
par7 <- as.numeric(par7)
if (par2 == 0) {
x <- log(x)
} else {
x <- (x ^ par2 - 1) / par2
}
if (par3 > 0) x <- diff(x,lag=1,difference=par3)
if (par4 > 0) x <- diff(x,lag=par5,difference=par4)
bitmap(file='pic1.png')
racf <- acf(x, par1, main='Autocorrelation', xlab='time lag', ylab='ACF', ci.type=par6, ci=par7, sub=paste('(lambda=',par2,', d=',par3,', D=',par4,', CI=', par7, ', CI type=',par6,')',sep=''))
dev.off()
bitmap(file='pic2.png')
rpacf <- pacf(x,par1,main='Partial Autocorrelation',xlab='lags',ylab='PACF')
dev.off()
(myacf <- c(racf$acf))
(mypacf <- c(rpacf$acf))
lengthx <- length(x)
sqrtn <- sqrt(lengthx)
load(file='createtable')
a<-table.start()
a<-table.row.start(a)
a<-table.element(a,'Autocorrelation Function',4,TRUE)
a<-table.row.end(a)
a<-table.row.start(a)
a<-table.element(a,'Time lag k',header=TRUE)
a<-table.element(a,hyperlink('basics.htm','ACF(k)','click here for more information about the Autocorrelation Function'),header=TRUE)
a<-table.element(a,'T-STAT',header=TRUE)
a<-table.element(a,'P-value',header=TRUE)
a<-table.row.end(a)
for (i in 2:(par1+1)) {
a<-table.row.start(a)
a<-table.element(a,i-1,header=TRUE)
a<-table.element(a,round(myacf[i],6))
mytstat <- myacf[i]*sqrtn
a<-table.element(a,round(mytstat,4))
a<-table.element(a,round(1-pt(abs(mytstat),lengthx),6))
a<-table.row.end(a)
}
a<-table.end(a)
table.save(a,file='mytable.tab')
a<-table.start()
a<-table.row.start(a)
a<-table.element(a,'Partial Autocorrelation Function',4,TRUE)
a<-table.row.end(a)
a<-table.row.start(a)
a<-table.element(a,'Time lag k',header=TRUE)
a<-table.element(a,hyperlink('basics.htm','PACF(k)','click here for more information about the Partial Autocorrelation Function'),header=TRUE)
a<-table.element(a,'T-STAT',header=TRUE)
a<-table.element(a,'P-value',header=TRUE)
a<-table.row.end(a)
for (i in 1:par1) {
a<-table.row.start(a)
a<-table.element(a,i,header=TRUE)
a<-table.element(a,round(mypacf[i],6))
mytstat <- mypacf[i]*sqrtn
a<-table.element(a,round(mytstat,4))
a<-table.element(a,round(1-pt(abs(mytstat),lengthx),6))
a<-table.row.end(a)
}
a<-table.end(a)
table.save(a,file='mytable1.tab')