Free Statistics

of Irreproducible Research!

Author's title

Author*Unverified author*
R Software Modulerwasp_autocorrelation.wasp
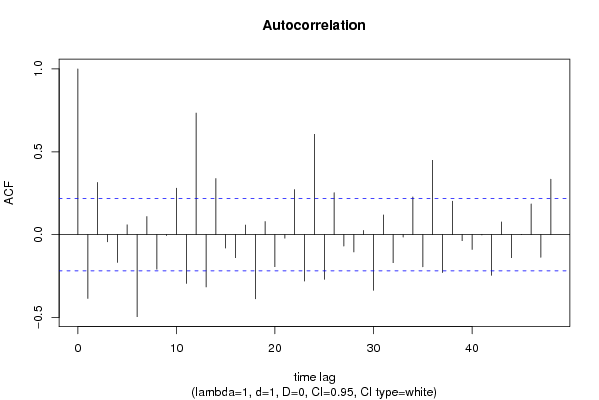
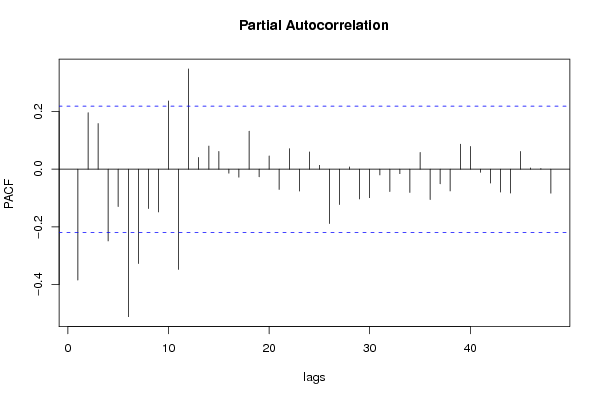
Title produced by software(Partial) Autocorrelation Function
Date of computationWed, 05 May 2010 19:38:09 +0000
Cite this page as followsStatistical Computations at FreeStatistics.org, Office for Research Development and Education, URL https://freestatistics.org/blog/index.php?v=date/2010/May/05/t1273088338pl7ljmvnextn4kd.htm/, Retrieved Sat, 27 Apr 2024 18:55:04 +0000
Statistical Computations at FreeStatistics.org, Office for Research Development and Education, URL https://freestatistics.org/blog/index.php?pk=75576, Retrieved Sat, 27 Apr 2024 18:55:04 +0000
QR Codes:

Original text written by user:
IsPrivate?No (this computation is public)
User-defined keywordsKDGP2W21
Estimated Impact154
Family? (F = Feedback message, R = changed R code, M = changed R Module, P = changed Parameters, D = changed Data)
-       [(Partial) Autocorrelation Function] [Energieverbruik ] [2010-05-05 19:38:09] [dd2ef098fd65ce7e9f689caa343b799f] [Current]
Feedback Forum

Post a new message
Dataseries X:
5.074
4.643
5.451
5.397
5.635
5.708
5.578
5.574
5.352
5.302
4.923
4.982
5.101
4.763
5.505
5.385
5.794
5.695
5.798
5.705
5.422
5.311
4.968
5.053
5.236
4.782
5.531
5.566
5.961
5.868
5.872
5.908
5.594
5.526
5.111
5.177
5.835
5.348
6.038
6.039
6.408
6.214
6.138
6.529
6.058
6.026
5.678
5.733
6.488
5.936
6.84
6.694
7.193
6.991
7.209
7.104
6.83
6.848
6.396
6.414
7.151
6.882
7.698
7.626
7.936
8.054
8.128
8.062
7.708
7.574
7.039
7.146
7.07
6.607
7.699
7.663
7.988
7.723
8.087
8.028
7.362


Summary of computational transaction
Raw Inputview raw input (R code)
Raw Outputview raw output of R engine
Computing time1 seconds
R Server'Gwilym Jenkins' @ 72.249.127.135

\begin{tabular}{lllllllll}
\hline
Summary of computational transaction \tabularnewline
Raw Input & view raw input (R code)  \tabularnewline
Raw Output & view raw output of R engine  \tabularnewline
Computing time & 1 seconds \tabularnewline
R Server & 'Gwilym Jenkins' @ 72.249.127.135 \tabularnewline
\hline
\end{tabular}
%Source: https://freestatistics.org/blog/index.php?pk=75576&T=0

[TABLE]
[ROW][C]Summary of computational transaction[/C][/ROW]
[ROW][C]Raw Input[/C][C]view raw input (R code) [/C][/ROW]
[ROW][C]Raw Output[/C][C]view raw output of R engine [/C][/ROW]
[ROW][C]Computing time[/C][C]1 seconds[/C][/ROW]
[ROW][C]R Server[/C][C]'Gwilym Jenkins' @ 72.249.127.135[/C][/ROW]
[/TABLE]
Source: https://freestatistics.org/blog/index.php?pk=75576&T=0

Globally Unique Identifier (entire table): ba.freestatistics.org/blog/index.php?pk=75576&T=0

As an alternative you can also use a QR Code:  

The GUIDs for individual cells are displayed in the table below:

Summary of computational transaction
Raw Inputview raw input (R code)
Raw Outputview raw output of R engine
Computing time1 seconds
R Server'Gwilym Jenkins' @ 72.249.127.135


Autocorrelation Function
Time lag kACF(k)T-STATP-value
1-0.385061-3.44410.000457
20.3152022.81930.003033
3-0.043611-0.39010.348762
4-0.167699-1.49990.068782
50.0589150.5270.299842
6-0.49533-4.43041.5e-05
70.1091980.97670.165831
8-0.208964-1.8690.032639
9-0.006169-0.05520.478068
100.2802212.50640.007112
11-0.294522-2.63430.00506
120.7337626.5630
13-0.31584-2.8250.002984
140.3386533.0290.001651
15-0.08116-0.72590.235005
16-0.139038-1.24360.108641
170.0576020.51520.303914
18-0.3877-3.46770.000424
190.0790520.70710.24079
20-0.19401-1.73530.043271
21-0.021782-0.19480.423011
220.2721962.43460.008567
23-0.280328-2.50730.007095
240.6055595.41630
25-0.269606-2.41140.009091
260.2528812.26180.013211
27-0.069311-0.61990.268532
28-0.104296-0.93290.176851
290.0248650.22240.412285
30-0.336599-3.01060.001744
310.1187851.06240.145615
32-0.169242-1.51370.067016
33-0.014728-0.13170.447765
340.2273152.03320.022676
35-0.194659-1.74110.042757
360.4481834.00876.8e-05
37-0.228834-2.04680.021983
380.2017511.80450.037457
39-0.036936-0.33040.370993
40-0.089575-0.80120.212698
41-0.001814-0.01620.493549
42-0.245478-2.19560.015508
430.0761820.68140.248797
44-0.139597-1.24860.107728
450.0013780.01230.495097
460.1852381.65680.050736
47-0.136824-1.22380.112312
480.3342342.98950.001856

\begin{tabular}{lllllllll}
\hline
Autocorrelation Function \tabularnewline
Time lag k & ACF(k) & T-STAT & P-value \tabularnewline
1 & -0.385061 & -3.4441 & 0.000457 \tabularnewline
2 & 0.315202 & 2.8193 & 0.003033 \tabularnewline
3 & -0.043611 & -0.3901 & 0.348762 \tabularnewline
4 & -0.167699 & -1.4999 & 0.068782 \tabularnewline
5 & 0.058915 & 0.527 & 0.299842 \tabularnewline
6 & -0.49533 & -4.4304 & 1.5e-05 \tabularnewline
7 & 0.109198 & 0.9767 & 0.165831 \tabularnewline
8 & -0.208964 & -1.869 & 0.032639 \tabularnewline
9 & -0.006169 & -0.0552 & 0.478068 \tabularnewline
10 & 0.280221 & 2.5064 & 0.007112 \tabularnewline
11 & -0.294522 & -2.6343 & 0.00506 \tabularnewline
12 & 0.733762 & 6.563 & 0 \tabularnewline
13 & -0.31584 & -2.825 & 0.002984 \tabularnewline
14 & 0.338653 & 3.029 & 0.001651 \tabularnewline
15 & -0.08116 & -0.7259 & 0.235005 \tabularnewline
16 & -0.139038 & -1.2436 & 0.108641 \tabularnewline
17 & 0.057602 & 0.5152 & 0.303914 \tabularnewline
18 & -0.3877 & -3.4677 & 0.000424 \tabularnewline
19 & 0.079052 & 0.7071 & 0.24079 \tabularnewline
20 & -0.19401 & -1.7353 & 0.043271 \tabularnewline
21 & -0.021782 & -0.1948 & 0.423011 \tabularnewline
22 & 0.272196 & 2.4346 & 0.008567 \tabularnewline
23 & -0.280328 & -2.5073 & 0.007095 \tabularnewline
24 & 0.605559 & 5.4163 & 0 \tabularnewline
25 & -0.269606 & -2.4114 & 0.009091 \tabularnewline
26 & 0.252881 & 2.2618 & 0.013211 \tabularnewline
27 & -0.069311 & -0.6199 & 0.268532 \tabularnewline
28 & -0.104296 & -0.9329 & 0.176851 \tabularnewline
29 & 0.024865 & 0.2224 & 0.412285 \tabularnewline
30 & -0.336599 & -3.0106 & 0.001744 \tabularnewline
31 & 0.118785 & 1.0624 & 0.145615 \tabularnewline
32 & -0.169242 & -1.5137 & 0.067016 \tabularnewline
33 & -0.014728 & -0.1317 & 0.447765 \tabularnewline
34 & 0.227315 & 2.0332 & 0.022676 \tabularnewline
35 & -0.194659 & -1.7411 & 0.042757 \tabularnewline
36 & 0.448183 & 4.0087 & 6.8e-05 \tabularnewline
37 & -0.228834 & -2.0468 & 0.021983 \tabularnewline
38 & 0.201751 & 1.8045 & 0.037457 \tabularnewline
39 & -0.036936 & -0.3304 & 0.370993 \tabularnewline
40 & -0.089575 & -0.8012 & 0.212698 \tabularnewline
41 & -0.001814 & -0.0162 & 0.493549 \tabularnewline
42 & -0.245478 & -2.1956 & 0.015508 \tabularnewline
43 & 0.076182 & 0.6814 & 0.248797 \tabularnewline
44 & -0.139597 & -1.2486 & 0.107728 \tabularnewline
45 & 0.001378 & 0.0123 & 0.495097 \tabularnewline
46 & 0.185238 & 1.6568 & 0.050736 \tabularnewline
47 & -0.136824 & -1.2238 & 0.112312 \tabularnewline
48 & 0.334234 & 2.9895 & 0.001856 \tabularnewline
\hline
\end{tabular}
%Source: https://freestatistics.org/blog/index.php?pk=75576&T=1

[TABLE]
[ROW][C]Autocorrelation Function[/C][/ROW]
[ROW][C]Time lag k[/C][C]ACF(k)[/C][C]T-STAT[/C][C]P-value[/C][/ROW]
[ROW][C]1[/C][C]-0.385061[/C][C]-3.4441[/C][C]0.000457[/C][/ROW]
[ROW][C]2[/C][C]0.315202[/C][C]2.8193[/C][C]0.003033[/C][/ROW]
[ROW][C]3[/C][C]-0.043611[/C][C]-0.3901[/C][C]0.348762[/C][/ROW]
[ROW][C]4[/C][C]-0.167699[/C][C]-1.4999[/C][C]0.068782[/C][/ROW]
[ROW][C]5[/C][C]0.058915[/C][C]0.527[/C][C]0.299842[/C][/ROW]
[ROW][C]6[/C][C]-0.49533[/C][C]-4.4304[/C][C]1.5e-05[/C][/ROW]
[ROW][C]7[/C][C]0.109198[/C][C]0.9767[/C][C]0.165831[/C][/ROW]
[ROW][C]8[/C][C]-0.208964[/C][C]-1.869[/C][C]0.032639[/C][/ROW]
[ROW][C]9[/C][C]-0.006169[/C][C]-0.0552[/C][C]0.478068[/C][/ROW]
[ROW][C]10[/C][C]0.280221[/C][C]2.5064[/C][C]0.007112[/C][/ROW]
[ROW][C]11[/C][C]-0.294522[/C][C]-2.6343[/C][C]0.00506[/C][/ROW]
[ROW][C]12[/C][C]0.733762[/C][C]6.563[/C][C]0[/C][/ROW]
[ROW][C]13[/C][C]-0.31584[/C][C]-2.825[/C][C]0.002984[/C][/ROW]
[ROW][C]14[/C][C]0.338653[/C][C]3.029[/C][C]0.001651[/C][/ROW]
[ROW][C]15[/C][C]-0.08116[/C][C]-0.7259[/C][C]0.235005[/C][/ROW]
[ROW][C]16[/C][C]-0.139038[/C][C]-1.2436[/C][C]0.108641[/C][/ROW]
[ROW][C]17[/C][C]0.057602[/C][C]0.5152[/C][C]0.303914[/C][/ROW]
[ROW][C]18[/C][C]-0.3877[/C][C]-3.4677[/C][C]0.000424[/C][/ROW]
[ROW][C]19[/C][C]0.079052[/C][C]0.7071[/C][C]0.24079[/C][/ROW]
[ROW][C]20[/C][C]-0.19401[/C][C]-1.7353[/C][C]0.043271[/C][/ROW]
[ROW][C]21[/C][C]-0.021782[/C][C]-0.1948[/C][C]0.423011[/C][/ROW]
[ROW][C]22[/C][C]0.272196[/C][C]2.4346[/C][C]0.008567[/C][/ROW]
[ROW][C]23[/C][C]-0.280328[/C][C]-2.5073[/C][C]0.007095[/C][/ROW]
[ROW][C]24[/C][C]0.605559[/C][C]5.4163[/C][C]0[/C][/ROW]
[ROW][C]25[/C][C]-0.269606[/C][C]-2.4114[/C][C]0.009091[/C][/ROW]
[ROW][C]26[/C][C]0.252881[/C][C]2.2618[/C][C]0.013211[/C][/ROW]
[ROW][C]27[/C][C]-0.069311[/C][C]-0.6199[/C][C]0.268532[/C][/ROW]
[ROW][C]28[/C][C]-0.104296[/C][C]-0.9329[/C][C]0.176851[/C][/ROW]
[ROW][C]29[/C][C]0.024865[/C][C]0.2224[/C][C]0.412285[/C][/ROW]
[ROW][C]30[/C][C]-0.336599[/C][C]-3.0106[/C][C]0.001744[/C][/ROW]
[ROW][C]31[/C][C]0.118785[/C][C]1.0624[/C][C]0.145615[/C][/ROW]
[ROW][C]32[/C][C]-0.169242[/C][C]-1.5137[/C][C]0.067016[/C][/ROW]
[ROW][C]33[/C][C]-0.014728[/C][C]-0.1317[/C][C]0.447765[/C][/ROW]
[ROW][C]34[/C][C]0.227315[/C][C]2.0332[/C][C]0.022676[/C][/ROW]
[ROW][C]35[/C][C]-0.194659[/C][C]-1.7411[/C][C]0.042757[/C][/ROW]
[ROW][C]36[/C][C]0.448183[/C][C]4.0087[/C][C]6.8e-05[/C][/ROW]
[ROW][C]37[/C][C]-0.228834[/C][C]-2.0468[/C][C]0.021983[/C][/ROW]
[ROW][C]38[/C][C]0.201751[/C][C]1.8045[/C][C]0.037457[/C][/ROW]
[ROW][C]39[/C][C]-0.036936[/C][C]-0.3304[/C][C]0.370993[/C][/ROW]
[ROW][C]40[/C][C]-0.089575[/C][C]-0.8012[/C][C]0.212698[/C][/ROW]
[ROW][C]41[/C][C]-0.001814[/C][C]-0.0162[/C][C]0.493549[/C][/ROW]
[ROW][C]42[/C][C]-0.245478[/C][C]-2.1956[/C][C]0.015508[/C][/ROW]
[ROW][C]43[/C][C]0.076182[/C][C]0.6814[/C][C]0.248797[/C][/ROW]
[ROW][C]44[/C][C]-0.139597[/C][C]-1.2486[/C][C]0.107728[/C][/ROW]
[ROW][C]45[/C][C]0.001378[/C][C]0.0123[/C][C]0.495097[/C][/ROW]
[ROW][C]46[/C][C]0.185238[/C][C]1.6568[/C][C]0.050736[/C][/ROW]
[ROW][C]47[/C][C]-0.136824[/C][C]-1.2238[/C][C]0.112312[/C][/ROW]
[ROW][C]48[/C][C]0.334234[/C][C]2.9895[/C][C]0.001856[/C][/ROW]
[/TABLE]
Source: https://freestatistics.org/blog/index.php?pk=75576&T=1

Globally Unique Identifier (entire table): ba.freestatistics.org/blog/index.php?pk=75576&T=1

As an alternative you can also use a QR Code:  

The GUIDs for individual cells are displayed in the table below:

Autocorrelation Function
Time lag kACF(k)T-STATP-value
1-0.385061-3.44410.000457
20.3152022.81930.003033
3-0.043611-0.39010.348762
4-0.167699-1.49990.068782
50.0589150.5270.299842
6-0.49533-4.43041.5e-05
70.1091980.97670.165831
8-0.208964-1.8690.032639
9-0.006169-0.05520.478068
100.2802212.50640.007112
11-0.294522-2.63430.00506
120.7337626.5630
13-0.31584-2.8250.002984
140.3386533.0290.001651
15-0.08116-0.72590.235005
16-0.139038-1.24360.108641
170.0576020.51520.303914
18-0.3877-3.46770.000424
190.0790520.70710.24079
20-0.19401-1.73530.043271
21-0.021782-0.19480.423011
220.2721962.43460.008567
23-0.280328-2.50730.007095
240.6055595.41630
25-0.269606-2.41140.009091
260.2528812.26180.013211
27-0.069311-0.61990.268532
28-0.104296-0.93290.176851
290.0248650.22240.412285
30-0.336599-3.01060.001744
310.1187851.06240.145615
32-0.169242-1.51370.067016
33-0.014728-0.13170.447765
340.2273152.03320.022676
35-0.194659-1.74110.042757
360.4481834.00876.8e-05
37-0.228834-2.04680.021983
380.2017511.80450.037457
39-0.036936-0.33040.370993
40-0.089575-0.80120.212698
41-0.001814-0.01620.493549
42-0.245478-2.19560.015508
430.0761820.68140.248797
44-0.139597-1.24860.107728
450.0013780.01230.495097
460.1852381.65680.050736
47-0.136824-1.22380.112312
480.3342342.98950.001856


Partial Autocorrelation Function
Time lag kPACF(k)T-STATP-value
1-0.385061-3.44410.000457
20.195991.7530.041718
30.1580461.41360.080678
4-0.249067-2.22770.014354
5-0.129825-1.16120.124509
6-0.511977-4.57938e-06
7-0.327794-2.93190.002196
8-0.1367-1.22270.11252
9-0.148637-1.32940.093739
100.2365882.11610.018722
11-0.347942-3.11210.001288
120.3477493.11040.001295
130.0408280.36520.357972
140.0798940.71460.238471
150.0615410.55040.291777
16-0.014008-0.12530.450305
17-0.027784-0.24850.402188
180.1315741.17680.121375
19-0.02646-0.23670.406761
200.0459830.41130.340982
21-0.070299-0.62880.265644
220.0711130.63610.263279
23-0.076155-0.68120.248871
240.0596290.53330.29764
250.0132570.11860.452956
26-0.189081-1.69120.047346
27-0.123126-1.10130.13704
280.0075870.06790.473034
29-0.103487-0.92560.178715
30-0.098988-0.88540.189304
31-0.02026-0.18120.428331
32-0.07788-0.69660.244043
33-0.015976-0.14290.443366
34-0.080649-0.72130.236401
350.05780.5170.303297
36-0.105527-0.94390.174041
37-0.050854-0.45490.325224
38-0.075762-0.67760.249979
390.0867780.77620.21997
400.0786260.70330.24197
41-0.011117-0.09940.460521
42-0.048276-0.43180.333527
43-0.079395-0.71010.239844
44-0.082888-0.74140.230318
450.0613180.54840.292456
460.0041760.03730.48515
470.0019320.01730.493128
48-0.083627-0.7480.228331

\begin{tabular}{lllllllll}
\hline
Partial Autocorrelation Function \tabularnewline
Time lag k & PACF(k) & T-STAT & P-value \tabularnewline
1 & -0.385061 & -3.4441 & 0.000457 \tabularnewline
2 & 0.19599 & 1.753 & 0.041718 \tabularnewline
3 & 0.158046 & 1.4136 & 0.080678 \tabularnewline
4 & -0.249067 & -2.2277 & 0.014354 \tabularnewline
5 & -0.129825 & -1.1612 & 0.124509 \tabularnewline
6 & -0.511977 & -4.5793 & 8e-06 \tabularnewline
7 & -0.327794 & -2.9319 & 0.002196 \tabularnewline
8 & -0.1367 & -1.2227 & 0.11252 \tabularnewline
9 & -0.148637 & -1.3294 & 0.093739 \tabularnewline
10 & 0.236588 & 2.1161 & 0.018722 \tabularnewline
11 & -0.347942 & -3.1121 & 0.001288 \tabularnewline
12 & 0.347749 & 3.1104 & 0.001295 \tabularnewline
13 & 0.040828 & 0.3652 & 0.357972 \tabularnewline
14 & 0.079894 & 0.7146 & 0.238471 \tabularnewline
15 & 0.061541 & 0.5504 & 0.291777 \tabularnewline
16 & -0.014008 & -0.1253 & 0.450305 \tabularnewline
17 & -0.027784 & -0.2485 & 0.402188 \tabularnewline
18 & 0.131574 & 1.1768 & 0.121375 \tabularnewline
19 & -0.02646 & -0.2367 & 0.406761 \tabularnewline
20 & 0.045983 & 0.4113 & 0.340982 \tabularnewline
21 & -0.070299 & -0.6288 & 0.265644 \tabularnewline
22 & 0.071113 & 0.6361 & 0.263279 \tabularnewline
23 & -0.076155 & -0.6812 & 0.248871 \tabularnewline
24 & 0.059629 & 0.5333 & 0.29764 \tabularnewline
25 & 0.013257 & 0.1186 & 0.452956 \tabularnewline
26 & -0.189081 & -1.6912 & 0.047346 \tabularnewline
27 & -0.123126 & -1.1013 & 0.13704 \tabularnewline
28 & 0.007587 & 0.0679 & 0.473034 \tabularnewline
29 & -0.103487 & -0.9256 & 0.178715 \tabularnewline
30 & -0.098988 & -0.8854 & 0.189304 \tabularnewline
31 & -0.02026 & -0.1812 & 0.428331 \tabularnewline
32 & -0.07788 & -0.6966 & 0.244043 \tabularnewline
33 & -0.015976 & -0.1429 & 0.443366 \tabularnewline
34 & -0.080649 & -0.7213 & 0.236401 \tabularnewline
35 & 0.0578 & 0.517 & 0.303297 \tabularnewline
36 & -0.105527 & -0.9439 & 0.174041 \tabularnewline
37 & -0.050854 & -0.4549 & 0.325224 \tabularnewline
38 & -0.075762 & -0.6776 & 0.249979 \tabularnewline
39 & 0.086778 & 0.7762 & 0.21997 \tabularnewline
40 & 0.078626 & 0.7033 & 0.24197 \tabularnewline
41 & -0.011117 & -0.0994 & 0.460521 \tabularnewline
42 & -0.048276 & -0.4318 & 0.333527 \tabularnewline
43 & -0.079395 & -0.7101 & 0.239844 \tabularnewline
44 & -0.082888 & -0.7414 & 0.230318 \tabularnewline
45 & 0.061318 & 0.5484 & 0.292456 \tabularnewline
46 & 0.004176 & 0.0373 & 0.48515 \tabularnewline
47 & 0.001932 & 0.0173 & 0.493128 \tabularnewline
48 & -0.083627 & -0.748 & 0.228331 \tabularnewline
\hline
\end{tabular}
%Source: https://freestatistics.org/blog/index.php?pk=75576&T=2

[TABLE]
[ROW][C]Partial Autocorrelation Function[/C][/ROW]
[ROW][C]Time lag k[/C][C]PACF(k)[/C][C]T-STAT[/C][C]P-value[/C][/ROW]
[ROW][C]1[/C][C]-0.385061[/C][C]-3.4441[/C][C]0.000457[/C][/ROW]
[ROW][C]2[/C][C]0.19599[/C][C]1.753[/C][C]0.041718[/C][/ROW]
[ROW][C]3[/C][C]0.158046[/C][C]1.4136[/C][C]0.080678[/C][/ROW]
[ROW][C]4[/C][C]-0.249067[/C][C]-2.2277[/C][C]0.014354[/C][/ROW]
[ROW][C]5[/C][C]-0.129825[/C][C]-1.1612[/C][C]0.124509[/C][/ROW]
[ROW][C]6[/C][C]-0.511977[/C][C]-4.5793[/C][C]8e-06[/C][/ROW]
[ROW][C]7[/C][C]-0.327794[/C][C]-2.9319[/C][C]0.002196[/C][/ROW]
[ROW][C]8[/C][C]-0.1367[/C][C]-1.2227[/C][C]0.11252[/C][/ROW]
[ROW][C]9[/C][C]-0.148637[/C][C]-1.3294[/C][C]0.093739[/C][/ROW]
[ROW][C]10[/C][C]0.236588[/C][C]2.1161[/C][C]0.018722[/C][/ROW]
[ROW][C]11[/C][C]-0.347942[/C][C]-3.1121[/C][C]0.001288[/C][/ROW]
[ROW][C]12[/C][C]0.347749[/C][C]3.1104[/C][C]0.001295[/C][/ROW]
[ROW][C]13[/C][C]0.040828[/C][C]0.3652[/C][C]0.357972[/C][/ROW]
[ROW][C]14[/C][C]0.079894[/C][C]0.7146[/C][C]0.238471[/C][/ROW]
[ROW][C]15[/C][C]0.061541[/C][C]0.5504[/C][C]0.291777[/C][/ROW]
[ROW][C]16[/C][C]-0.014008[/C][C]-0.1253[/C][C]0.450305[/C][/ROW]
[ROW][C]17[/C][C]-0.027784[/C][C]-0.2485[/C][C]0.402188[/C][/ROW]
[ROW][C]18[/C][C]0.131574[/C][C]1.1768[/C][C]0.121375[/C][/ROW]
[ROW][C]19[/C][C]-0.02646[/C][C]-0.2367[/C][C]0.406761[/C][/ROW]
[ROW][C]20[/C][C]0.045983[/C][C]0.4113[/C][C]0.340982[/C][/ROW]
[ROW][C]21[/C][C]-0.070299[/C][C]-0.6288[/C][C]0.265644[/C][/ROW]
[ROW][C]22[/C][C]0.071113[/C][C]0.6361[/C][C]0.263279[/C][/ROW]
[ROW][C]23[/C][C]-0.076155[/C][C]-0.6812[/C][C]0.248871[/C][/ROW]
[ROW][C]24[/C][C]0.059629[/C][C]0.5333[/C][C]0.29764[/C][/ROW]
[ROW][C]25[/C][C]0.013257[/C][C]0.1186[/C][C]0.452956[/C][/ROW]
[ROW][C]26[/C][C]-0.189081[/C][C]-1.6912[/C][C]0.047346[/C][/ROW]
[ROW][C]27[/C][C]-0.123126[/C][C]-1.1013[/C][C]0.13704[/C][/ROW]
[ROW][C]28[/C][C]0.007587[/C][C]0.0679[/C][C]0.473034[/C][/ROW]
[ROW][C]29[/C][C]-0.103487[/C][C]-0.9256[/C][C]0.178715[/C][/ROW]
[ROW][C]30[/C][C]-0.098988[/C][C]-0.8854[/C][C]0.189304[/C][/ROW]
[ROW][C]31[/C][C]-0.02026[/C][C]-0.1812[/C][C]0.428331[/C][/ROW]
[ROW][C]32[/C][C]-0.07788[/C][C]-0.6966[/C][C]0.244043[/C][/ROW]
[ROW][C]33[/C][C]-0.015976[/C][C]-0.1429[/C][C]0.443366[/C][/ROW]
[ROW][C]34[/C][C]-0.080649[/C][C]-0.7213[/C][C]0.236401[/C][/ROW]
[ROW][C]35[/C][C]0.0578[/C][C]0.517[/C][C]0.303297[/C][/ROW]
[ROW][C]36[/C][C]-0.105527[/C][C]-0.9439[/C][C]0.174041[/C][/ROW]
[ROW][C]37[/C][C]-0.050854[/C][C]-0.4549[/C][C]0.325224[/C][/ROW]
[ROW][C]38[/C][C]-0.075762[/C][C]-0.6776[/C][C]0.249979[/C][/ROW]
[ROW][C]39[/C][C]0.086778[/C][C]0.7762[/C][C]0.21997[/C][/ROW]
[ROW][C]40[/C][C]0.078626[/C][C]0.7033[/C][C]0.24197[/C][/ROW]
[ROW][C]41[/C][C]-0.011117[/C][C]-0.0994[/C][C]0.460521[/C][/ROW]
[ROW][C]42[/C][C]-0.048276[/C][C]-0.4318[/C][C]0.333527[/C][/ROW]
[ROW][C]43[/C][C]-0.079395[/C][C]-0.7101[/C][C]0.239844[/C][/ROW]
[ROW][C]44[/C][C]-0.082888[/C][C]-0.7414[/C][C]0.230318[/C][/ROW]
[ROW][C]45[/C][C]0.061318[/C][C]0.5484[/C][C]0.292456[/C][/ROW]
[ROW][C]46[/C][C]0.004176[/C][C]0.0373[/C][C]0.48515[/C][/ROW]
[ROW][C]47[/C][C]0.001932[/C][C]0.0173[/C][C]0.493128[/C][/ROW]
[ROW][C]48[/C][C]-0.083627[/C][C]-0.748[/C][C]0.228331[/C][/ROW]
[/TABLE]
Source: https://freestatistics.org/blog/index.php?pk=75576&T=2

Globally Unique Identifier (entire table): ba.freestatistics.org/blog/index.php?pk=75576&T=2

As an alternative you can also use a QR Code:  

The GUIDs for individual cells are displayed in the table below:

Partial Autocorrelation Function
Time lag kPACF(k)T-STATP-value
1-0.385061-3.44410.000457
20.195991.7530.041718
30.1580461.41360.080678
4-0.249067-2.22770.014354
5-0.129825-1.16120.124509
6-0.511977-4.57938e-06
7-0.327794-2.93190.002196
8-0.1367-1.22270.11252
9-0.148637-1.32940.093739
100.2365882.11610.018722
11-0.347942-3.11210.001288
120.3477493.11040.001295
130.0408280.36520.357972
140.0798940.71460.238471
150.0615410.55040.291777
16-0.014008-0.12530.450305
17-0.027784-0.24850.402188
180.1315741.17680.121375
19-0.02646-0.23670.406761
200.0459830.41130.340982
21-0.070299-0.62880.265644
220.0711130.63610.263279
23-0.076155-0.68120.248871
240.0596290.53330.29764
250.0132570.11860.452956
26-0.189081-1.69120.047346
27-0.123126-1.10130.13704
280.0075870.06790.473034
29-0.103487-0.92560.178715
30-0.098988-0.88540.189304
31-0.02026-0.18120.428331
32-0.07788-0.69660.244043
33-0.015976-0.14290.443366
34-0.080649-0.72130.236401
350.05780.5170.303297
36-0.105527-0.94390.174041
37-0.050854-0.45490.325224
38-0.075762-0.67760.249979
390.0867780.77620.21997
400.0786260.70330.24197
41-0.011117-0.09940.460521
42-0.048276-0.43180.333527
43-0.079395-0.71010.239844
44-0.082888-0.74140.230318
450.0613180.54840.292456
460.0041760.03730.48515
470.0019320.01730.493128
48-0.083627-0.7480.228331


Parameters (Session):
par1 = 48 ; par2 = 1 ; par3 = 1 ; par4 = 0 ; par5 = 12 ; par6 = White Noise ; par7 = 0.95 ;
Parameters (R input):
par1 = 48 ; par2 = 1 ; par3 = 1 ; par4 = 0 ; par5 = 12 ; par6 = White Noise ; par7 = 0.95 ;
R code (references can be found in the software module):
if (par1 == 'Default') {
par1 = 10*log10(length(x))
} else {
par1 <- as.numeric(par1)
}
par2 <- as.numeric(par2)
par3 <- as.numeric(par3)
par4 <- as.numeric(par4)
par5 <- as.numeric(par5)
if (par6 == 'White Noise') par6 <- 'white' else par6 <- 'ma'
par7 <- as.numeric(par7)
if (par2 == 0) {
x <- log(x)
} else {
x <- (x ^ par2 - 1) / par2
}
if (par3 > 0) x <- diff(x,lag=1,difference=par3)
if (par4 > 0) x <- diff(x,lag=par5,difference=par4)
bitmap(file='pic1.png')
racf <- acf(x, par1, main='Autocorrelation', xlab='time lag', ylab='ACF', ci.type=par6, ci=par7, sub=paste('(lambda=',par2,', d=',par3,', D=',par4,', CI=', par7, ', CI type=',par6,')',sep=''))
dev.off()
bitmap(file='pic2.png')
rpacf <- pacf(x,par1,main='Partial Autocorrelation',xlab='lags',ylab='PACF')
dev.off()
(myacf <- c(racf$acf))
(mypacf <- c(rpacf$acf))
lengthx <- length(x)
sqrtn <- sqrt(lengthx)
load(file='createtable')
a<-table.start()
a<-table.row.start(a)
a<-table.element(a,'Autocorrelation Function',4,TRUE)
a<-table.row.end(a)
a<-table.row.start(a)
a<-table.element(a,'Time lag k',header=TRUE)
a<-table.element(a,hyperlink('basics.htm','ACF(k)','click here for more information about the Autocorrelation Function'),header=TRUE)
a<-table.element(a,'T-STAT',header=TRUE)
a<-table.element(a,'P-value',header=TRUE)
a<-table.row.end(a)
for (i in 2:(par1+1)) {
a<-table.row.start(a)
a<-table.element(a,i-1,header=TRUE)
a<-table.element(a,round(myacf[i],6))
mytstat <- myacf[i]*sqrtn
a<-table.element(a,round(mytstat,4))
a<-table.element(a,round(1-pt(abs(mytstat),lengthx),6))
a<-table.row.end(a)
}
a<-table.end(a)
table.save(a,file='mytable.tab')
a<-table.start()
a<-table.row.start(a)
a<-table.element(a,'Partial Autocorrelation Function',4,TRUE)
a<-table.row.end(a)
a<-table.row.start(a)
a<-table.element(a,'Time lag k',header=TRUE)
a<-table.element(a,hyperlink('basics.htm','PACF(k)','click here for more information about the Partial Autocorrelation Function'),header=TRUE)
a<-table.element(a,'T-STAT',header=TRUE)
a<-table.element(a,'P-value',header=TRUE)
a<-table.row.end(a)
for (i in 1:par1) {
a<-table.row.start(a)
a<-table.element(a,i,header=TRUE)
a<-table.element(a,round(mypacf[i],6))
mytstat <- mypacf[i]*sqrtn
a<-table.element(a,round(mytstat,4))
a<-table.element(a,round(1-pt(abs(mytstat),lengthx),6))
a<-table.row.end(a)
}
a<-table.end(a)
table.save(a,file='mytable1.tab')